Introduction
A previous study has shown that breast cancer women with a cognitive style of self-reported negative attentional bias and ruminative cognitive processing were related to the symptoms of posttraumatic stress disorder (PTSD)(Chan, Ho, Tedeschi, & Leung, 2011). However, the use of self-reports in that study may subject to both social desirability effect and biases due to respondent’s conscious awareness and introspection(Jansen, Nederkoorn, & Mulkens, 2005). Such subjective reports may not entirely capture the cognitive processes that predict posttraumatic responses. On the other hand, literature has widely used variants of the dotprobe tasks to examine attentional bias(Mobini & Grant, 2007). MacLeod, Mathews and Tata (1986)designed the dot-probe paradigm. In this task, two stimuli, one threat-related and one neutral, are shown briefly on each trial, followed by a small probe which replaces one of the stimuli. Participants are required to respond as fast as possible to the probe. Attentional bias toward threat is shown when participants respond to probes that replace threat-related faster than those replace neutral stimuli. In the dot-probe paradigm, the neutral and threat-related pictures compete for the participants’ attention.
Based on the above literature review, the present study was conducted to examine the previous findings of Chan et al.(2011)further using a visual dotprobe task(MacLeod, et al., 1986). To the best of our knowledge, no studies thus far have specifically examined the cognitive style of dispositional attentional bias to valenced stimuli (by using experimental paradigm as measurement of attentional tendencies) in relation to psychological adjustment in cancer experience. The major purpose of the present study was to examine if individual differences in attentional biases, in terms of real-time responses to valenced stimuli, associated with the symptoms of PTSD. More specifically, the aim was to investigate the correlations between the cognitive style of selective attention to valenced stimuli, i.e. positive and negatives stimuli, using experimental response-based measures and standardized self-report measure of the symptoms of PTSD.
Method
Participants
Fifty-six women with breast cancer were recruited from the Queen Elizabeth Hospital, Hong Kong. The ages of the participants ranged from 35 to 59 years (Mean ± SD: 50.23 ± 6.58 years). Marital status included 19.6% who were single, 71.4% married, 7.1% divorced or separated, 1.8% cohabited and no widowed. About education level, 12.5% of the participants had completed primary education; 35.7% had attained Grade 9 level; 30.4% had attained Grade 11 level; 8.9% had completed high school; and 12.5% had gained a university undergraduate degree. The onset duration of breast cancer among these participants ranged from 4.14 months to 28.06 months (Mean = 15.34 months, S.D. = 5.94 months), 28.60% with the onset period within 1 year since first diagnosis, 66.10% within one to two years, and 5.40% with more than two years. Regarding the treatments received, all participants had undergone surgery, with 62.5% received modified radical mastectomy and 37.5% received lumpectomy (breast-conservative surgery). As for post-surgery adjuvant treatments, 66.10% subsequently received radiation therapy and 64.30% received chemotherapy. All participants had completed their active cancer treatment when they were recruited. 73.08% were receiving continuous hormonal therapy (Tamoxifen or Arimidex) at the time when they participated in this study. Regarding the stages of cancer diagnosed among the participants, 19.6% were in Stage 0 (ductal carcinoma-in-situ); 37.5% were in Stage 1; 32.1% were in Stage 2; and 10.7% were in Stage 3.
Measures
Chinese Impact of Event Scale – R (CIES-R) (Wu & Chan, 2003). The 22-item scale was used to measure psychological adjustment. Participants were asked to report the degree of distress for each item (i.e., symptom) pertaining to breast cancer (the focused event). Each item was rated on a 5-point Likert scale, ranging from 0 (the absence of a symptom) to 4 (maximal symptoms). The22-item scale has three subscales tapping PTSD symptoms related to intrusion, avoidance and hyperarousal respectively. A CIES-R total score was also computed by adding the three subscale scores. The internal consistencies in the present study were strong (Total, α = .95; Intrusion, α = .91; Avoidance, α = .85; Hyperarousal, α = .89). Furthermore, a cutoff of 33 or above on the English version was suggested to have the best diagnostic accuracy with a sensitivity of .91 and a specificity of .82 (Creamer, Bell, & Failla, 2003).
Chinese Hospital Anxiety and Depression Scale (CHADS) (Leung, Ho, Kan, Hung, & Chen, 1993). The 14-item scale was designed for measuring the psychological status of patients with physical illnesses. The Chinese version has been demonstrated good internal consistency and equivalency to the original English version (Zigmond & Snaith, 1983). Each item was rated on a 4-point Likert scale, ranging from 0 to 3, whereas higher scores indicating higher levels of anxiety or depression. CHADS has two 7-item subscales for measuring anxiety and depression accordingly. The internal consistencies in the present study were good (anxiety, α = .87; depression, α = .83). A cutoff of 8 or above on each subscale achieved the best sensitivity and specificity approximately .80 from a systematic review study (Bjelland, Dahl, Haug, & Neckelmann, 2002).
Demographic and Medical Information. A demographic questionnaire was included to obtain personal information including age, educational level, marital status, monthly family income, and religion. Medical information comprising stage of cancer diagnosed, duration since onset of cancer, and treatments was obtained from patients’ medical records.
The Dot-Probe Task
Materials
Experimental measures of cognitive biases were presented on an IBM computer and a Sony 15-inch color monitor. Presentation Version 12.1 software (2012) was used for stimulus delivery, experimental control, and record of response accuracy and latency. The experimenter took 330 photographs of faces of Chinese volunteers (all aged from 20 to 60 years) posing different emotions (happy, sad and neutral). All of the images were digitized and converted into gray-scale.
The entire set of faces was rated independently by four university graduate raters on a happiness scale and a sadness scale respectively ranging from 1 (no emotion) to 7 (extreme emotion) and the faces were categorized according to criteria which Gotlib et al. (2004) adopted. Finally, 20 photographs of faces were used as neutral stimuli. Ten of the neutral faces paired with10 happy (positive) expressions of the same faces repectively; similarly, the other 10 neutral faces paired with10 sad (negative) faces respectively. Same faces were paired up so as to ensure that the two stimuli only differed in terms of emotional expression. Within each emotion category, half of the photographs were of males and half were of females. Ten additional neutral faces were used to create neutral-neutral face pairs (of the same face) for practice trials.
Intraclass correlation (ICC) coefficients measure consistencies between raters (Shrout & Fleiss, 1979). According to Breton et al.’s (1998)classification, raters in this study had excellent consistency in rating on both the happiness scale and the sadness scale (happiness scale: ICC median = .94; range = .93 – .95; sadness scale: ICC median = .86; range = .84 – .89).
Procedure
Each participant was instructed to sit approximately 50 cm in front of the monitor. Each trial consisted of the following sequence: (a) A fixation cross was displayed in the center of the screen for 500ms; (b) a face pair consisting of the neutral and emotional versions (either happy or sad) of the same face was displayed in the right and left positions on the screen for 1,000ms, the two pictures were approximately 13cm apart; (c) the two faces disappeared from the screen, and a small gray dot appeared in the center of the location where one of the faces had been(either on the left or right side of the screen). The dot remained until the participant pressed the response key which indicated the position of the dot. The accuracy and the latency (reaction time) of each response were recorded by the computer.
Participants had to identify the location of the dot as soon as possible by pressing the left red key (the “4” key marked with a red sticker) on the independent number keypad if the dot appeared on the left, and pressing the right blue key (the “6” key marked with a blue sticker) if the dot appeared on the right. Participants used the index finger of their dominant hand to give response. They had to place their index fingers on the center black key (i.e. “5” key) before the experiment began and after each trial.
There were 12 practice trials (with neutral-neutral face pairs) and 80 test trials. For the test trials, 20 face pairs, equally divided among happy-neutral and sad-neutral, were seen by the participants. Each of the 20 face pairs was repeatedly presented four times in order to fully counterbalance the permutations of location of the emotional face, location of the dot, and face-dot combinations, i.e. the dot replacing the emotional or neutral face. (Figure 1)
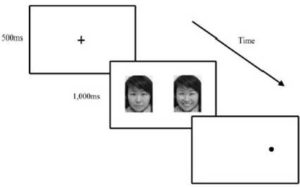
Figure 1. The Display in the Modified Dot-Probe Task. After a Fixation Cross, Two Faces Appeared Simultaneously Side by Side, One Emotional Face (Here on the Left) and One Neutral Face (Right). Then a Dot Replaced one of the Faces and Participants were Asked to Respond on the Basis of Location of the Dot (i.e. Left or Right)
Results
Initial processing of the response latency data. Prior to conducting the main attentional bias analyses, several standard procedures were followed to remove unusual and/or outlying response latency data among the participants. In line with previous research(Bradley, Mog, & Lee, 1997), trials were removedif the participants did not correctly identify the location of the dot-probe, or if their response latencies were extremely short (less than 200ms) or extremely long (more than 2000ms)(Glinder, Beckjord, Kaiser, & Compas, 2007). To minimize the influence of outliers within subject, response latencies that were more than two standard deviations above each subject’s mean were discarded(Bradley, et al., 1997). Four subjects were excluded as a result. The final sample had 52 subjects.
Attentional bias and the symptoms of PTSD, anxiety, and depression. Attentional bias scores were computed separately for positive and negative faces for each participant. Positive values on this measure thus indicate a bias to attend to emotional faces, and negative values indicate a bias to attend to neutral faces. Means and SDs for the attention bias, CIESR, and CHADS scores are presented in Table 1. Ten (19.23%) scored 33 or higher in CIESR. Eleven (21.15%) and seven (13.46%) scored 8 or higher in the anxiety and the depression subscales of CHADS respectively.
Table 1. Means and Standard Deviations of the Measures by Family Income and Religion
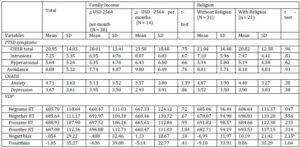
Note. CIESR total = Total score of Chinese Impact of Event Scale – Revised; Intrusion = Intrusion Subscale of Chinese Impact of Event Scale – Revised; Hyperarousal = Hyperarousal Subscale of Chinese Impact of Event Scale – Revised; Avoidance= Avoidance Subscale of Chinese Impact of Event Scale – Revised; CHADS = Chinese Hospital Anxiety and Depression Scale; VDP = Modified Dot-Probe Task; Negsame RT = Latency (reaction times taken) for detecting the dot when the dot is located at the same side as the negative face in negative-neutral face pair trials; Negother RT = Latency for detecting the dot when the dot is at the same side as the neutral face in negative-neutral face pair trials; Possame RT = Latency (reaction times taken) for detecting the dot when the dot is located at the same side as the positive face in positive-neutral face pair trials; Posother RT = Latency for detecting the dot when the dot is at the same side as the neutral face in positive neutral face pair trials; Negatt bias = Negative attentional bias; Posatt bias = Positive attentional bias.
*p < 0.05
Negative attentional bias was negatively correlated with the CIES-R total score (r = .30, p < .05), the hyperarousal subscale (r = .32, p < .05), and the intrusions subscale (r = .30, p < .05) but not the avoidance subscale (r = .21, p = .14). Positive attentional bias was not correlated with the CIES-R total score (r = .10, p = .50) or any of its subscales (hyperarousal: r = .04, p = .76; intrusions: r = .11, p = .44; avoidance: r = .12, p = .42).
Negative attentional bias was positively correlated with the anxiety subscale of CHADS (r = .30, p < .05) but not the depression subscale (r = .21, p = .13). Positive attentional bias was not correlated with the anxiety (r = -.11, p = .44) or the depression (r = -.04, p = 81) subscales of CHADS.
Discussion
The primary objective of the present study was to use experimental measures of cognitive biases to investigate the relationship of response-based attentional bias to negative stimuli and positive stimuli with psychopathology in women with breast cancer. Results of the dot-probe task showed breast cancer patients with greater negative attentional bias tended to report more symptoms of PTSD. This finding was consistent with the results of a previous study, in which self-reports of attentional bias towards negative information was associated with psychopathology(Chan, et al., 2011). They were in conjunction with the concept that attentional bias plays a central role in most cognitive theories of anxiety disorders. The cognitive models suggest that information-processing biases cause, maintain, and exacerbate anxiety psychopathology because anxious individuals fail to attend to information that signifies safety(Mathews & MacLeod, 2002). Rather, these anxious individuals have a tendency to give greater ‘cognitive weight’ or processing priority to threat-related information(Cavanagh & Davey, 2001). Our results suggested that developing strategies to reduce negative attentional bias among women with breast cancer might have potential benefits on psychological adjustment. Specifically, these findings may contribute to treatment development by modifying existing cognitive behavioral therapy (CBT) techniques (Dalgleish & Watts, 1990) and employing attention training strategies that target to exert control on internal and external cues attended(Mobini & Grant, 2007). However, the current study is cross-sectional and the generalizability of the current findings to men and patients with other types of cancers is unknown. Future studies may examine the predictive values of the dot-probe task on treatment outcomes and the risk for developing the symptoms of post-traumatic stress disorder.
(adsbygoogle = window.adsbygoogle || []).push({});
References
Bjelland, I., Dahl, A. A., Haug, T. T. & Neckelmann, D. (2002). “The Validity of Hospital Anxiety and Depression Scale: An Updated Literature Review,” Journal of Psychosomatic Research, 52, 69-77.
Publisher – Google Scholar – British Library Direct
Bradley, B. P., Mog, K. & Lee, S. C. (1997). “Attentional Biases for Negative Information in Induced and Naturally Occurring Dysphoria,” Behaviour Research and Therapy, 35(10), 911-927.
Publisher – Google Scholar – British Library Direct
Breton, J.- J., Bergeron, L., Valla, J.- P., Berthiaume, C. & St-Georges, M. (1998). “Diagnostic Interview Schedule for Children (DISC-2.25) in Quebec: Reliability Findings in Light of the MECA Study,” Journal of the American Academy of Child & Adolescent Psychiatry, 37(11), 1167-1174.
Publisher – Google Scholar – British Library Direct
Cavanagh, K. & Davey, G. C. (2001). “The Use of Stimulus Dimensions in Judgment Making in Spider Fearful and Nonfearful Individuals,” Behaviour Research and Therapy, 39, 1199-1211.
Publisher – Google Scholar – British Library Direct
Chan, M. W. C., Ho, S. M. Y., Tedeschi, R. G. & Leung, C. W. L. (2011). “The Valence of Attentional Bias and Cancer-Related Rumination in Posttraumatic Stress and Posttraumatic Growth among Women with Breast Cancer,” Psycho-Oncology, 20, 544-552.
Publisher – Google Scholar
Creamer, M., Bell, R. & Failla, S. (2003). “Psychometric Properties of the Impact of Event Scale-Revised,” Behavior Research and Therapy, 41, 1489-1496.
Publisher – Google Scholar
Dalgleish, T. & Watts, F. N. (1990). “Biases of Attention and Memory in Disorders of Anxiety and Depression,” Clinical Psychology Review, 10, 589-604.
Publisher – Google Scholar
Glinder, J. G., Beckjord, E., Kaiser, C. R. & Compas, B. E. (2007). “Psychological Adjustment to Breast Cancer: Automatic and Controlled Responses to Stress,” Psychology and Health, 22(3), 337-359.
Publisher – Google Scholar – British Library Direct
Gotlib, I. H., Krasnoperva, E., Yue, D. N. & Joormann, J. (2004). “Attentional Biases for Negative Interpersonal Stimuli in Clinical Depression,” Journal of Abnormal Psychology, 113, 127-135.
Publisher – Google Scholar – British Library Direct
Jansen, A., Nederkoorn, C. & Mulkens, S. (2005). “Selective Visual Attention for Ugly and Beautiful Body Parts in Eating Disorders,” Behaviour Research and Therapy, 443, 183-196.
Publisher – Google Scholar
Leung, C. M., Ho, S., Kan, C. S., Hung, C. H. & Chen, C. N. (1993). “Evaluation of the Chinese Version of the Hospital Anxiety and Depression Scale,” International Journal of Psychosomatics, 2, 90-112.
Publisher – Google Scholar – British Library Direct
MacLeod, C., Mathews, A. & Tata, P. (1986). “Attentional Bias in Emotional Disorders,” Journal of Abnormal Psychology, 95(1), 15-20.
Publisher – Google Scholar
Mathews, A. & MacLeod, C. (2002). “Induced Processing Biases Have Causal Effects on Anxiety,” Cognition and Emotion, 16(3), 331-354.
Publisher – Google Scholar – British Library Direct
Mobini, S. & Grant, A. (2007). “Clinical Implications of Attentional Bias in Anxiety Disorders: An Integrative Literature Review,” Psychotherapy: Theory, Research, Practice, Training, 44(4), 450-462.
Publisher – Google Scholar – British Library Direct
Neuro Behavioral Systems. (2012). “Presentation,” Retrieved 13 July 2012 http://www.neurobs.com/
Publisher
Shrout, P. E. & Fleiss, J. L. (1979). “Intraclass Correlations: Uses in Assessing Rater Reliability,” Psychological Bulletin, 86(2), 420-428.
Publisher – Google Scholar
Wu, K. K. & Chan, K. S. (2003). “The Development of the Chinese Version of Impact of Event Scale–Revised (CIES-R),” Social Psychiatry and Psychiatric Epidemiology, 38, 94-98.
Publisher – Google Scholar – British Library Direct
Zigmond, A. S. & Snaith, R. P. (1983). “The Hospital Anxiety and Depression Scale,” Acta Psychiatrica Scandinavica, 67, 361-370.
Publisher – Google Scholar