Introduction
Livestock farming emissions such as dust, odorous gases, microorganisms and heavy metals are detrimental to both humans and animals (Van Wicklen and Yoder, 1988). As a result, modern pig‐housing facilities should be based on proper waste‐cleaning strategies particularly, in confined spaces (Lavoie et al., 1995). Presently, the distribution characteristics of these dust on a periodic monitoring basis inside livestock house is scarce. There are various ways to improve animal performance by modifying the environment inside livestock confinement housing. One of these strategies is the wet pad forced ventilation system (WPFV) as confirmed recently by Chiang and Hsia (2005). However, this system is more focused on providing cooler environment inside the house rather than assuring maximum collection of dust. Investigations then on the combined use of WPFV and cyclone dedusters in poultry and livestock buildings would be valuable for both animal husbandman and environmentalist. Dust in livestock buildings is almost entirely organic and originates from feed, skin, feathers, bedding and dried faeces (Harry, 1978). Several airborne contaminants in livestock houses are known to be detrimental to humans and animal productivity. While air quality is commonly related to ambient temperature and relative humidity, it is also a function of the concentration of gases and airborne particulate matter. Aerosol particles, with a diameter between 0.5 to 5㎛, are known as respirable aerosol particles. Respirable dust can reach the lower respiratory system, which can be harmful as they transport odor, pathogens, diseases, and irritate the respiratory system (Van Wicklen and Yoder, 1988). High concentration of respirable dust in pig house may also create environmental and health problems for both the animal (De Boer and Morrison, 1988) and for the worker (Donham et al. 1989). In this study, dust characteristics and collection efficiency of the cyclone deduster were periodically monitored in a building for 3 ‐ wk old weanlings during spring time. While there is still a limited knowledge among raisers on the hazards brought about by dust concentrations inside livestock barns, the valuable data generated in this study will serve as a basis for modifying housing structure, feeding management and ventilating systems without compromising animal performance. Finally, this study compared the dust, bioaresol and gas characteristics dynamics inside a pig barn with or without cyclone deduster (CD).”
Materials and Methods
Dust Particle Analysis
The collected dust particles were analyzed for chemical composition following the procedures prescribed by AOAC 1990. The feed dust however, was not analyzed for heavy metals. The heavy metals investigated were classified as inert minerals such as Ca, P, K, Na, Mg, Fe, Mn, Zn, Cu, F and toxic metalloids such as Pb. Cd, As and Hg. The total suspended particulate (TSP), particulate matter < 10 μm (PM10), and particulate matter (PM2.5) < 2.5 μm were measured using Fh62 –2 dust detector (ESM Eberline Co. Germany) at 30‐minute interval. Other sizes of dust particles were monitored using Master Sizer Microplus Ver 2.18 (Malvern Instruments Co. UK).
Housing and Management
The experiment was conducted in a weaner house of a private farm in central Korea. Six enclosed pig rooms were used. Three rooms were installed with CD mounted on the center at a height of 2.0 m, while the remaining rooms were used as the control in the experiment. All rooms were ventilated under negative pressure by a variable speed fan installed under slat for pit ventilation. Each room (L x W x H = 8.4m x 9.8m x 2.4m) with a concrete slatted floor was further subdivided into 8 pens with 40 heads of 18 day‐old weaners (Landrace x Yorkshire X Duroc) weighing 5.4 kg. The total of weaners in the entire swine confinement house was 320. All weaners were fed a 22.1% crude protein, corn‐soybean meal based diet according to NRC, 1998 nutrient requirement recommendation and dry fed by automatic feeder with bite‐type nipple drinker.
Dust Collector Installation
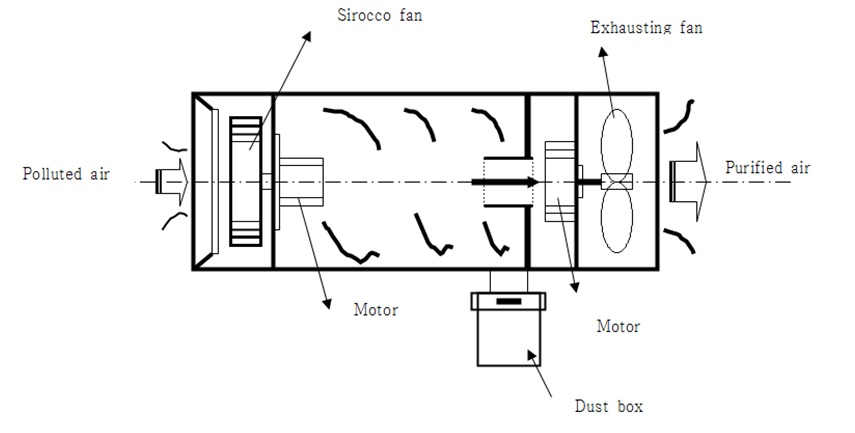
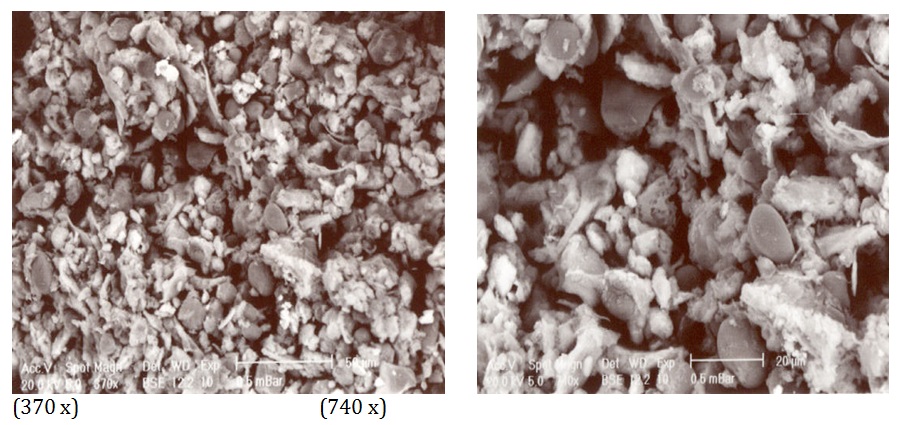
The dust collector (Fig 1) used was a cyclone‐type (Dyne Engineering, Daejeon, Korea) classification powered by a 205 watt/hr capacity with a flow rate of 1, 200 m3/hr. The CD used in this study has the unique feature of being equipped with a booster sucking block found before the motor driven exhaust fan that allowed the effective release of purified air. Prior to the expulsion of the filtered air, it was recirculated through a cyclonic flow. The diameter of the CD is 290 mm and a length of 1,000 mm. A motor driven sirocco fan that is capable of recirculating polluted air in a cyclonic flow is located behind the inlet air passage. The dust collection box found at the bottom of the air outlet passage has a volume of 1.9 liter and was utilized to quantify the weekly dust collection for 5 wks. In Fig 2, scanning electron micrographs at 370 x and 740 x magnifications of dust particles were collected from cyclone deduster in a swine growing building for subsequent chemical analysis.
Measurement of Bacterial Colony Forming Unit Particle
To determine the number of suspended bacterial particles in the air, a nutrient agar concoction (Biolife, Italy) was prepared. The powder was mixed with distilled water, and continuous stirring was done to prevent sedimentation at the bottom. After cooling, it was then dispense to the petri disc and placed for one minute at 3 different sites in the pig house. After incubating the agar at 37 0C for 24 h, a manual reading was done for bacterial colony forming unit particle.
Measurement of NH3 and CO2
The NH3 and CO2 levels were measured by the user‐friendly and quick detector or reaction tube method. The detector tube for NH3 was No. 3 L (0.5 to 78 ppm, GASTEC, Model GV ‐100, Japan; while that of CO2 was No. 2LL (300 to 5000 ppm). To trap the gases, two different calibrated detector tubes containing inert support granules were mounted on the tip of the suction gun. The collection of the gases was done in 3 different sites of the house at pig nose height level. Around 100 ml of gas was collected after pulling the suction gun’s plunger. Finally, direct reading on the colorimetric detector tubes of NH3 level was done according to color intensity change from pink to yellow, while that of CO2 was white to purple.
Results
Effect of CD on Dust Distribution
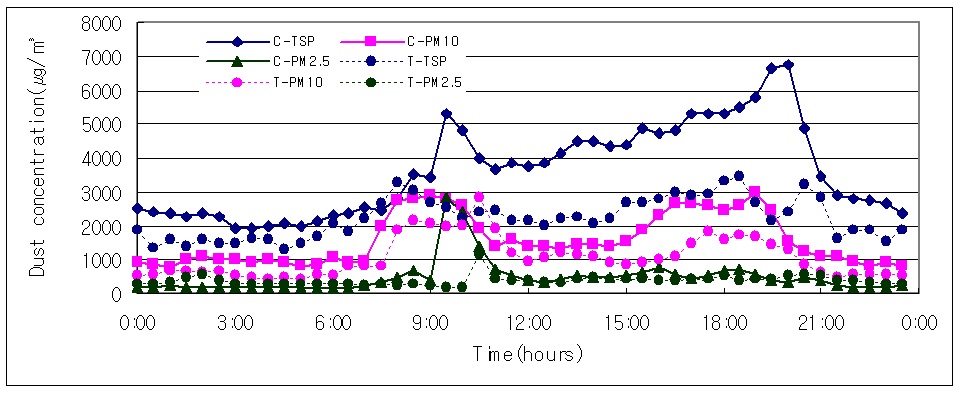
Hourly variations in dust density in the weaner building are shown in Fig. 3. These measurements revealed that dust concentration varied greatly in time. There were two peaks of high dust concentration, during the morning and afternoon.
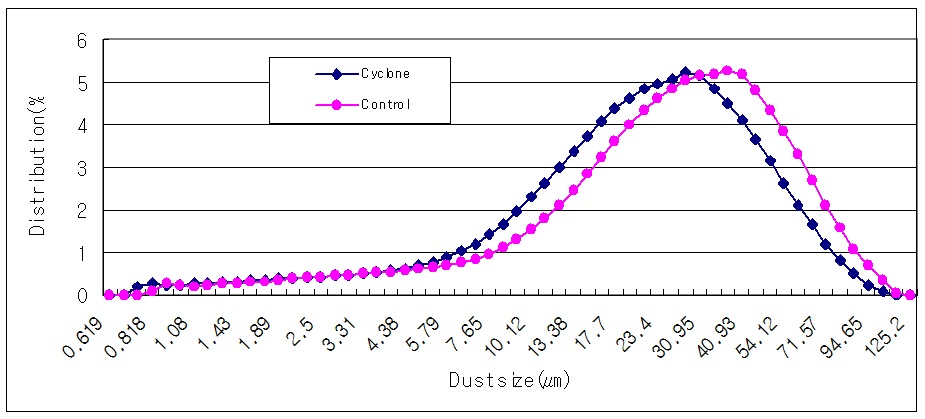
Effect of CD on Dust Particle Size Distribution
The dust distribution size related to size is shown in Fig.4. The particle size of dust ranged from 0.745 to 1.08 ㎛. . Particle sizes ranging from 0.745 to 1.08 ㎛, which are alarmingly considered as respirable dust, were effectively reduced to 53.5 % as compared to the control which is 55.27 %.
Influence of CD on NH3, CO2 and Bacterial Count
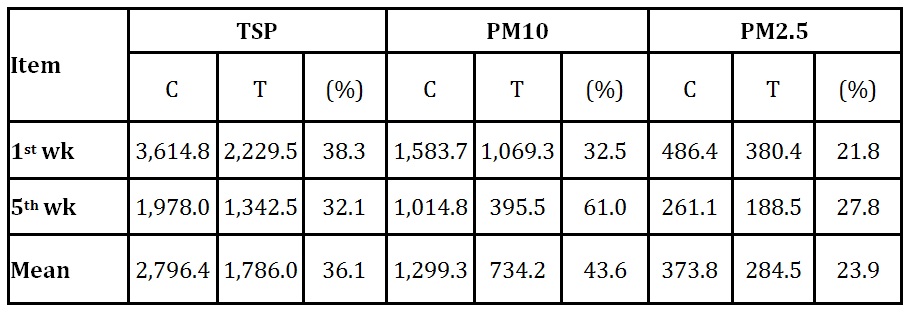
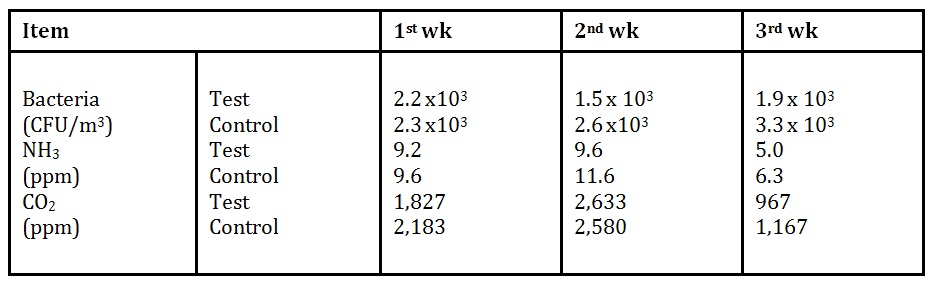
In Table 4, during a 3-wk monitoring period, the level of NH3 at wk 3 was reduced from 6.3 ppm to 5.0 ppm, when the CD was installed in the weaner house. Although the level of NH3 for both the test and control rooms are below the limit, the measurement of NH3 was done in younger pigs, hence a higher concentration can be expected in older animals. In our result, the microbial count was much lower for both the test and control houses. The test house, however, has a substantially lower bacterial count throughout the 3‐week monitoring period (1.5 to 2.2 x 10³ CFU/m3), indicating the effectiveness also of the CD in flushing out these microbes.
Comparative Contaminants of Dust and Feed
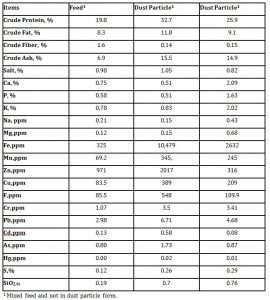
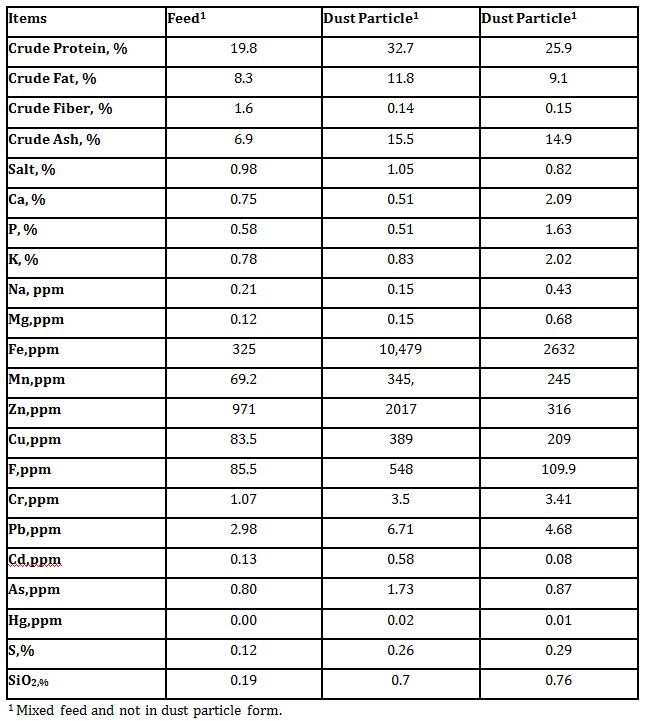
As shown in Table 5, the crude protein of feed was 19.8%, while that of dust was 25.9-32.7%. An analysis on the heavy metal contamination of the two dust particles showed that Pb had the highest concentration at 5,695 ppm followed by Cr, AS Cd and Hg at 3,455, 1.3, 0.33 and 0.015 ppm, respectively.
Discussion
Effect of CD on Dust Distribution
These measurements revealed that dust concentration varied greatly in time. Dust concentration tends to be higher during the daytime because of the pig’s increasing activity towards this period. The peak level of TSP concentration in control pig room was 5,322㎍/㎥ (09:00~10:00) and 6,763㎍/㎥ (19:00 to 20:00). However, the CD decreased it to 3,299㎍/㎥ (08:00) and 3,473㎍/㎥ (18:30). During the 1st wk, the average dust concentration classified as TSP, PM 10, and PM 2.5 in the control pig room were 3,614㎍/㎥, 1,584㎍/㎥ and 486㎍/㎥, respectively. With the CD, this was substantially reduced to 2,230㎍/㎥, 1,069㎍/㎥, and 380㎍/㎥, respectively. The suction reduction rate which ranged from 21 to 38 % was considered exceptional. These measured dust densities are very important because Donham et al. (1989) claimed the presence of respiratory ailments among pig workers exposed to a dust density of 3,800 ㎍/㎥. Conversely, in broilers, as observed in a previous study, dust concentration was evident throughout the day because of their constant feeding and movement. The suction reduction rate of the CD was very relevant as the resulting dust density for the respirable dust (PM10) at 1,069㎍/㎥in the building was lower than the exposure limit to animals (24 h, continuous) which is 1700 ㎍/㎥ as specified by CIGR, 1992. During winter, the daily average of the total dust concentration in the buildings of growing‐finishing house varied between 1300 to 6300 ㎍/㎥ (Gustafsson, 1997). He also investigated the mass balance of dust in houses for pigs and chickens and proved that the generation of dust was related to the number and weigh of the animals. Based on the above values for dust density, it clearly shows that the lesser dust concentration was obtained because younger pigs were used. Moreover, the restricted and dry feeding system adapted by the pigs was a contributory factor in the reduced level and this corroborated with the findings of Robertson (1999). The average dust density of building after dedusting was 1226.33 ㎍/㎥ and this did not have a large difference to that obtained by Takai et al. (1986), which was 1,800 ㎍/㎥ in dry fed pigs. On the other hand, Wathes et al. (2002) found out that pigs exposed to dust concentration of 5100 ㎍/㎥ to 9900 ㎍/㎥ had depressed growth rate. Similarly, Donham (1991) stated an increase in mortality and reduced gain among piglets exposed to dust concentration higher than 5200 ㎍/㎥ while in fatteners levels above 3,700 ㎍/㎥ resulted to elevated mortality and prevalence of pneumonia. However, air quality because of dust levels can deteriorates with bigger and more animals inside a building. (Cargill et al., 1996, Gustafsson, 1999). Therefore, the dust density data in the present study for weaner pigs can be a basis for formulating simulated models on the relationship of dust characteristics to animal performance at varying stages of growth. With this development, measures to reduce the contamination of air in swine houses are urgent to livestock raisers.
Effect of CD on Dust Particle Size Distribution
The data in Fig. 4 demonstrated the effectiveness of CD in reducing the dust distribution relative to size in the weaner house. Apparently, the result in this study varied greatly when it was compared to the investigation of Van Wicklen and Yoder (1988) who reported 64.5% for 0.3 to 0.5㎛ while Nicks et al (1993) claimed that 82% of the aerial particles were in the size range 0.3 to 0.5㎛. As dust particle sizes increase, suction ability of the deduster also became more effective. This was demonstrated in the present study when the aerial dust particle size ranging from 1.19 ㎛ to 2.5 ㎛ had a distribution rate of only 23.14 % as compared to 47.92 % to the control. Likewise, there was an abrupt drop in the dust distribution rate beyond 1.19 ㎛ for both the control and test room with the latter being more pronounced. There was no dust recovery anymore in the test room for particle size > 44.92㎛, whilst in the control room, dust particles up to 49.31㎛ were still detected. This indirectly justified the removal efficiency of the CD for very minute particle size of dust. Apparently, the accessory block located just before the exhaust fan of the deduster contributed to this extra suction effort. Moreover, Nicks et al. (1993) reported a 5㎛, the present study recorded almost the same value at < 1 % (Fig. 5), which could indicate the reliability of the cyclone model deduster used in this study. Therefore, the above dust particle dynamics of this study confirmed that the cyclone dust collector was able to trap most of the bigger dust particles in the pig room.
Dusts in livestock buildings are complex substances, not only made up of several constituents, but also particles of a wide size range, typically from less than 1 ㎛ to visible particles up to 100 ㎛. The particles are often irregular in shape; many of them may be generally classified as flakes, fibres and spheres of cubes. In the present investigation, the consistency of CD was proven when the cumulative distribution rate of aerial dust particles ranging from 30 to 40㎛ that were left in the control room was 20.1 % and more concentrated than the test room having only 16.27 %. The study also observed that the aerial dust having a diameter of 1.19 to 2.5 ㎛ was less concentrated in the test room as compared to the control. Airborne bacteria that can cause respiratory diseases usually attached themselves to dust with > 20 ㎛. Moreover, correlation of total dust and total airborne bacteria, total dust and ammonia, and total dust and odor were shown statistically significant by Choi et al. (2005). Therefore, there is an added advantage for the use of CD especially at prolonged period.
The summary of the particle size distribution of both the control and test rooms is presented in Table 1. It can also be an indirect measure of the suction efficiency of the deduster. It is interesting to note that the two rooms followed a uniform ratio of approximately 60:30:10 distribution rate. This indicated reliability on the suction efficiency of the CD.
The removal efficiency of the CD, as shown in Table 2, apparently indicated that the PM10 was the most preferred particle to be sucked by the CD. This is because there was more TSP concentration during the same period than the PM10. Further, it seemed that this is attributed to “volume – mass – air pressure interaction” and this has to be verified in subsequent studies. This claim is valid because in Table 1 of this study, the PM 10 in the test room had the lowest distribution rate over the control indicating better suction effect was done. This finding is relevant as PM10 is a respirable dust.
There was no definite trend in the moisture content and weight of dust collected in the dust collector relative to collection period as demonstrated in Table 3. Other factors that resulted to this observation are therefore to be investigated. This data provides valuable information to predict concentration of dust pollutants through simulation models given varying conditions in terms of management, pig density, types of building and others.
Influence of CD on NH3, CO2 and Bacterial Count
The emission of NH3 from agriculture and livestock farming as claimed by Kim et. al. (2004) has not been estimated in Korea, but could be equal or surpass that of Europe. Awareness then on the inventory of NH3 should be done so that a nationwide estimate can be done in the future at least for livestock houses. In the present study, the CD was able to effectively reduced NH3 inside the house and therefore the rate of decrease that was quantified can serve as a basis for estimating the gas should there be a wide scale use of dedusters in the future. Moreover, NH3 is an irritant to the respiratory tract; therefore its concentration has to be monitored in livestock house. Murphy and Gargill (2004) reported an NH3 concentration of 3 to 20 ppm in pig farms.
For pigs exposed to 50, 100 and 150 ppm NH3 for 4 wks, growth rates were reduced by 12, 30, and 29 %, respectively (Drummond et al. 1980). Moreover, pigs exposed for short period of NH3 above 35 ppm can result to inflammatory changes in the wall of the respiratory tract. Although the NH3 level for both the test and control rooms is below the 35 ppm level, this is attributed to the fact that younger pigs has been used in this study, therefore the use of CD should not be ignored. Likewise, there was a 9 % reduction in the 3-wk average value of CO2 in the test room. At a CO2 concentration of 967 ppm in the test room on the 3rd wk, this was already lower than 1500 ppm which was claimed by Donham et al. (1989) to be the level associated in the reduction of growth rate and increased prevalence of respiratory diseases in pigs. Accordingly, recommended levels for CO2 vary and a good target is usually less than 1500 ppm with 3000 ppm being the absolute maximum (Pointo et al., 1989).CIGR (1992) on the other hand suggested that the maximum allowed CO2 concentration for animals is 3000 ppm while for workers is 5000 ppm.
Donham et al. (1989), in Sweden, have reported the average concentrations of bacteria at 1.4 x 10⁶ CFU/m3 and Crook et al. (1991) in their survey of six pig-housing facilities in the United Kingdom, observed concentrations of total bacteria of 3-80 x 105, 2-60 x 105, 2-20 x 103 CFU/m3, and 1.4 x 10⁶ CFU/m3 in samples incubated at 25° 37, and 55°C. Donham (1995) recommended a level for viable airborne bacteria in pig CFU/m3 to be 1.0 x 10⁵. Moreover, Donham (1986) reported an average total bacteria concentration of 3 x 10⁶ CFU/m3 and a statistically significant association between exposures to concentrations of at least 1.4 x 10⁶ CFU/m3. Clark et al. (1983) reported that the concentration of airborne endotoxin found in swine units is 0.12 ㎍/m3. Other workers found out that a high concentration of gram negative bacteria in swine confinement buildings (4.7 x 10² to 0.9 x 10³) resulted to acute and chronic respiratory symptoms and ventilatory capacity reductions in swine farmers (Zuskin et al.. 1992a,b). In our study, the level of bacteria of the test room was more than the above range, therefore more dedusters with higher suction efficiency per room should be considered in swine buildings
Airborne bacteria which are usually 1 to 2 ㎛ can cling to inert host dust particles with 10-20 ㎛ in diameter (Dyment, 1976). On the other hand, Curtis et al. (1975) detected a concentration of around 28 to 31 % of the microbial population to be bacteria colony forming particle with diameter < 4.7 ㎛. Because of the accuracy of dedusters to measure airborne bacteria, microbiologist can work with livestock men and investigate whether the increase in size of bacteria was made possible inside a confined livestock environment and further determine its pathogenecity. In this way, adjustment on biosecurity measures and health protocols will be considered by the livestock farmers. This can be a subject for our future investigation as we did not take into account the particle size distribution of the bacteria.
Comparative Contaminants of Dust and Feed
The relatively high protein level suggests that the main source of dust was from the livestock, specifically materials from the skin and feathers. Crude fat of dust also was higher compared with that in the feed. This indicated that dust is basically of animal origin and confirmed the findings of other workers wherein they found out that dust from livestock buildings showed to be largely of organic sources like feed, skin, feathers, bedding, and feces and has not been changed as indicated in the review covering 3 decades (Grub et al, 1965; Bundy, 1984). Likewise, Nilsson and Gustafsson (1987) also claimed that pig house dust contained 87% dry matter, 24% crude protein and 4% fat. The average of 2 dust particles recorded a higher Ca, P, K concentration than the feeds. The CD, therefore has to significantly reduce these inert minerals as the threshold limit value (TLV) for total mineral dust for humans is 100 ㎍/㎥ (Carpenter, 1986), while the US EPA, 1999 recommended a limit for TSP to 150 ㎍/㎥. The size of the inert mineral dust detected in this study can fit well under TSP category. Subsequent studies should therefore investigate the removal efficiency of CD for these specified classifications of minerals. It is expected that these contaminants are evident in most livestock houses since Ko et al. (2004) detected these metals in swine manure at higher levels. The heavy metals were Cr, As, Cd, Cu, Zn and P with zinc having the highest concentration at 425.77 ppm and cadmium the lowest at 1.51 ppm.
Implications
The study proved the importance of CD, particularly this new model that was capable for sensitive detections. It was able to relate how dust can bring adverse effects to both the stockman and animals. The CD reduced the number and density of dust particles as well as bacterial and gaseous contaminants in the pig house. The unique feature of the cyclone deduster used in this study is the presence of a block that improved its suction efficiency and was well elucidated by the detailed and exhaustive detection monitoring of the particulate matter distribution. While ventilation systems can control the concentration of microorganisms, gram negative bacteria were still above recommended limit. In this study, the cyclone deduster was able to detect microbial load below the tolerable level. Since this was done to weaning pigs during spring time, it is postulated however, that detection can vary under different growth cycles, seasons and management systems. Therefore, data generated in this investigation can be utilized as a basis for simulation models and regression correlation analysis for future workers. Finally, this will also provide technical input on further improvement on design and suction efficiency of cyclone dedusters should there be linear increase in indoor area of building and concentration of dust relative to varying piggery management conditions and climatic patterns.
References
- 1990. Official Methods of Analysis. Association of Official Analytical Chemists. (15th ed). Washington, D.C.
- Bahanzi, T. and C. Cargill. 1997. The distribution of airborne particles in pig sheds. In: Manipulating Pig Production VI. Cranwel, P.D ed. Austrasian Pig Science Association, Werribee, Australia, p.295.
- Bundy, D. S. 1984. Rate of dust decay as affected by relative humidity, ionization and air movement. Transactions of the ASAE. 27:865-
- Cargill, C., S.Z. Skirrow, and T. Banhanzi. 1996, The relationship between pig population size, stocking density, air quality parameters and pleurisy in pig herds. In: Proceedings 14th International Pig Veterinary Society Congress. Bologna, Italy. P. 521.
- Carpenter, G. A. 1986. Dust in livestick buildings : Review of some aspects. J. Agric. Engng. Res. 33:227-
- Clark, S., R. Rylander and L. Larsson. 1983. Airborne bacteria, endotoxin and fungi in dust in poultry and swine confinement buildings. Am. Ind. Hyg. Assoc. J. 44, 537-
- Commission Internationale du Genie Rural .CIGR.1992. Climatisation of Animal Houses. 2nd (Edn) Commission Internationale du Genie Rurale, Faculty of Agricultural Sciences, State University of Ghent, Ghent, Belgium.
- Crook, B., J.F. Robertson, S.A. Travers Glass, E.M. Botheroyd, J. Lacey and M.D Topping. 1991. Airborne dust, ammonia, microorganisms, and antigens in pig confinement houses and the respiratory health of exposed farm workers. Amer. Industr. Hyg. 52: 271-27
- De Boer, S. and W. D Morrison. 1988. The effects of the quality of the environment in livestock buildings on the productivity of swine and the safety of humans. University of Guelph Report.
- Donham K.J. 1995. The effects of environmental conditions inside pig housing on works and pig health. In: Manipulating Pig Production V. Hennessy , D.D., Cranwell, P.D. eds. Australian Pig Sciences Association. Weeribee, Australia. pp. 203-
- Donham, K. J., P. Haglind, Y. Peterson, T. Rylander and L. Belin. 1989. Environmental and health studies of workers in Swedish swine confinement buildings. British Journal of Industrial Medicine 40: 31-
- Donham, K J. 1991. Association of environmental air contaminants with disease and productivity in swine. American J. of Vet. Res.. 52: 1723 –1729.
- Drummond, J.G., S.E. Curtis, J. Simon and H.W Norton,. 1980. Effects of aerial ammonia on growth and health of young pigs. J. Anim. Sci. 50:(6) 1085-
- S.H. and L.C. Hsia. 2005. The effect of wet pad and forced ventilation house on the reproductive performance of boar. Asian-Aust. J. Anim. Sci. 18:96-101.
- Dyment, J. 1976. Air filtration. In Control of the Animal House Environment (McSheehy, T.M. Ed.). London: Laboratory Animals Ltd. pp. 209-
- Grub, W., C. A. Rollo,. and J. R. Howes. 1965. Dust problems in poultry environments. Transactions of the ASAE. 8: 338-
- Gustafsson G. 1994. Efficiency of different dust reducing methods in pig houses. Proceedings of the 12th CIGR Conference, 5-8 September, 1994. Milano CIGR, Merbeke, Belgium, pp. 15-
- Gustafsson G. 1997. Investigation factors affecting air pollutants in animal houses. Ann Agric. Environ. Med. 4: 203-215
- Gustafsson G. 1999. Factors affecting the release and Concentration of Dust in Pig Houses. J. Agric. Engng Res. 74: 379-
- Harry, E. G. 1978. Air pollution in farm buildings and methods of control: a review. Avian Pathology 7: 441-
- Kim, K.Y., H.L. Choi and C.N. Kim. 2004. Comparison of analysis methods for ammonia from swine production facilities. Asian- J. Anim. Sci. 17: 1608-1614.
- Ko, H.J., H.L.Choi, H.S. Park and H.W. Lee. 2004. Prediction of heavy metal content in compost using near-infra-red reflectance spectroscopy. Asian- J. Anim. Sci. 17: 1736-1740.
- Lavoie, J., G. Marchand, J.Y. Drolet and G. Gingrase. 1995. Biological and chemical contamination of the air in grower‐finisher pig building using deep-litter systems. Can. Agric. Eng. 37: 195-
- Murphy T. and C. Cargill. 2004. The effects of indoor air pollutants on the health and production of growing pigs. Pig News and Information. 25: 35‐
- National Research Council. 1998. Nutrient Requirements of Swine. (10th ed). National Academy Press, Washington D.C., USA.
- Nilsson, C. and G. Gustafsson. 1987. Dust in fattening pig buildings. Special Report No. 149. Swedish University of Agricultural Sciences.
- Nicks, B., Marlier, D. and B. Canart. 1993. Air pollution levels in pig houses. Proceedings of ASAE fourth International Symposium. p.635-
- Pointon, A. M., C.F. Cargill and J. Slade. 1995.. Air Quality in the Good Health Manual for Pigs. Canberra, Australia, Pig Research and Development Corporation.Australia Pork Ltd. p.140.
- Robertson, J.F., D. Wilson. and W.J. Smith. 1990.Atrophic rhinitis: the influence of the aerial environment. Animal Production. 50: 173‐
- Takai H, E. Larsen and S.Pedersen. 1986. Stov og stovmaling i svinestalde [Dust and dust measurements in pig houses]. Statens Jordbrugstekniske Forsog, Horsens, Denmark.
- Takai, H., Moller, F., Iverson, M., Jorsal, S. E. and V. BilleHansen. 1993. Dust control in swine buildings by spraying of rapeseed oil. Proceedings of International Livestock Environment Symposium , Warwick, England, 6- July 1993. ASAE. 889-
- Wathes, C.M., Demmers, T.G.M., N. Teer, , R.P. White , L.L. Taylor, V. Bland , P. Jones, D. Armstrong, A.Greshan, D.J. Chennels and S. Done. 2002. Production responses of weaner pigs after chronic exposure to airborne dust ammonia. In: 2002 ASAE Annual International Meeting/CIGR. Xv th World Congress, Chicago, Illinois, USA.
- Van Wicklen, G. L.and M. F. Yoder. 1988. Respirable particle concentrations in naturally-ventilated broiler housing. Transactions of the ASAE. 3: 1794-
- Zuskin, E., Zagar, Z., E.N. Schachter., J. Mustajbegovic, and J. Kern. 1992a. Respiratory symptoms and ventilatory capacity in swine confinement workers. Br. J. Ind. Med. 49: 435-440.
- Zuskin, E., Zagar, Z., E.N. Schachter., J. Mustajbegovic, S. Goswami, S. Maayani, Z. Marom, and N. Rienzi. 1992b. Immunological and respiratory changes in animal food processing workers. Am. J. Indi. Med. 21: 171-179.
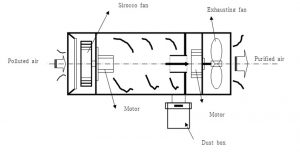
Fig. 1.Schematic of the cyclone‐type deduster

Fig 2. Scanning electron micrographs of dust particles collected from cyclone deduster in swine growing building
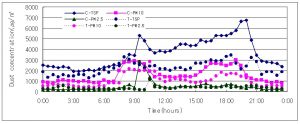
Fig. 3. Comparative dust concentration in building for weaned pigs at 3 wks of age
TSP ‐Total Suspended Particulates without CD.
TSP ‐ Total Suspended Particulates with CD
PM10‐ Particulate Matters < 10㎛ without CD
PM10 ‐ Particulate Matters < 10㎛ with CD
PM2.5‐ Particulate Matters < 2.5㎛ without CD.
PM2.5 ‐Particulate Matters < 2.5㎛ with CD
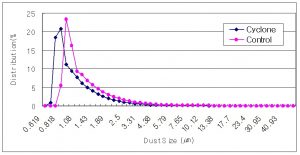
Fig. 4. Particle size distribution of aerial dust in weaned piglet building by number basis

Fig. 5. Particle size distribution of aerial dust in weaned piglet building by volume basis
Table 1: Comparative particle size distribution of dust in a weanling pig house
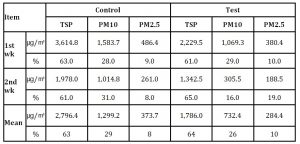
Table 2: Removal efficiency of dust using cyclone deduster
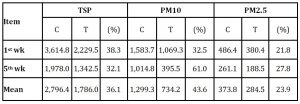
Table 3: Weekly weight of dust collected in the deduster bin
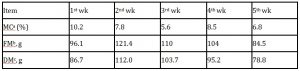
Table 4: Comparative evaluation of the bacterial and gaseous concentration of the test and control house
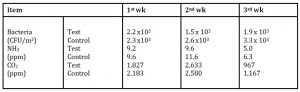
Table 5: Proximate analysis, mineral and heavy metal concentration of feed and dust