Introduction
Nitrogen is essential for the normal growth of plants. All vital physiological processes are related to this nutrient. It is a basic constituent of many compounds of primary physiological importance to plant metabolism, such as chlorophyll, nucleotide, proteins, alkaloids, enzymes, hormones and vitamins. Hence, nitrogen is a nutrient required by plants in comparatively large amounts than the other soil borne elements. Nitrogen must be supplied to the plant through inorganic fertilizer for an optimal yield and replenishment of removed soil nitrogen. For the manufacture point of view, nitrogenous fertilizers are most energy consuming compared to P and K fertilizers. Under the present energy crisis situation, grain legumes (pulses) are the boon for agriculture sector. They have unique capacity to fix atmospheric nitrogen (50-200 kg/ha/year) which helps to reduce the nitrogen dose to succeeding crop. Hence, in cropping systems, legume and cereal inclusion is very important. Usually legumes and cereals require higher amount of phosphorus and nitrogen, respectively due to their biological requirement. Under the present energy crisis situation, we have to reduce the dosage of chemical fertilizers to the crops. Apart from this, it is known that continuous application of chemical fertilizers has deleterious effect on soil health leading to unsustainable yields and volatilization, denitrification of nitrogen cause environmental hazards. Leaching losses of nitrogen which enters into deep layers of soil and further cause ground water pollution.
There is a need to improve nutrient supply system in terms of integrated nutrient management involving the use of inorganic and organic sources of nutrients in each cropping system. It is necessary to find out optimum quantity of P and N, respectively, to urdbean (legume) and wheat (cereal) crops under double cropping system of urdbean followed by wheat when organic manure was applied. Under the present energy crisis situation, it is necessary to work out the nutrient use efficiency for each crop production system for each crop under different situations. Keeping the above aspect in view, a study was undertaken to determine the doses of P and N to urdbean and wheat when FYM was applied for an efficient use of nutrients.
Material and methods
The experiment was conducted at Main Agricultural Research Station (MARS), University of Agricultural Sciences, Dharwad during the rainy/winter seasons of 2009 to 2011 under rainfed condition. The geographical co-ordinates of Dharwad are 15°26’ N latitude and 75°7’ E longitude and an altitude of 678 m above mean sea level. It is located in the Northern Transition Zone of Karnataka which has semi arid climate. The soil of the experimental site was clayey in nature and having available N, P and K of 211, 13.6 and 270.6 kg/ha (initial nutrient status of the soil), respectively. Organic carbon (%) and pH of the soil were, respectively, 0.52% and 7.2. Organic manure used in the experiment was having 0.5, 0.2, 0.5 and 15 percent N, P, K and C, respectively. During rainy season, the treatments comprised two levels of organic manures (Farm yard manure @ 0 and 5 t/ha) and three levels of phosphorus to urdbean (0, 25 and 50 kg/ha) with a common dose of 25 kg/ha of N. During winter, three levels of nitrogen (25, 37.5 and 50kg/ha) were applied with common dose of phosphorus of 25 kg/ha to wheat. The experiment was laid out in split plot design with combinations of organic manure and P levels to urdbean in rainy season as main plots and N doses to wheat during winter as sub plots. Organic manure (FYM) was applied three weeks before sowing. Urdbean genotype TAU-1 was sown on 12 and 10 June of 2009 and 2010 respectively. Wheat genotype DWR-2006 was sown on 5, 10 and 15 – October of 2010 and 2011, respectively. The dried samples of plant were ground in a Willy mill, passed through 40-mesh sieve. Plant N, P and K were estimated following the methods as advocated by Jackson (1973). Soil samples were collected from each plot after crops harvest from 0-20 cm depth, air dried and sieved (2 mm mesh). Soil available nitrogen, phosphorus and potassium were estimated by alkaline potassium permanganate Subbiah and Asija (1956), sodium bicarbonate Olsen et al. (1954) and ammonium acetate Hanway and Heidel (1952) method respectively.
The data collected on different parameters were subjected to statistical analysis following the procedure described by Gomez and Gomez (1984). The significance of difference between means was tested through ‘F’ test and the critical difference (CD/LSD) was worked out where variance ratio was found significant for treatment effect. The treatment effects were tested at 5% confidence level for their significance. The nitrogen (N)-use efficiencies were computed with the formulae given below:
Agronomic-use efficiency (kg grain/kg N applied) = (Yt -Yo)/Na
Where: Yt = Grain yield in the test treatment (kg/ha)
Yo = Grain yield in the control plot (kg/ha)
Na = N applied to the test treatment (kg/ha)
Phosphorus and potassium-use efficiency was computed in a similar way as that of N-use efficiency.
Wheat equivalent yield (WEY) was worked out based on gross return obtained by both urdbean and wheat crops and divided by selling price of wheat.
. Aa x Bb
Wheat equivalent yield (kg/ha) = _______
b
Where, A=yield of urdbean(kg/ha) B= yield of wheat (kg/ha)
a=price of urdbean( /kg) b=price of wheat( /kg)
For working out the price of urdbean and wheat selling price of economic yield of both crops was considered. Driving factors for selling prices are prevailing weather condition, demand and supply of the crops in the market.
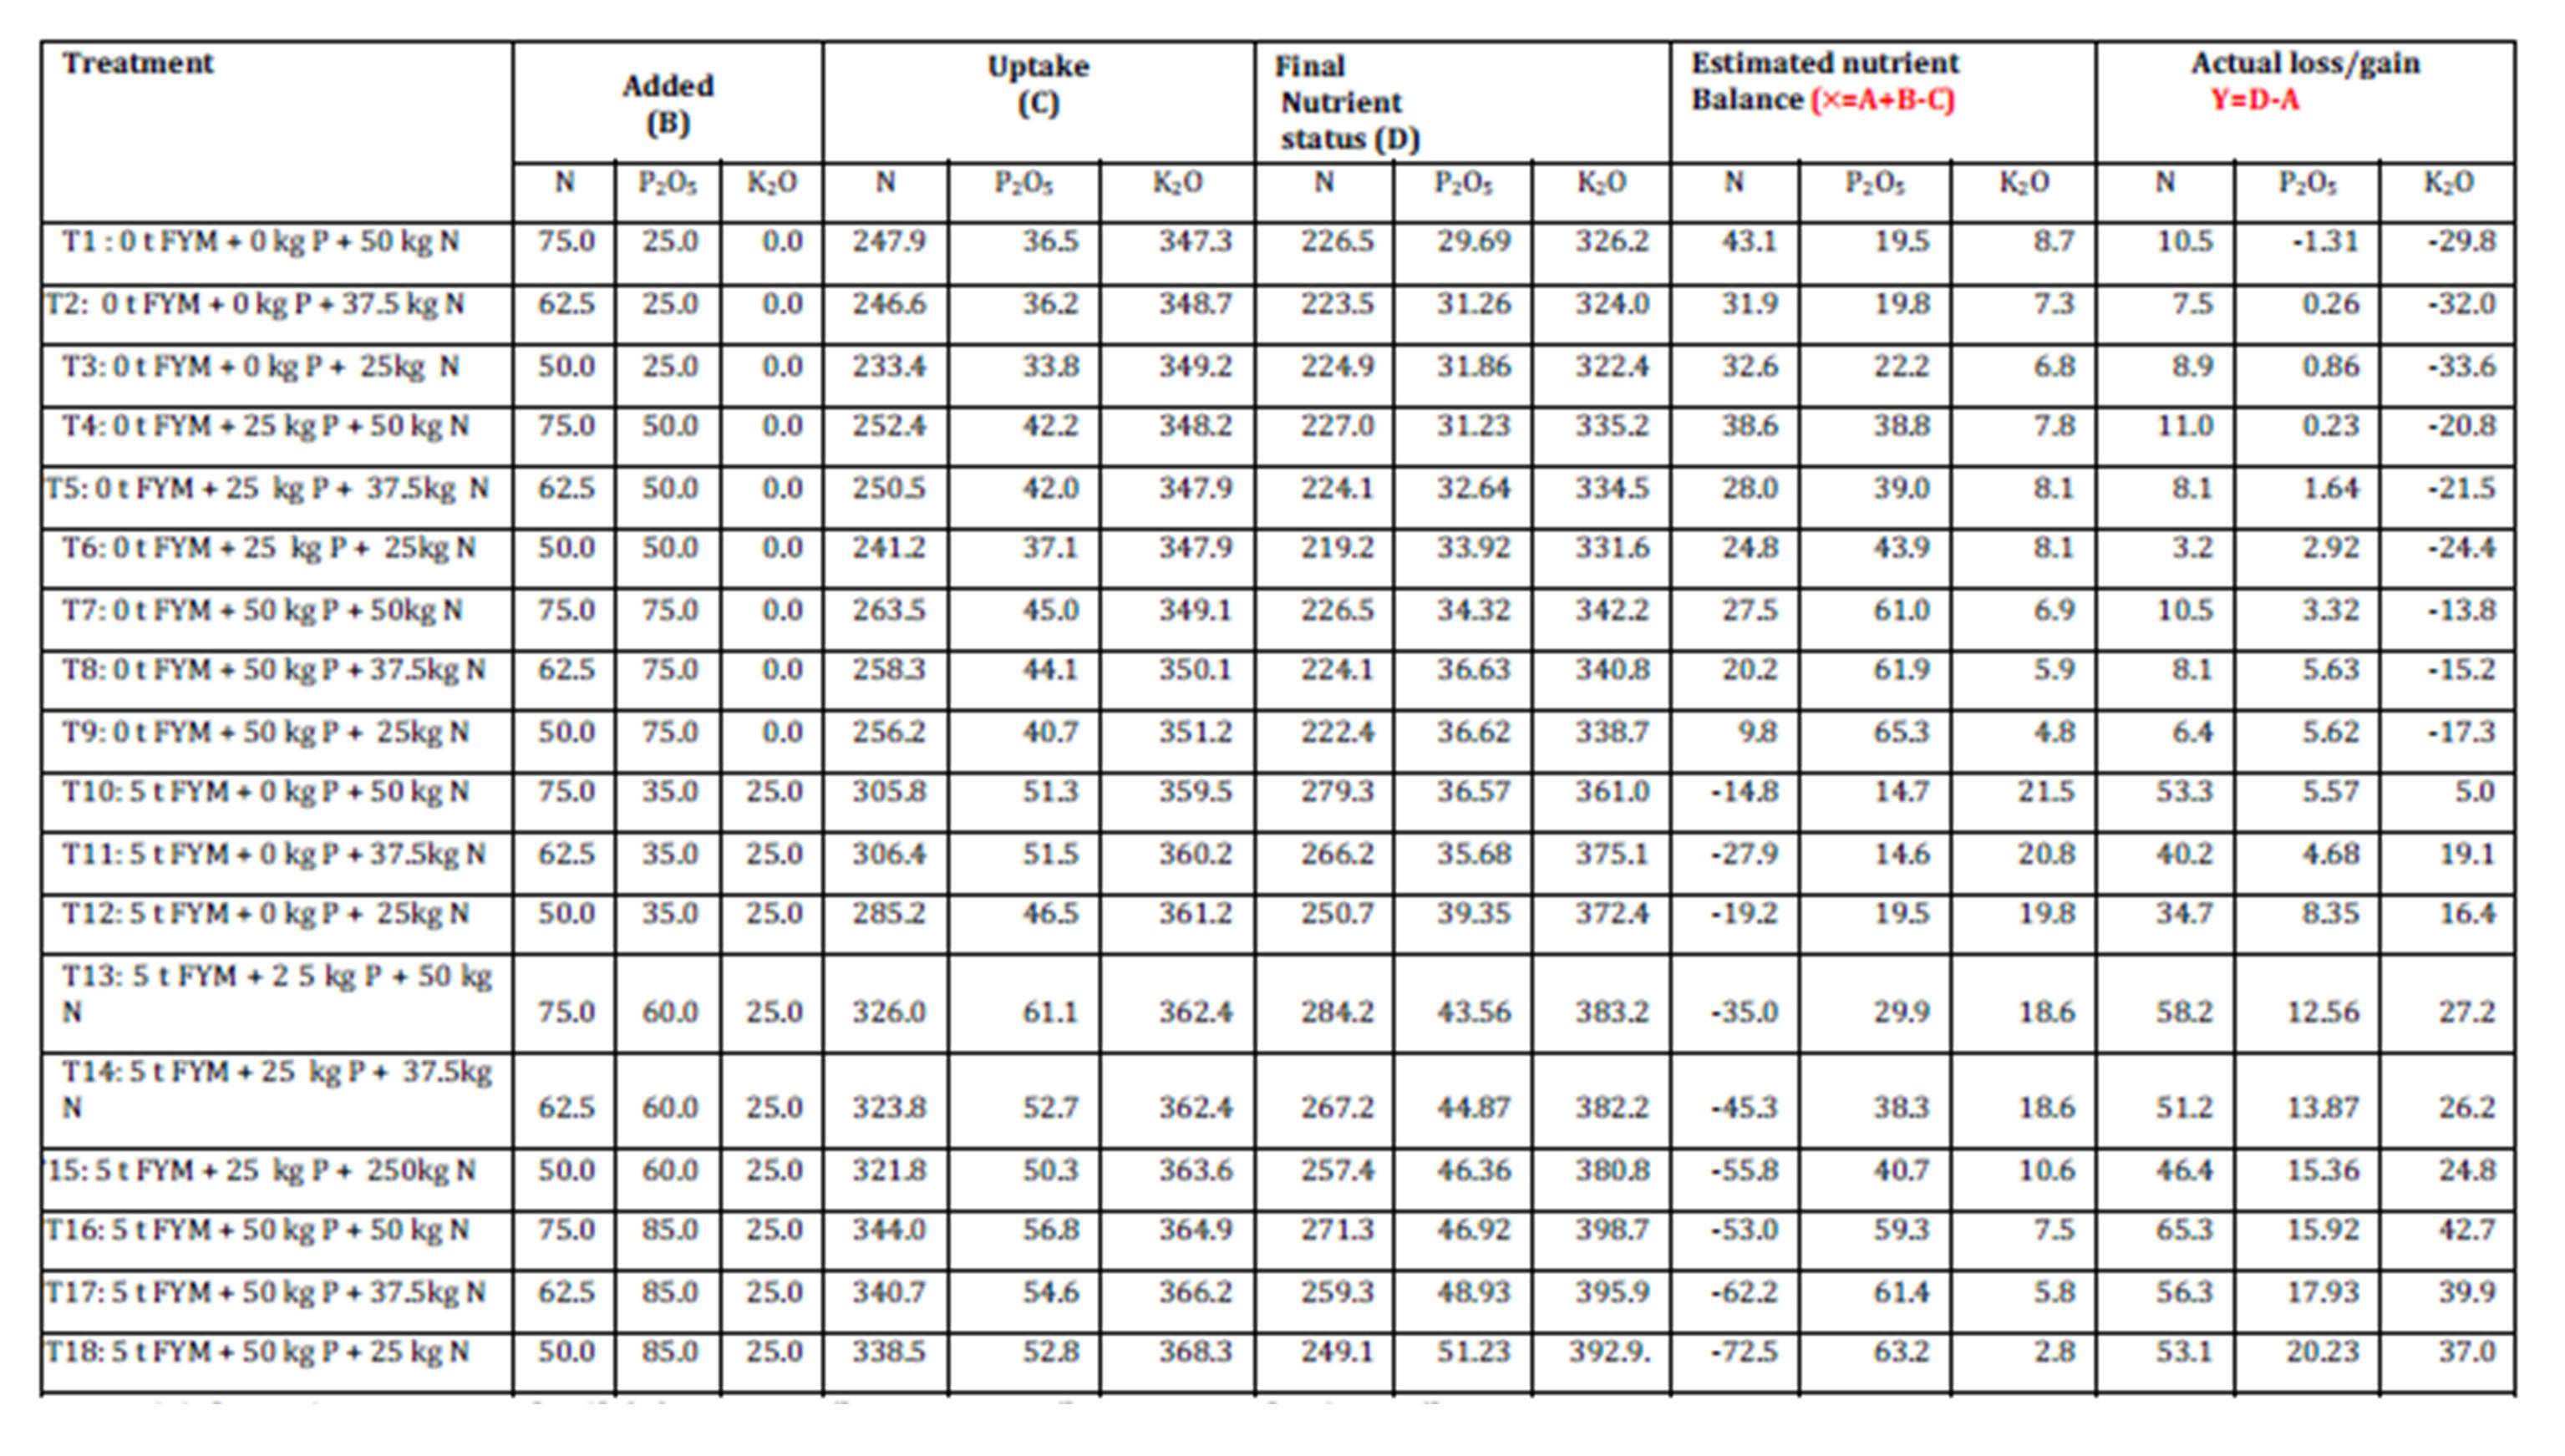
Estimated nutrient balance was carried out using the equation(X) X = A+B-C
Where A = Initial nutrient status of the soil (N =216: P2O5 =31: K2O=356 kg/ha)
B= Added nutrients (kg/ha) in the form of fertilizers and organic manures
C = Up take of nutrients (kg/ha)
Actual loss/gain was carried out using the equation (Y) Y = D-A
Where D = Final Nutrient status (kg/ha)
A = Initial nutrient status of the soil (N =216: P2O5 =31: K2O=356 kg/ha)
Gross returns (RS/ha) was calculated using the following formula
Gross returns (RS/ha) = Quantity of the economic yield (kg/ha) + Qt. of byproduct of the crop (kg/ha)
Price of the crop (Rs/kg) Price of the crop (Rs/kg)
Net returns (Rs/ha) = Gross returns — cost of cultivation
B:C ratio = Gross returns/cost of cultivation
Results and Discussion
System Productivity
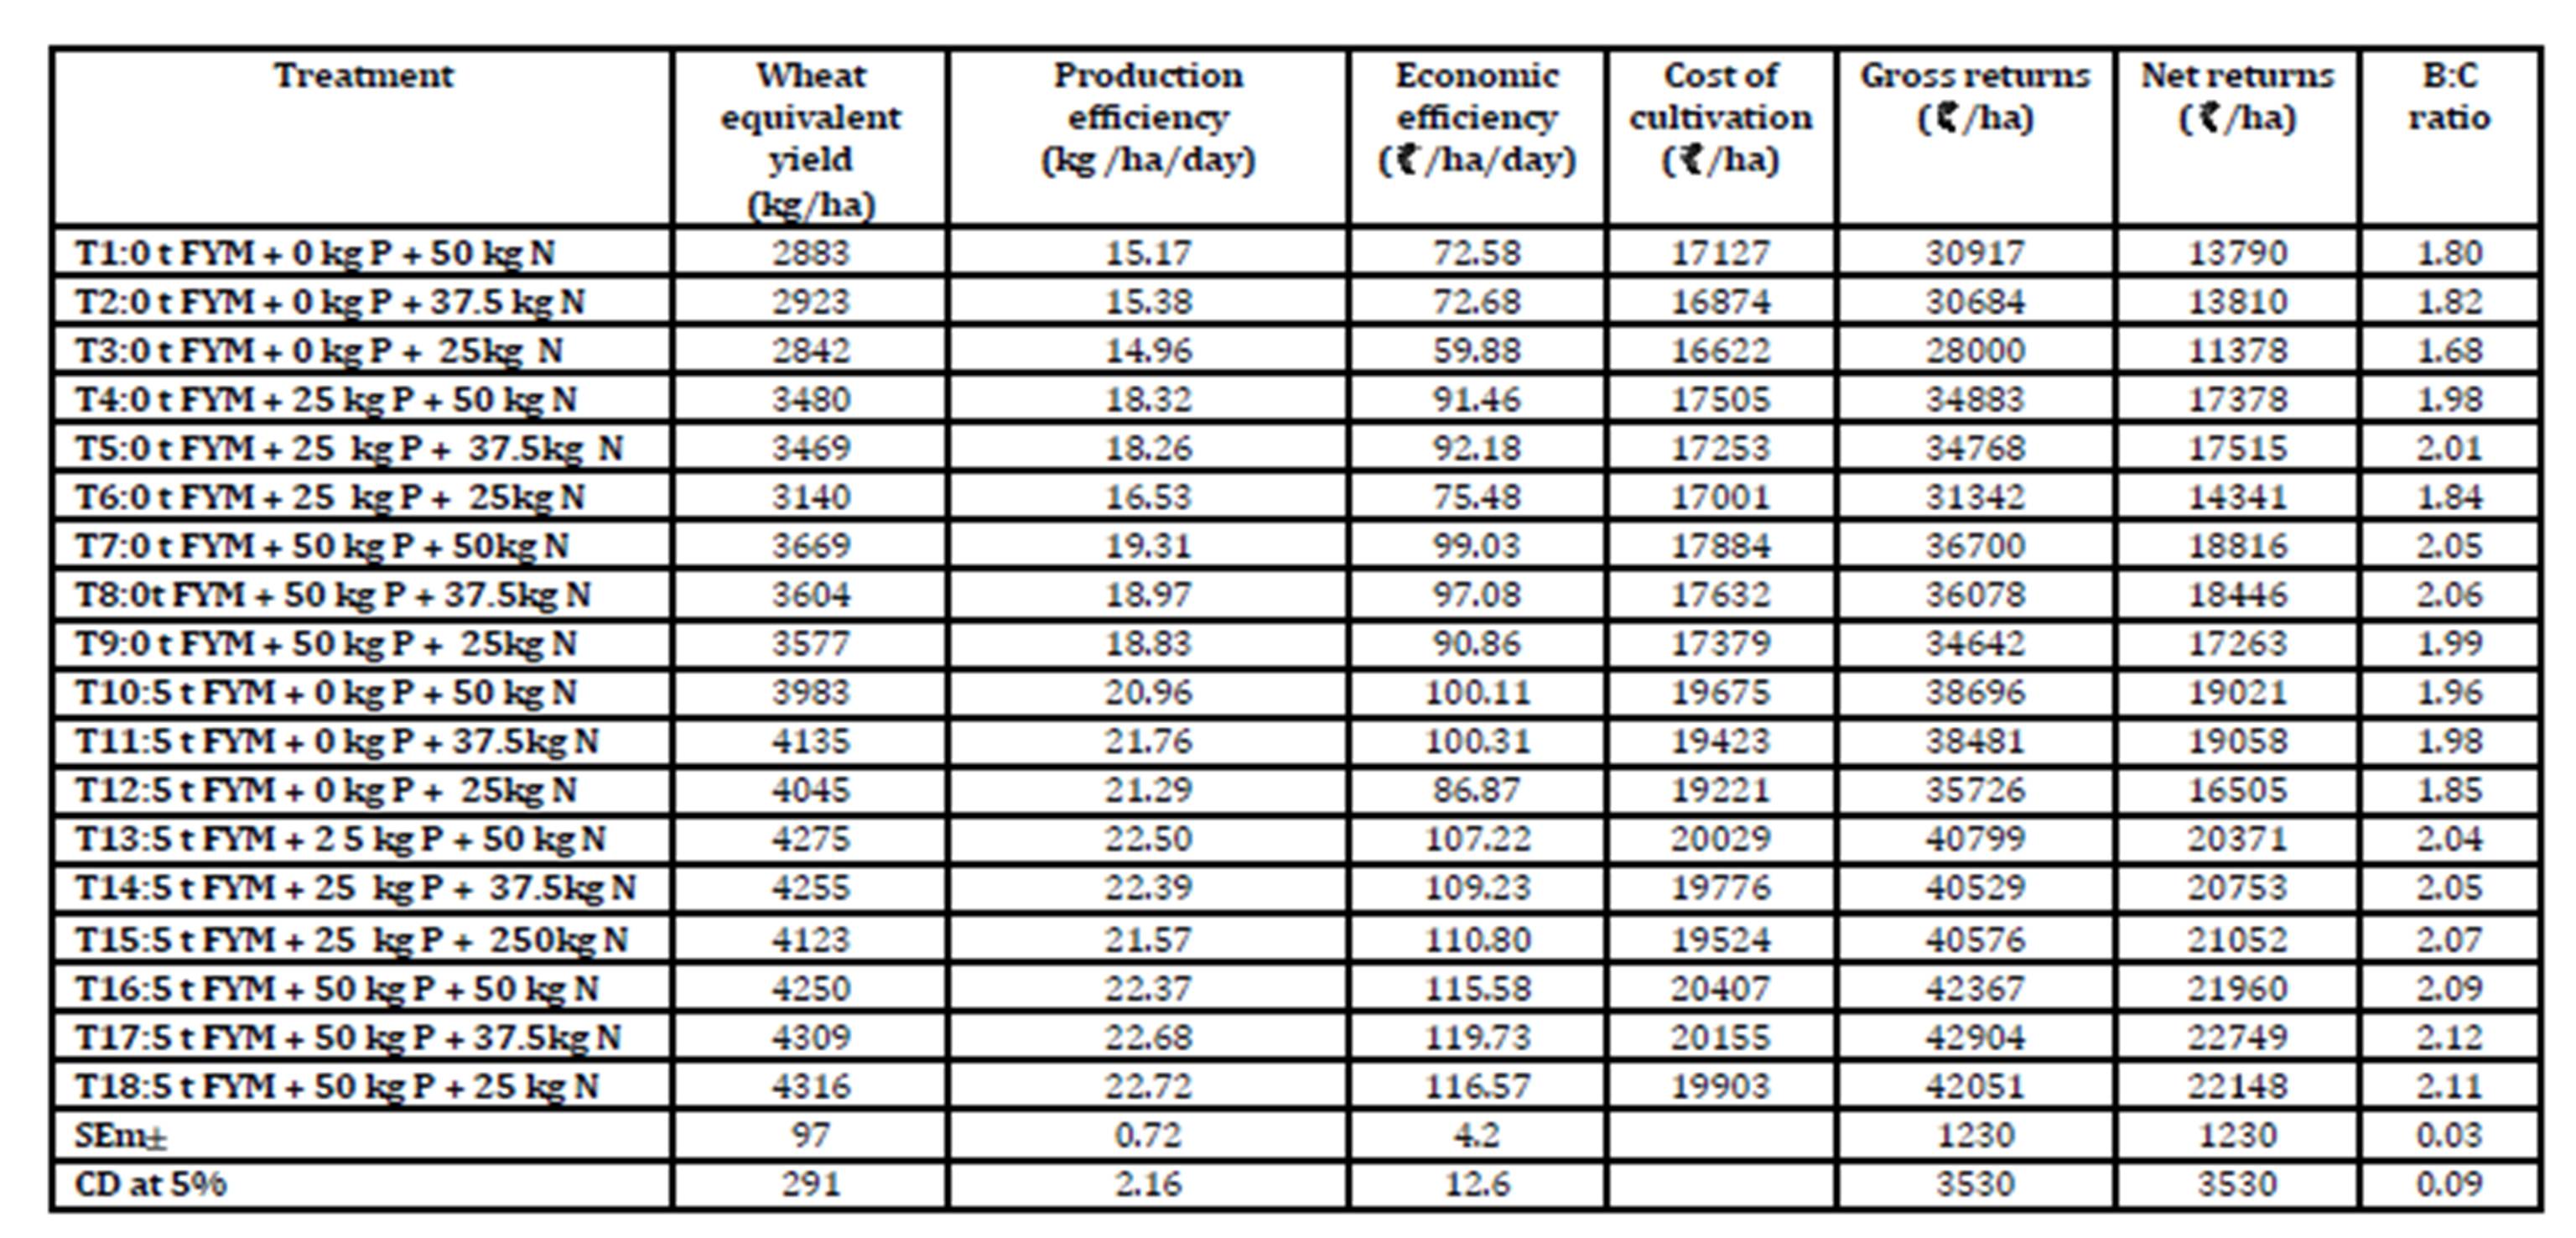
Pooled data of two year (4season) indicated that total system productivity (WEY) varied significantly due to P and N management in urdbean and wheat, respectively. The application of 5 t FYM/ha along with 25 kg P (50% of recommended dose) to urdbean irrespective of N doses to wheat recorded higher WYE over the same levels of P and N without FYM application (Table 2). System production depends upon management practices that cannot accomplish the present demands of the crop but also carry forward sufficient amount of nutrients capital for the follow up crop. Mahavishnan et al., (2005) reported that when FYM was applied to cotton crop about 30% N, 60-75% P and 80% K became available to the immediate follow up crop. Apart from this grain legumes are known to improve the productivity of succeeding crop due to improvement in nutrient use efficiency and biological nitrogen fixation Dwivedi et al., (2003).
The inclusion of P in the fertilization schedule enhanced yield of urdbean over N alone and the magnitude of increase was more under 5 t FYM + 50 kg P. The yield response to 50 kg P/ha over 25 kg P and 0 kg P was 5.27 and 14.49%, respectively. The use of 5 t FYM along with 25 kg P to urdbean and 37.5 kg N to wheat brought an additional wheat equivalent yield of 389 kg (10.6%) over 0 t FYM along with 50 kg P to urdbean and 50 N to wheat.
Economic efficiency
The highest values of gross returns (42904 Rs/ha), net returns 22749 Rs /ha) and B : C ratio (2.12) were recorded in 5 t FYM+50 kg P+37.5 kg N. This treatment gave 20.9 % higher net return over control (0 t FYM+50 kg P+50 kg N). Economic efficiency (107.22-119.73/ha/day) was almost comparable among the treatments T13 to T18, where 5t FYM was added with 25 or 50 kg P/ha to urdbean and 25 to 50 kg N to wheat. This was attributed to the higher yield of urdbean and wheat recorded in these treatments. These results corroborate with those of Gopinath and Mina, (2011).
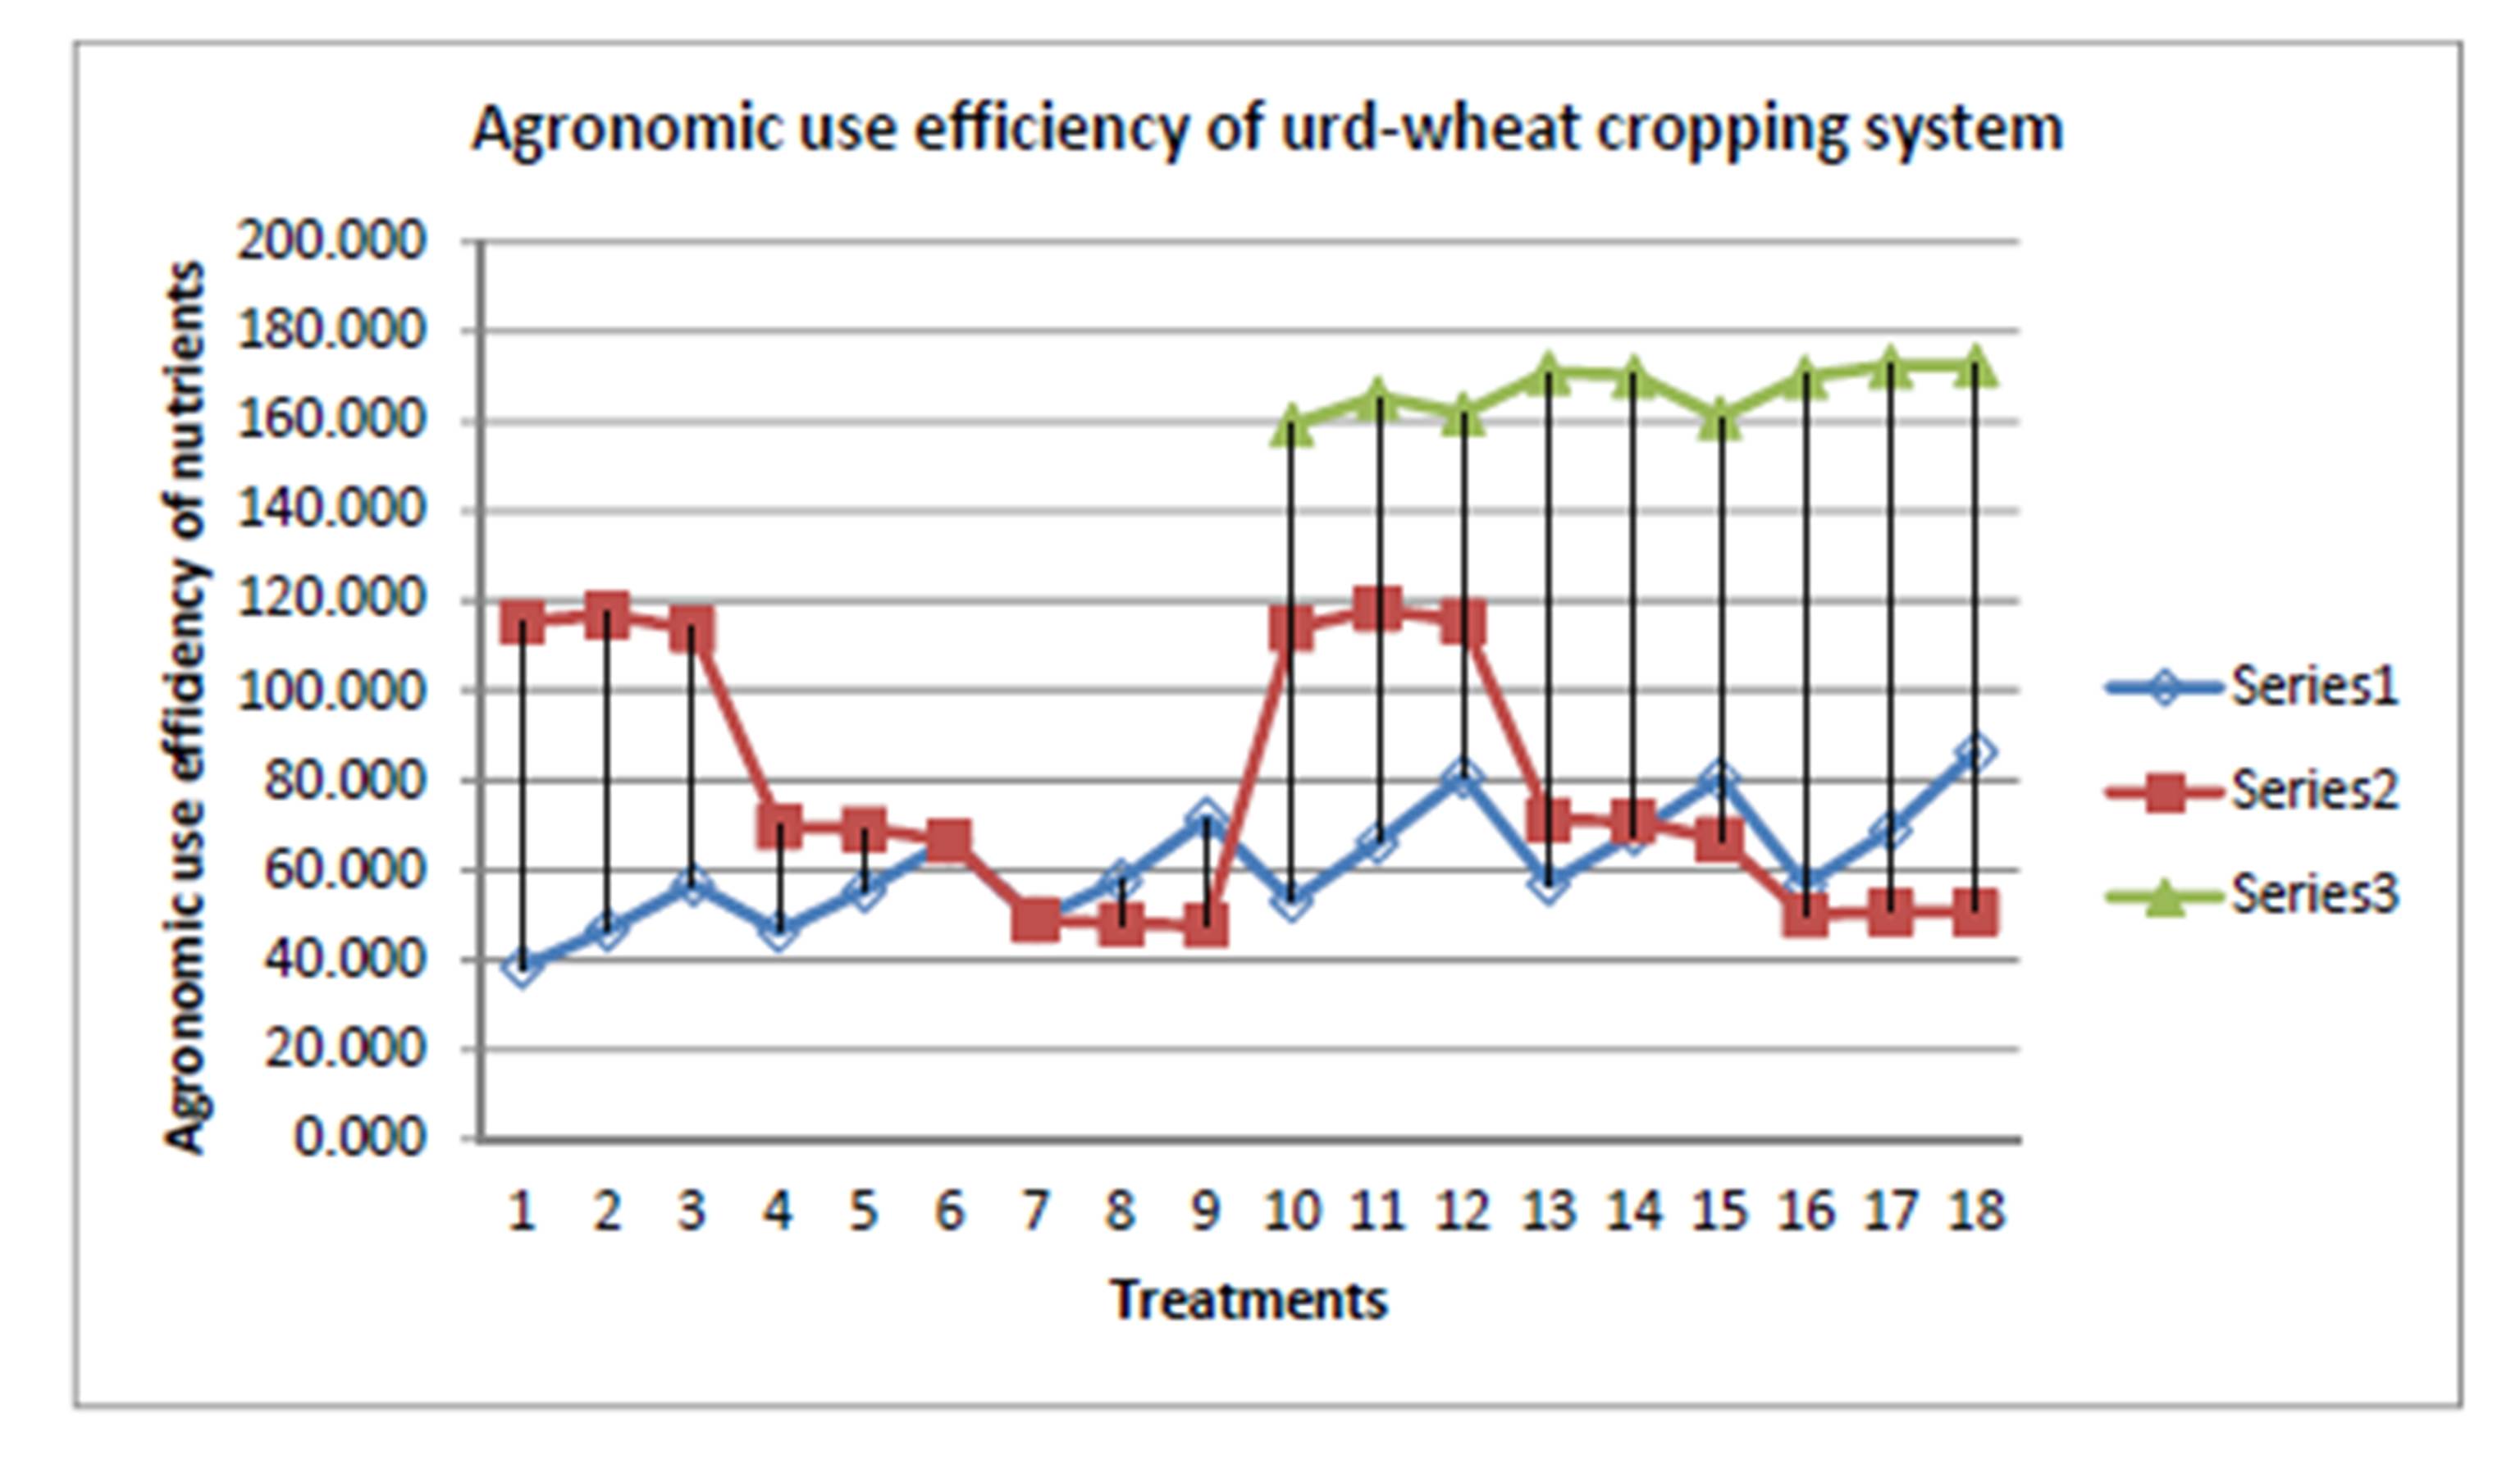
Agronomic use efficiency of N, P and K
Incremental rates of the fertilizer N brought concomitant decrease in the N use efficiency under both with and without FYM application systems (Fig.1). Results suggested higher N use efficiency under the treatments receiving both P and FYM compared to those receiving N or P alone. Highest N use efficiency was observed where 5t FYM was applied with 50 kg P2O5 to urdbean and 50% RDN to wheat (T18).
With respect to P also, the same trend was observed. Singh et al., (2006) also noticed similar results in rice-wheat system. In both systems of FYM application, agronomic P use efficiency was high consequent to the application of fertilizer N. Wherever FYM was applied along with P, nitrogen effect was not seen on P use efficiency. The highest P use efficiency was observed where 5t FYM was applied with 0 kg P2O5 to urdbean and 100% N to wheat. With regard to K use efficiency, the same trend followed with N application.The treatments T1-T9 received 0 kg K2O/ha and treatments T10-T18 received 25 kg K2O/ha (through 5t FYM). The treatment receiving 5 t FYM along with 50kg P2O5 to urdbean and 50% N to wheat (T18) recorded the highest K use efficiency.
Nutrient balance sheet:
The estimated balance sheet, (ï‚´=A+B-C, in table-2) which was computed by substraction of nutrient uptake of the crops from nutrient addition from different sources (through soil, fertilizer, organic manure etc..) revealed negative N balance under all treatments applied with 5t FYM/ha. where as actual loss/gain (Y=D-A, in table-2) in all the treatments having 5t FYM were having higher values for N gain than those treatments without FYM. This difference may be due to the reason that the contribution of biological nitrogen fixation in urdbean was not measured while computing estimated N balance. Literature indicates that legumes may decline 54-70% of their N requirement through BNF (Awonaike etal, 1990).
P2O5 values were positive in the estimated balance sheet since both crops of the system removed less P2O5 than the addition through the fertilizer and other sources, with consequent increase in P2O5 application, values for P2O5 balance also increased. There was actual gain in P2O5 and K2O values when 5t FYM was applied compared to no FYM application. However, biological nitrogen fixation in urdbean was not measured while computing estimated N balance, which was the limitation of the study
Conclusion
The result of the above study concluded that wheat equivalent yield, gross returns, net returns and B: C ratio were not reduced significantly when 5t FYM/ha was applied along with 25 kg P2O5 to urdbean and 37.5 kg N to wheat. There was higher N and P use efficiency under this system compared to the application of 50 kg P2O5 and 50 kg N to urdbean and wheat, respectively without FYM application.
Table 1: System productivity and economics of urdbean – wheat cropping system (Pooled)
Table 2: Nutrient balance of urdbean – wheat cropping system
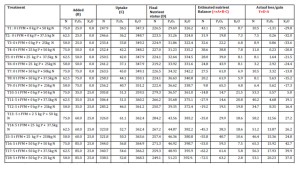 Initial nutrient status of soil (A) =216Kg/ha N, 31 Kg/ha P 2O5 and 356 Kg/ha K2O
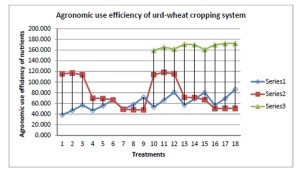
Figure 1
Series 1 N use efficiency (kg/kg)
Series 2 P use efficiency (kg/kg)
Series 3 K use efficiency (kg/kg)
References
1. Awonaikc ,K. KUlnarsinghe, K.S. and Danso, S.K.A. (1990) “Nitrogen fixation and yield of cowpea as influenced by cultivar and Bradyrhizobium strain”, Field Crops Research, 24 : 163-71
Publisher – Google Scholar
2. B.S Dwivedi, Arvind K Shukla, V.K Singh and Yadav R.L. (2003) “Improving nitrogen and phosphorus use efficiencies through inclusion of forage cowpea in the rice—wheat systems in the Indo-Gangetic Plains of India” Field Crops Research, Volume 84, Issue 3, Pages 399-418.
Publisher – Google Scholar
3. Gomez, K. A. and Gomez, A.A. (1984) “Statistical Procedures for Agricultural Research” 2nd Edn. John Willey and Sons, New York.
Google Scholar
4. Gopinath, K. A. and Mina, B. L. 2011. “Effect of organic manures on agronomic and economic performance of garden pea (Pisum sativum) and on soil properties.” Indian J. agric. Sci. 81 : 236-239.
5. Hanway, J .J . and Heidel, H. (1952) “Soil analysis methods as used in Iowa State College Soil Laboratory”, Iowa Agriculture , 27: 1—13.
6. Jackson, M. L.( 1973) “Soil Chemical Analysis”, Prentice Hall of India Pvt. Ltd, New Delhi, India
7. Mahavishnan, K. Prasad, M. and Rekha ,K .B. (2005) “Integrated nutrient management in Cotton —sunflower cropping system in the sandy loam soils of north India”, Journal of Tropical Agriculture, 43:29—32.
Google Scholar
8. Olsen, S. R. Cole, C. V. Watanabe, F. S. and Dean, L. A. (1954) “Estimation of available phosphorus in soil by extraction with sodium bicarbonate”, USDA Circular No. 939.
Google Scholar
9. Subbiah, B. V. and Asija, G. L. (1956) “A rapid procedure for estimation of available nitrogen in soil” Current Science, 25: 259—60.
10. Singh, V.K. Dwivedi ,B.S and Arvind shukla (2006) “Yields, and nitrogen and phosphorus use efficiency as influenced by fertilizer NP additions in wheat (Triticum aestivum) under rice (Oryza sativa)-wheat and pigeonpea (Cajanus cajan)-wheat system on a Typic Ustochrept soil” Indian Journal of Agricultural Sciences, 76 (2): 92-7.
Google Scholar