Introduction
Rapid mixing (Cheremisinoff (2002), Asano et al. (2007), Mavros (2001)), in water treatment is to rapidly disperse the coagulant into raw water, followed by flocculation (Ghernaout and Naceur (2011)), sedimentation (Goula et al. (2008)), and filtration (Kurita (1999), De Zuane (1997), Xiao et al. (2008)). This process has a strong influence on the overall treatment efficiency (O’connor et al. (2009)). Considering that the hydrolysis products, Mel(OH)mn+ (Me: metal ions; OH: hydroxide ion; l, m, n: constants), of the coagulants such as alum or Fe(III) are produced within a very short time of 10-4to 1 s and moreover, aluminium hydroxide starts to precipitate in about 7 s (Amirtharajah and Mills (1982)), it is important to make the metallic coagulants rapidly disperse into the whole fluid bulk. Practically, it is not easy to disperse them in less than a second and consequently it is recommended in the literature to release this mass transfer operation as rapidly as possible (Hudson and Wolfner (1967), Vrale and Jorden (1971)). Moreover, due to the fact that the mechanical mixing devices have not the potential to disperse metallic species during this short time, engineers increase the coagulant dosage tested in the jar test by 30-40%. It leads to getting the required efficiency of coagulation just by increasing collision opportunities (Kawamura (2000)) between coagulant ions and colloids (Kurita (1999), Parsons and Jefferson (2006), Park et al. (2009), Li et al. (2009)).
In many of the conventional treatment plants, however, the coagulant mixing is typically performed in a concrete basin with a mechanical mixer, and requires about 1—2 min of retention time. As mentioned above, mechanical mixing with a longer retention time cannot guarantee an instantaneous and uniform coagulant dispersion (Kim and Lee (2006)). For this reason, the so-called pump diffusion mixer (PDM) has been proposed. PDM is a reasonable method and also has the potential to solve problems, such as noise, energy waste, and high maintenance cost, related with the use of a mechanical mixer. The work conducted by Clark et al. (1994), using various rapid mixing devices (Cheremisinoff (2002)) to test the sedimentation performance (Goula et al. (2008)), showed that in-line hydraulic jet and static mixers (Smith et al. (1991)) are able to achieve performance equivalent to that of the mechanical mixing type at a lower coagulant dosage (Park et al. (2009), Yoon and Kim (2008).
In contrast to a number of studies on the comparison of different rapid mixing devices and conditions (Kim and Lee (2006)), Clark et al. (1994), Barbot et al. (2008)), there have been relatively few studies on the optimisation of PDM and the establishment of operating guidelines. Manufacturers have suggested the pressurised/main inlet water flow-rate ratio (pumping rate) as the most important parameter. Kawamura (2000) recommended that the flow-rate ratio should be in the range of 4-10% in order to guarantee uniform coagulant dispersion in PDM. Recently, the PDM has been introduced for the rapid and complete dispersion of a coagulant within a second before the metal hydroxide precipitate has formed. The PDM is an effective device for the quick dispersion of hydrolysing metal salts. PDMs have been introduced and operated at several water treatment plants (WTPs) in Korea since early 2000s for the purposes of rapid mixing. However, the results of their performance evaluation showed that uneven dispersion of the injected coagulant was often observed in a full-scale PDM (Park et al. (2009)).
This review discusses rapid mixing in coagulation process from using the classical basin to the PDM in the natural organic matter (NOM) removal perspective. Using EC in a classical basin or optimised mixing in PDM for dissolved organics elimination constitutes the main aim of this article. Some works related to PDM using in coagulation process are treated. Finally, the concept of ultraflocculation and the future of coagulation are briefly reviewed.
Coagulant Dispersion in Full-Scale Pump Diffusion Mixers
The objectives of Park et al.’s (Park et al. (2009)) study are to evaluate the effect of pumping rate, which have been used as the most important parameter for operating PDM, on mixing performance, and to suggest the criteria of pumping rate for improving the performance of PDM. They selected three WTPs (OS, PS, and SJ), which have used PDM for rapid mixing (Park et al. (2009)).
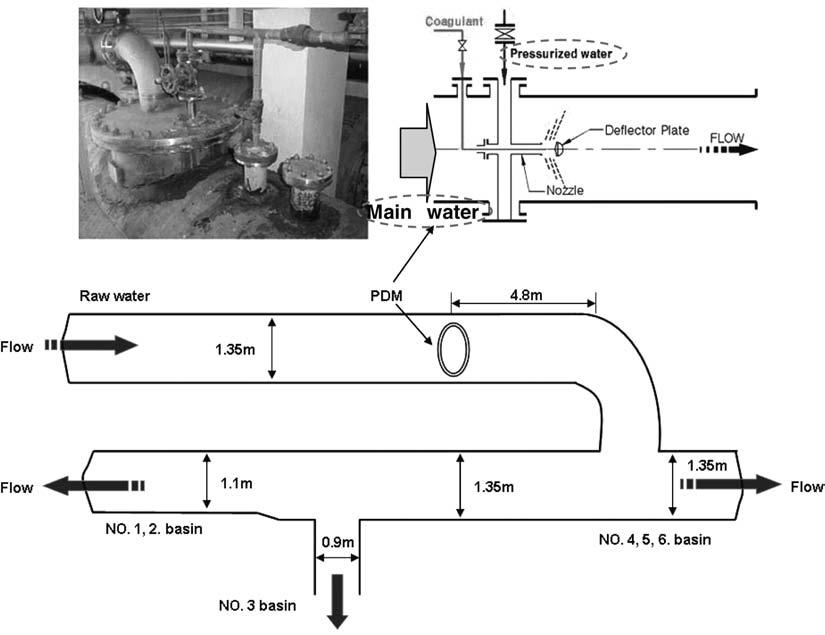
In order to investigate the problems associated with the difference of water quality among six sedimentation basins following PDM in OS WTP, Park et al. (2009) measured zeta-potential (Gray (2005)) and streaming current. The intervals of sampling and measurement are 1 min for streaming current and 10 min for zeta-potential. They defined “pumping rate” as the ratio between the pressurised water flow rate and the main water flow rate (marked by two red dot–lined circles), as shown in Fig. 1 (Park et al. (2009)).

Fig. 1. PDM Schematic in OS WTP (Park Et Al. (2009)).
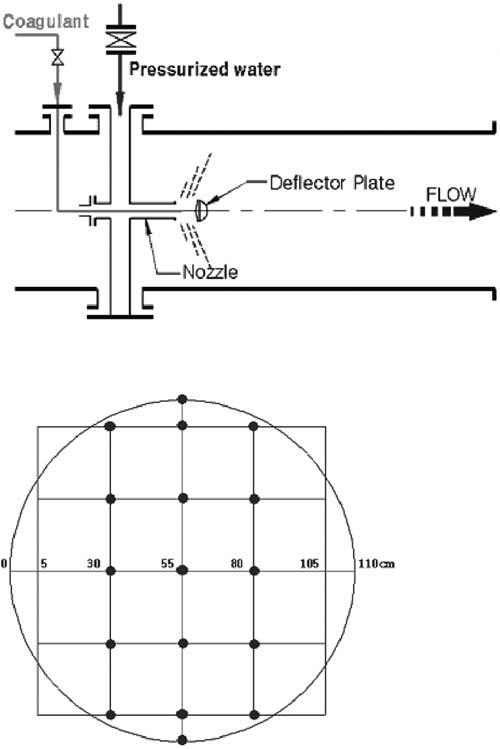
For evaluating the mixing performance of PDM and the coagulant dispersion in it, they conducted the wet test (Park et al. (2009)). The wet tests are used to measure the zeta-potential all over the cross section at a distance of 4.5 D (D = 1,200 mm, D: diameter) from the deflector in the selected PDMs at various pumping rates. The coagulant being used in both of WTPs is PAHCS (Al+, 10.5%). As shown in Figs. 2 and 3, sampling cross section is determined at a distance of 5.4 m (4.5 D) from the deflector, and samples are taken from 14 points in the case of OS WTP and 22 points in the case of SJ WTP, respectively. In both cases, the wet tests are carried out for three conditions on which the pumping rates are 2, 4, and 8%. The results of the zeta-potential in each case are depicted as graphs using the commercial programSURFER 8.0. These graphs would show the factual coagulant dispersion distribution on the selected cross section (Park et al. (2009)).
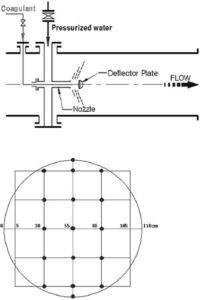
Fig. 2. Schematic Diagram of PDM Operated In PS WTP And Sampling Points on the Cross Section (Park Et Al. (2009)).
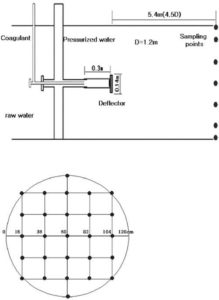
Fig. 3. Schematic Diagram of PDM Operated In SJ WTP and Sampling Points on the Cross Section (Park Et Al. (2009)).
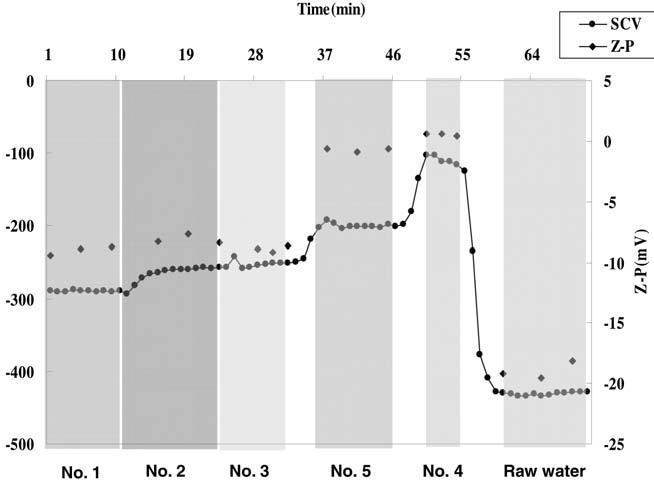
Fig. 4 shows the zeta-potential and streaming current in each effluent from six sedimentation basins. Number 6 basin is not operated during the test. The values of zeta potential and streaming current in effluent from number 1, 2, and 3 are lower than those from number 4 and 5 basins. Since the performance of PDM is poor, the coagulant dispersion is not uniform in the rear of injection point. It is considered that the concentrations of the coagulant in number 4 and 5 basins are denser than those in 1, 2, and 3 basins. To make matters worse, as shown in Fig. 1, return bend and “T” connection are installed at a distance of 4.8 m from the PDM. That is, unevenly branded bulk water leaving from PDM is distributed through those bend and connection. The time on the x axis in Fig. 4 represents the sampling and measurement interval on steady state. During the test, the flow condition is kept to be steady state (Park et al. (2009)).

Fig. 4. Zeta-Potential and Streaming Current in Each Effluent from Five Sedimentation Basins and Raw Water (The Pressurised Water Flow Rate: 215 M3 Hr-1 (Fixed); Main Inlet Water Flow Rate: 5,280 M3 Hr-1 = 4.07% (Pumping Rate) (Park Et Al. (2009)).
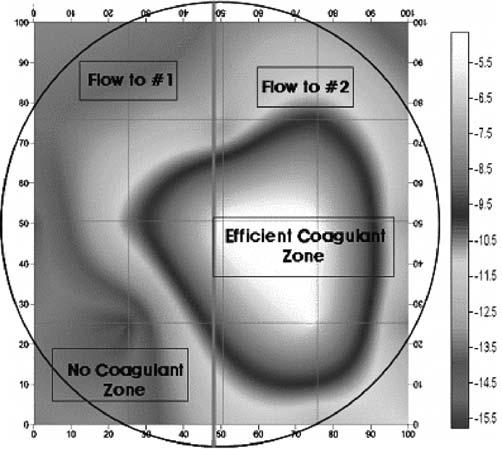
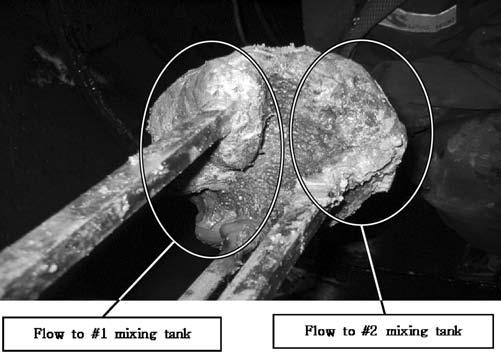
Fig. 5 shows the factual zeta-potential distribution at a distance of 5.4 m from the deflector on the condition that the main water flow rate is 4,600 m3 hr-1, and the pressurised/main water inlet flow-rate ratio (pumping rate) is 1.3%. As shown in Fig. 5, the measured zeta-potential is distributed unevenly. The value of zeta-potential on the right side is higher than that on the left side. In order to investigate the cause of that deflection, Park et al. (2009) observed the inside of the PDM. From the results of visual observation and components’ analysis, a lump could be seen on the left side of deflector (refer to Fig. 6), and the main components of that lump are aluminium and silicon. The biased growth of lump can make the injected coagulant dispersed unevenly. As shown in Fig. 6, the growth of lump adhered to the deflector could occur due to inadequate installation of the nozzle, low pumping rate, geometrical eccentricity, and so on (Park et al. (2009)).

Fig. 5. Zeta-Potential Distribution Pattern (PS WTP) (The Pressurised Water Flow Rate: 59.8 M3 Hr-1, the Main Water Flow Rate: 4,600 M3 Hr-1) (Park Et Al. (2009)).

Fig. 6. Aluminium Adherent to Deflector (PS WTP). (A) The Pressurised Water Flow Rate: 65 M3 Hr-1, The Main Inlet Water Flow Rate: 3,250 M3 Hr-1. (B) The Pressurised Water Flow Rate: 32.5 M3 Hr-1, The Main Inlet Water Flow Rate: 1,625 M3 Hr-1 (Park Et Al. (2009)).
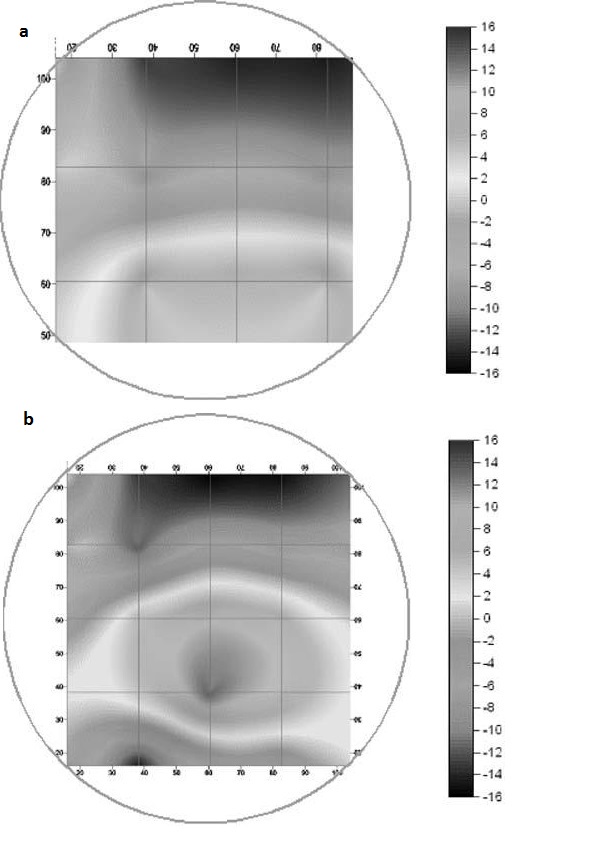
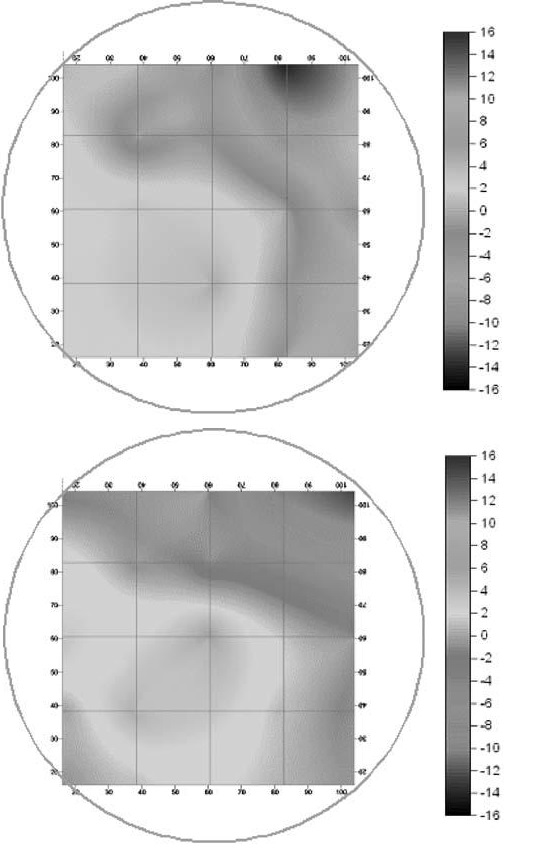
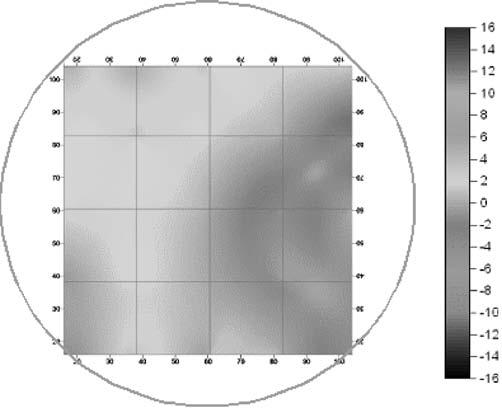
Fig. 7 shows the factual zeta-potential distribution at a distance of 5.4 m from the deflector in the case that the pumping rate is 2.0% for two different main inlet water flow rates, 3,250 and 1,625 m3 hr-1, respectively. The results of both cases are very similar to each other. Irrespective of the main inlet water flow rate, the measured zeta-potential is higher on the lower part than that on the upper part. This is due to the injected coagulant that is eccentrically dispersed on the lower part. On the other hand, the zeta-potential is negative on the upper part, which resulted from the lower concentration of the coagulant on the upper part (Park et al. (2009)). Fig. 8 shows the factual zeta-potential distribution in the case that the pumping rate is 4% for different main inlet water flow rates, 3,250 and 1,625 m3 hr-1, respectively. Compared with the results from the case of the pumping rate 2%, even though the distribution of zeta-potential is relatively uniform, the negative zeta-potential region is still observed on the upper-right side of the cross section measured (Park et al. (2009)). Fig. 9 shows the factual zeta-potential distribution in the case that the velocity ratio was 8% for the constant main inlet water flow rate, 1,625 m3 hr-1. Compared with the results from the previous cases, the distribution of zeta-potential is more uniform. Also, there is no negative zeta-potential region all over the selected cross section (Park et al. (2009)).
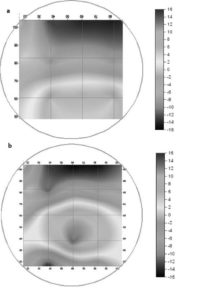
Fig. 7. Zeta-Potential Distribution Pattern in the Case of Pumping Rate 2%. (A) The Pressurised Water Flow Rate: 130 M3 Hr-1, The Main Inlet Water Flow Rate: 3,250 M3 Hr-1. (B) The Pressurised Water Flow Rate: 65 M3 Hr-1. The Main Inlet Water Flow Rate: 1,625 M3 Hr-1 (Park Et Al. (2009)).

Fig. 8. Zeta-Potential Distribution Pattern in the Case of Pumping Rate 4% (Park Et Al. (2009)).
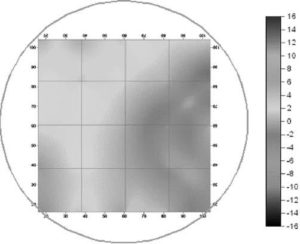
Fig. 9. Zeta-Potential Distribution Pattern in the Case Of Pumping Rate 8% (The Pressurised Water Flow Rate: 130 M3 Hr-1, The Main Inlet Water Flow Rate: 1,625 M3 Hr-1) (Park Et Al. (2009)).
From all cases of the wet test, it can be concluded that the pumping rate (the pressurised/main water inlet flow-rate ratios) is the most important parameter of PDM. Also, if the pumping rate is over at least 8%, the performance of PDM, the uniform dispersion of the coagulant, can be guaranteed (Park et al. (2009)).
Park et al. (2009) summarised their study as follows:
(1) From the wet test for OS WTP, it could be thought that the asymmetric pipe structure in the front and rear of PDM may make the injected coagulant dispersion uneven. In order to solve this problem, it is necessary to secure some distance from the deflector to prevent the interference caused from the asymmetric bend and connection. As shown in Fig. 4, installing a bend and “T” connection at a distance of 4.5 m from the PDM can make the main flow deflected, and ultimately the injected coagulant dispersion uneven.
(2) PDM is a reasonable method and also has the potential to solve the problems, such as noise, energy waste, and high maintenance cost, related with the use of a mechanical mixer. However, it also has potential problems, associated with the growth of a lump adhered to the deflector and inadequate pumping rate in operation. The periodical cleaning and checking of the pumping rate are needed to guarantee its satisfactory performance.
(3) It is considered that the pumping rate (the pressurised/main water inlet flow-rate ratios) is the most important parameter for operating PDMs. Also, if the pumping rate is at least over 8%, the performance of the PDM, the uniform dispersion of coagulant, can be guaranteed (Park et al. (2009)).
Rapid Mixing for NOM Removal
Although NOM (Schäfer (2001)) is a reactive component that interacts with many inorganic and organic pollutants, which may decrease the toxicities of these pollutants in water (Cabaniss and Shuman (1988)), it is an important precursor of disinfection by-products (DBPs) (Xie (2004)), such as trihalomethanes (THMs) and haloacetic acids (HAAs), and enables the growth of microorganisms in the treatment unit or distribution system (Khan et al. (1998), Ghernaout et al. (2011)). The formation of DBPs is generally known to be highly dependent on the organic matter (OM) content, as well as many other factors, such as the OM composition and water treatment methods (Ghernaout et al. (2010)). Significant differences are found in the DBPs formation between the hydrophobic and hydrophilic fractions isolated from Han River water (Kim and Lee (2006)) when used as a water source for conventional water treatment processes. The hydrophilic fraction (HLF) is found to be enriched in HAAs precursor sites compared to that of the hydrophobic fraction (HBF); the content and disinfection by-product formation potentials (DBPFPs) (Xie (2004)) of the HLF are also only slightly reduced using conventional water treatment (Kim et al. (2004)). In addition, products such as HAAs, dichloroacetic acid and trichloroacetic acid, have been established to be animal carcinogens (Bull and Kopfler (1991), Deangelo and McMillan (1988)). Therefore, the removal of NOM (Listiarini et al. (2009)) in a water treatment processes system has become an important issue, with the enhanced removal of HLF prior to the final disinfection required to reduce the risk of HAAs (Kim and Lee (2006)).
The most common conventional way of treating water, including NOM (Ghernaout and Ghernaout (2012)), is coagulation/sedimentation with aluminium or ferric salts as coagulant (Parsons and Jefferson (2006)), but such a treatment method mainly reduces particles and larger OMs via sweep coagulation (Ghernaout (2014)). In many WTPs, the coagulation process (Lin et al. (2008)) is optimised primarily for the removal of turbidity rather than NOM. However, the optimum conditions for turbidity removal are not always the same as those for NOM removal (Baalousha (2009)) even if some NOM is removed through the coagulation/sedimentation process. Several mechanisms are referred to when describing the NOM removal by coagulation process (Ghernaout (2013)), but it is likely that more than one mechanism will be responsible for NOM removal. The three mechanisms of NOM removal most commonly referred to are charge neutralisation, entrapment and adsorption (McCurdy et al. (2004)). For example, Al salts dissociate when added to water, and the charged Al hydrolysis products interact electrostatically with anionic NOM to form insoluble charge-neutral products. In operational regions, where insoluble Al hydroxide is formed, the NOM can be removed by entrapment (i.e.,sweep coagulation) or surface adsorption (Gregor et al. (1997), Nason and Lawler (2009)). The effectiveness of a coagulation process in removing NOM varies according to the nature of the NOM (i.e., its molecular weight, charge density, hydrophobicity and so forth), the physicochemical characteristics of the water and the operational conditions, such as the initial mixing intensity and duration (Letterman et al. (1999)). As seen above, the initial mixing conditions are critical in a coagulation process, since rapid and uniform dispersion of metal coagulant has advantages for the formation of charge-neutral products for NOM removal. Vrale and Jorden (1971) suggested that instantaneous mixing, based on chemical theories of adsorption-destabilisation (Gregory (2006)), produce the best results (Kim and Lee (2006)).
There are two obvious points which are retained from the results reported by Clark et al. (1994):
– Firstly, because the jar-test technique, which has been used to determine the minimal coagulant concentration and the residual turbidity of the water, uses mixing device with back mixing type, it is suggested that this could involve the problem caused by the use of excess coagulant with the operation of the in-line (Oh and Lee (2005)) initial mixing. Since the important operation aspect of the in-line initial mixing process (Wang and Wang (2006)) is the application of the correct quantities to changing raw water quality, a monitor system using photometric dispersion analyser (PDA) has been tried to determine the chemical dosage in coagulation process (Huang and Liu (1996)). However, PDA technique, as well as zeta potential measurement (Gray (2005)) which requires a relatively long time for responding, are not feasible for determining the optimal coagulant dosage with real-time because influent turbidities and the coagulant demands are quite time-variant. From this reason, streaming current (i.e. streaming potential) detector units have improved on the zeta potential measurement and appear to be successful in the coagulant control (Kam and Gregory (2001)).
– Secondly, better sedimentation performance with the use of an in-line initial mixer may favourably influence the removal of NOM as well as the turbidity in a coagulation/sedimentation process, and the composition and characteristic of NOM could also be influenced by different initial mixing types. In addition, since the formation potential of DBPs is influenced by the OM composition and water treatment method, the molecular structure of NOM is one of the main characteristics studied for the control of DBPs. The composition of NOM can be investigated by numerous methods, including physicochemical fractionation and spectroscopic measurements. NOM fractionation, using adsorption resins, is generally considered a state-of-art method, which is used to estimate the behaviours and properties of NOM from various sources (Listiarini et al. (2009)). A method for measuring the spectra of NOM using fluorescence spectroscopy is also largely accepted as an adequate method for the qualitative characterisation of NOM (Peuravuori et al. (2002)).
Pump Diffusion Flash Mixing (PDFM) for Improved Drinking Water Treatment
The main purposes of Kim and Lee’s work (Kim and Lee (2006)) were to compare the influence of different initial mixing types on the NOM removal in conventional water treatment, and propose an appropriate method for coagulant dosage optimisation in the operation of PDM. Attempts were made to reduce the latent risk of DBPs caused by NOM through improvement of the initial mixing without the addition of advanced water treatment processes (Kim and Lee (2006)).
The Amsa Water Treatment Plant (AWTP) employs conventional water treatment, consisting of pre-chlorination, coagulation/sedimentation, sand filtration and chlorination, and uses Han River water as a water source. The quality of the pre-chlorinated water used as an influent to Kim and Lee’s (Kim and Lee (2006)) pilot plant is shown in Table 1. A pilot plant designed to treat 1000 m3 day-1 is built at the AWTP, and optimised for energy efficiency and mixing intensity. This plant is operated for the study of the feasibility of introducing PDM, with in-line mixing, as shown in Fig. 10(a). Commercially available liquid polyaluminium chloride (PACl, 17% as Al2O3) solution is used as the coagulant in all their experiments, with the optimal coagulant dose for the operation of PDM decided using the jar-test early in their work (Kim and Lee (2006)).
Table 1: The Basic Quality of the Pre-Chlorinated Water in Studied Period (February—June 2005) (Kim and Lee (2006)).
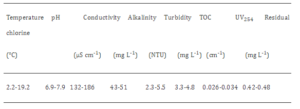
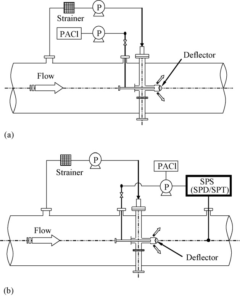
Fig. 10. Schematic Diagram of the PDM System: (A) Coagulant Dosage Optimisation by Jar-Test and (B) Coagulant Dosage Optimisation by SPS (Kim And Lee (2006)).
In order to optimise the coagulant dosage for PDM, a streaming potential system (SPS; Sentrol Systems Inc., USA) is used and evaluated, as shown in Fig. 10(b). The SPS consists of a streaming potential transmitter (SPT) and a streaming potential detector (SPD). The SPT is the sensing component of the SPS. As coagulated water continuously passes through the probe of the SPT, from the inlet to the outlet, the relative movement between the two parts of the probe generates a continuous raw streaming potential signal, which reflects the intensity of coagulated water electrical charge. The SPD receives the raw streaming potential signal from the SPT and converts it into industrial standard output signals for system control. The SPD displays the streaming potential signal within the range −5 to +5. The range −5 to 0 indicates that the coagulated water is negatively charged, from 0 to +5 that it is positively charged, with 0 indicating electrical neutrality. A computer system is used to adjust the coagulant dosage based on the SPD’s output signal at the optimum point. In theory, the optimum point for coagulant dosing occurs when the charged organic and inorganic colloids (Pashley and Karaman (2004)) are electrically neutralised; when the SPD displays 0 (zero) the coagulant is optimally dosed (Kim and Lee (2006)).
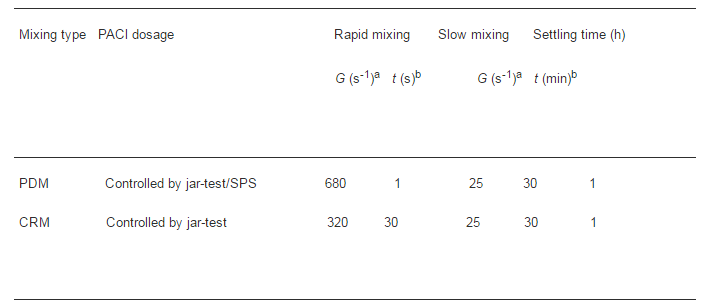
A scaled down mechanical mixing basin (length, width and effective height = 350 mm) is used for comparison with PDM for chemical coagulation (CC), with this mixing type defined as conventional rapid mixing (CRM) in Kim and Lee’s study (Kim and Lee (2006)). This mechanical mixing device employed the characteristic dimensions described in work conducted by Rossini et al. (1999). CRM consists of a square baffled container made of polymethylmethacrylate, with a six flat-bladed stainless steel turbine impeller of one-third the standard geometry, similar to that of a turbine impeller used in a real plant for drinking water production. The typical residence time (t) and velocity gradient value (G) (Shammas (2005)) for mechanical mixing are applied for adequate operation of CRM, with the PACl dosage decided using a jar-test. The operational conditions of PDM and CRM for the coagulation and sedimentation of pre-chlorinated water are shown in Table 2. PDM and CRM are also operated to investigate the effects of initial mixing type and coagulant dosage on NOM removal; thus, the PACl dosage is varied up to 30 ppm (7.1 mg L-1 as Al2O3) in a batch type process, and the supplementary addition of polyelectrolytes is not performed (Kim and Lee (2006)).
Table 2: Operation Conditions for PDM and CRM (Kim and Lee (2006)).

a Velocity gradient, b Residence time.
The pH of raw and treated waters are adjusted to 2 by the addition of hydrochloric acid, following filtration through a 0.45 μm membrane filter in the laboratory, and the sample solution then isolated into hydrophobic and HLFs using the methods of Thurman and Malcolm (1981) (more detailed analytical methods are in (Kim and Lee (2006))).
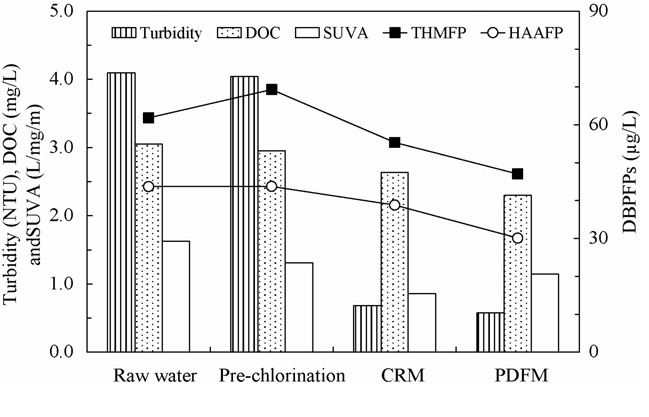
The average trends for the dissolved organic carbon (DOC), specific ultraviolet absorbance (SUVA) and DBPFPs as well as that of the turbidity remaining in solution after coagulation/sedimentation with different mixing types are shown in Fig. 11. Through PDM and CRM, the turbidity and DOC (Worrall and Burt (2009)) in pre-chlorinated water decreased from 4.04 to 0.57 and 0.68 NTU and from 2.95 to 2.30 and 2.64 mg L-1, respectively. The SUVA value also decreased from 1.63 to 1.31 L/mg/m due to pre-chlorination, and is further decreased from 1.31 to 1.14 and 0.86 L/mg/m via PDM and CRM, respectively. In the case of PDM, the removal efficiencies of turbidity and DOC are higher than those of CRM, while the SUVA, which has been used as an indicator of the humic content in water environmental systems (USEPA (1999)), is less reduced than in the case of CRM. The SUVA value is calculated from the UV254 divided by the DOC of the water sample, where the UV254 is mainly caused by electro-rich sites, such as aromatic functional groups and double-bonded carbon groups in NOM molecule. In general, hydrophilic NOM has less electron-rich sites than the HBF. Therefore, this might mean that the HLF in bulk NOM is more effectively removed by PDM than CRM (Kim and Lee (2006)).

Fig. 11. Variation in Treated Water Quality with Different Mixing Types (Kim and Lee (2006)).
The DBPFPs decreased with reductions in the precursors during water treatment. The trihalomethanes formation potential (THMFP) and haloacetic acids formation potential (HAAFP) in the pre-chlorinated water are 69.3 and 43.8 μg L-1, respectively, which decreased to 47.1 and 30.1 μg L-1, and 55.4 and 38.8 μg L-1 through PDM and CRM, respectively. However, some increase in the THMFP is observed after the pre-chlorination process. This increase could be explained as being due to the formation of intermediate species (e.g., formation of phenolic compounds from the oxidation of aromatic compounds or methyl ketones from the oxidation of olefins) by a partial oxidation process. Since the intermediate species remaining in the solution also react easily with chlorine in haloform reactions (i.e. electrophilic substitution reaction), the DBPFPs of pre-chlorinated water were higher than those in raw water (Kim and Lee (2006)).
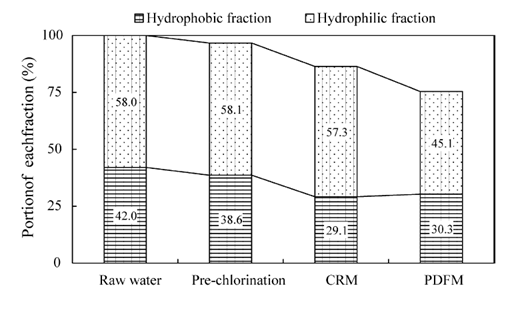
The variations in the distribution of the hydrophobic (Choi et al. (2008)) and hydrophilic fractions during water treatment are determined in relation to the DOC concentration, as shown in Fig. 12. The hydrophobic and hydrophilic fractions in pre-chlorinated water decreased by PDM, from 38.6% (1.08 mg C L-1) to 30.3% (0.84 mg C L-1) and 58.1% (1.62 mg C L-1) to 45.1% (1.26 mg C L-1), respectively, based on the DOC of raw water. In the case of CRM, the hydrophobic and hydrophilic fractions decreased from 38.6 to 29.1% (0.81 mg C L-1) and from 58.1 to 57.3% (1.60 mg C L-1), respectively. From these results, no significant difference in the removal of HBF is observed between the two different mixing types. However, the HLF only changed by 0.8% with CRM, but is decreased by 13.0% with PDM. This suggests that hydrophilic compounds are selectively removed by PDM. Conversely, the HBF, which has more electron-rich sites than the HLF, is decreased by pre-chlorination, indicating partial oxidation of the electron-rich sites, such as aromatic functional groups and double-bonded carbon groups (Kim and Lee (2006)).

Fig. 12. Distribution of NOM Isolated from Raw and Treated Waters (Kim and Lee (2006)).
The reaction of soluble hydrolysis products with the binding sites on soluble OMs when Al salts are added to water is due primarily to the negative charge carried by NOM, including charged acidic groups, such as phenolic and carboxylic groups (Letterman et al. (1999)). During the early dissociation of Al salts, soluble hydrolysis species will bind with sites (e.g., COO−) on NOM via charge neutralisation. The residual Al salts, not participated in the charge neutralisation during the Al hydrolysis reaction, are changed into insoluble Al hydroxide. Thereafter, insoluble Al hydrolysis products, consisting of charge-neutralised flocculant and/or aluminium hydroxides, will remove the residual NOM via sweepcoagulation and surface adsorption. Such sweep coagulation mainly contributes to the removal of the HBF that has a higher molecular weight and lower repulsion against the flocculant (Kim and Lee (2006), Nason and Lawler (2009), Xiao et al. (2009)).
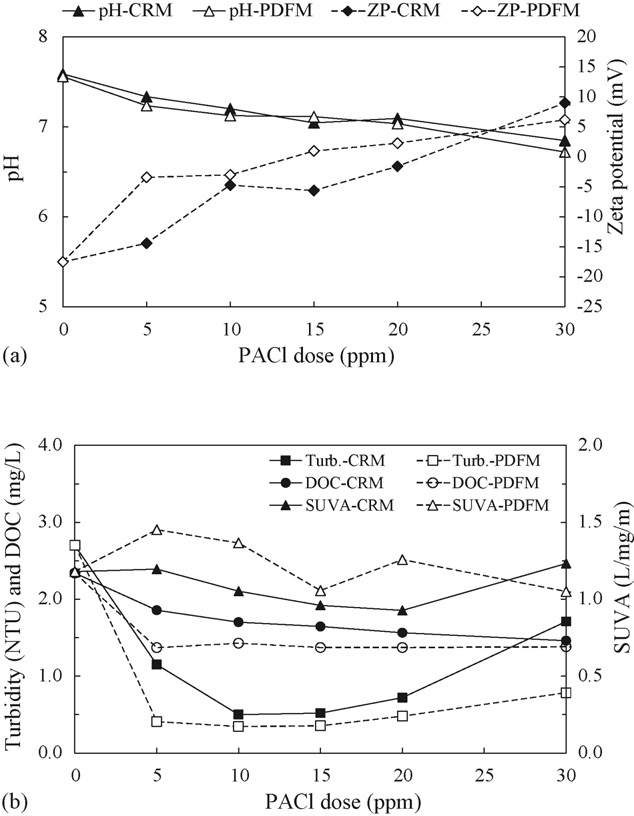
Al salts (Yu et al. (2009)) dissociate when added to water and the Al3+ ions undergo metal ion hydrolysis reactions, and the nature of the resulting species depend on such variables as Al concentration, pH, temperature and the presence of other ions. In general, the destabilisation mechanisms (Gregory (2006)) by monomer and polymeric species of Al are different from each other. That is, charge neutralisation (Barany and Szepesszentgyörgyi (2004)) is mainly influenced by the monomer species prior to the completion of the Al hydrolysis reaction, while sweep coagulation and/or adsorption depend more on the polymeric species. Therefore, the rapid and uniform dispersion of the coagulant could influence the charge neutralisation mechanism, the possibility of which has been identified in the literature. Amirtharajah (1981) suggested that the smaller eddies formed at higher G values might be more successful in transporting preformed Al hydrolysis species to the surface of the particles responsible for turbidity, and that the rapid-mix G value is important in charge neutralisation. This is also indirectly identified by the determination of the zeta potential, as shown in Fig. 13(a). In the case of PDM, the zeta potential is more quickly raised than with CRM when the coagulant is under-dosed with respect to optimum conditions for turbidity removal. This indicates that cationic aluminium hydrolysis products immediately neutralised the anionic sites on colloidal NOM and particles early during the Al hydrolysis reaction. Consequently, the coagulation mechanism in the case of CRM is dominated by conventional entrapment (i.e., sweepcoagulation), while PDM is more influenced by charge neutralisation due to the quick dispersion of Al salts prior to the formation of the Al hydroxide precipitate. Also, because of the different reactivities of NOM fractions toward cationic aluminium hydrolysis products, the HLF, which may have a higher charge density and electrostatic attraction than the HBF, is more effectively removed via charge neutralisation. These results are consistent with the greater removal of DOC, whereas the SUVA decreased less by PDFM than with CRM, as shown in Fig. 11 (Kim and Lee (2006)).
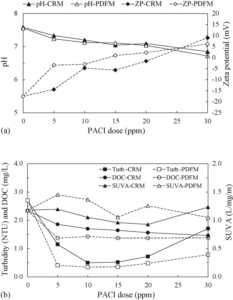
Fig. 13. Variations in Ph, Zeta Potential, Turbidity, DOC and SUVA of Treated Water with Different Mixing Types: (A) Ph and Zeta Potential and (B) Turbidity, DOC and SUVA (Kim and Lee (2006)).
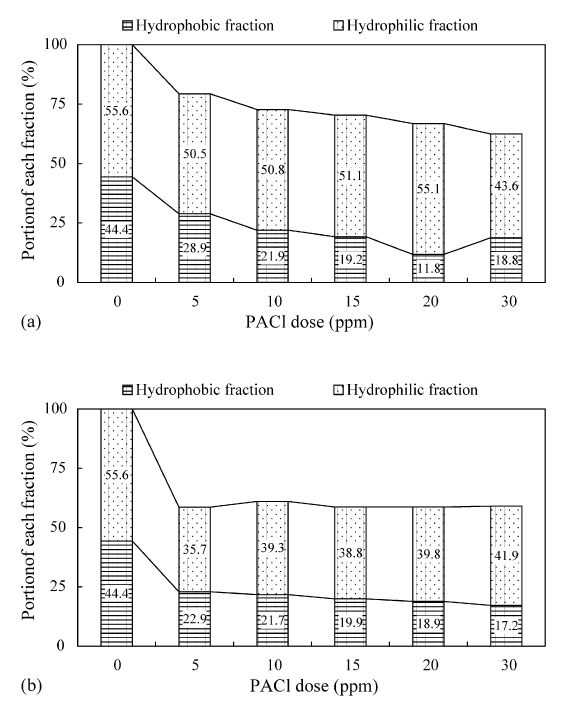
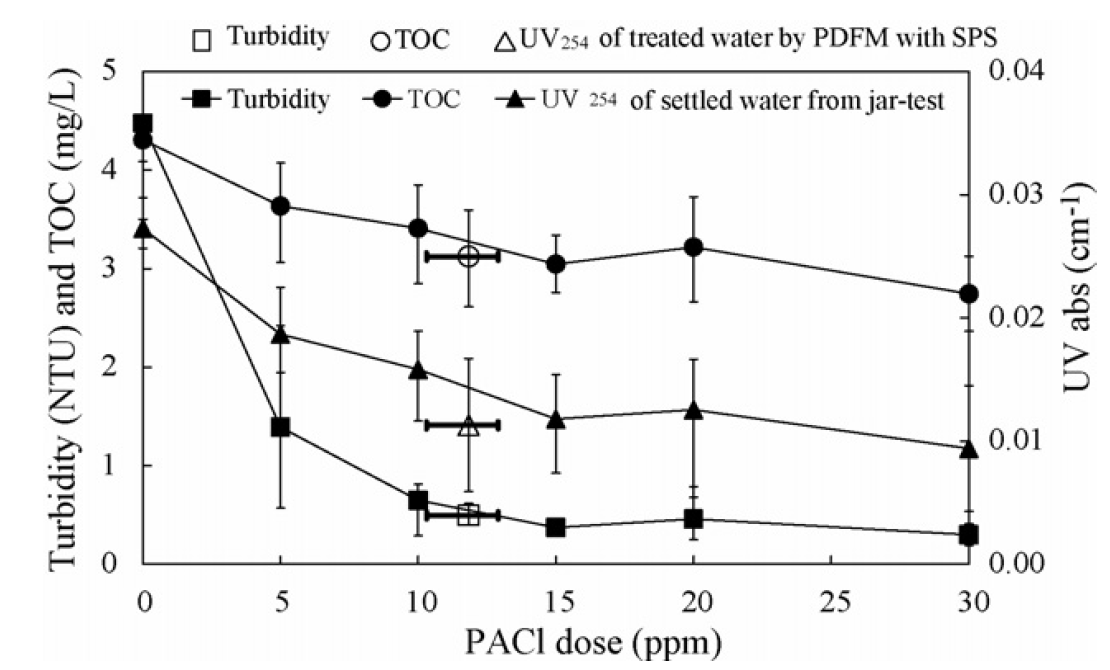
In coagulating and settling the pre-chlorinated water, the variation in treated water quality depending on the coagulant dosage (0—30 ppm) is shown in Fig. 13. Through PDM and CRM, the DOC (2.34 mg C L-1) of the pre-chlorinated water decreased to the ranges 1.43—1.37 and 1.86—1.46 mg C L-1, respectively, with increasing coagulant dosage. The SUVA (1.18 L/mg/m) varied within the ranges 1.45—1.05 and 1.23—0.93 L/mg/m through PDM and CRM, respectively. In the case of PDM, the turbidity and DOC removals were higher than those with CRM, while the SUVA in the treated water was higher than that with CRM, as shown in Fig. 13(b). As shown from the results in Fig. 11, the HLF is more effectively removed by PDFM than CRM. From the isolation of NOM from raw and treated waters, the distribution of the hydrophobic and hydrophilic fractions in the bulk NOM is identified as being influenced by the initial mixing type (Nason and Lawler (2009)), as shown in Fig. 14. In the case of PDFM, the HLF decreased no further even with increases of the coagulant dosage from 5 to 30 ppm (1.2—7.1 mg L-1 as Al2O3). This result could possibly be explained due to the difference between the hydrophilic acids and non-acid HLF in the reactions with the cationic aluminium hydrolysis products. In general, hydrophilic NOM consists of hydrophilic acids and the non-acid HLF (Chang et al. (2001), Parsons et al. (2004)). The hydrophilic acids have higher acidic functional group contents, while the non-acid HLF contains few acidic functional groups. Therefore, it is possible to presume the removal characteristics of the hydrophilic NOM as follows: hydrophilic acids that included sufficient anionic binding sites could be removed via charge neutralisation with cationic aluminium hydrolysis products early during the chemical dispersion, while the non-acid HLF could not be effectively removed, even with increases in the coagulant dosage. The HBF gradually decreased with increasing the coagulant dosage, independent of mixing type, indicating that residual coagulants (which did not participate in the charge neutralisation during aluminium hydrolysis reaction) are changed into insoluble Al hydroxide, with the HBF removed bysweep coagulation and/or adsorption via interactions with the insoluble Al hydroxide (Kim and Lee (2006)).
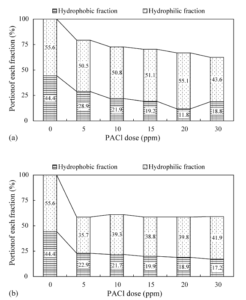
Fig. 14. Variation in NOM Distribution of Treated Water with Different Mixing Types: (A) CRM and (B) PDM (Kim and Lee (2006)).
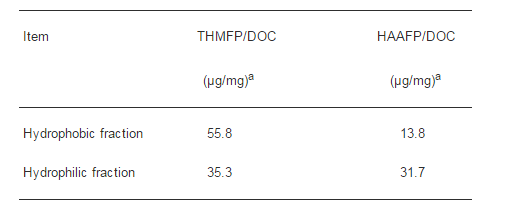
Conversely, a difference exists between the hydrophobic and hydrophilic fractions in the formation potentials of DBPs. That is, the formation potential of THMs is mainly influenced by the HBF, while HAAFP are more dependent on the HLF, as shown in Table 3. From the results shown in Fig. 14 and Table 3, no significant difference is observed in the removal of the HBF as the main contributor in the formation THMs between PDM and CRM, while PDM is a more effective process than CRM in the removal of the HLF as the main reactant in the formation of HAAs. Therefore, PDM is suggested as being an effective coagulation process (Zouboulis and Tzoupanos (2009)), for reducing the risk posed by DBPs, including HAAs (Kim and Lee (2006)).
Table 3: Dbps Formation Characteristic of the Hydrophobic And Hydrophilic Fractions Isolated from Raw Water (Kim and Lee (2006)).
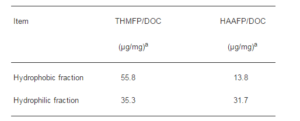
a Concentrations of THMs and HAAs produced to DOC of each NOM fraction in solution used for DBPFPs test, respectively.
On the other hand, the removal of NOM as DBP precursor by CC has been extensively studied. The most noticeable study is to evaluate and introduce the enhanced coagulation (EC) process (Ghernaout et al. (2009), Gerrity et al. (2009)), which is a treatment strategy for removing organic carbon, thereby controlling the formation of THMs and HAAs in drinking water systems (Edzwald and Tobiason (1999)). The work conducted by Gregor et al. (1997) is a good example for the EC, and they reported that adjusting the pH downwards to between 4 and 5 prior to coagulant addition will encourage the formation of soluble NOM—Al complex from low-turbidity waters. In case of most waters, therefore, acid must be added to maintain the desired coagulation pH for EC, and excess coagulant is required to improve the removal of OM. Since EC process produces very corrosive water for metals and concrete, it is necessary that the pH of settled water must be adjusted by alkali substance to prevent severe corrosion of submerged metals and concrete, and control high levels of dissolved Al (Kawamura (2000)). However, CC using in-line hydraulic jet mixer such as PDM is a reasonable method for the improvement of coagulation process compared to EC, since it is possible to obtain good removals of DOC as well as turbidity using a lower dosages of the coagulant without supplementary addition of chemicals for pH control, and thus producing a smaller volume of waste solids (Kim and Lee (2006)).
As shown by the results in Fig. 12, no significant difference in the removal of the
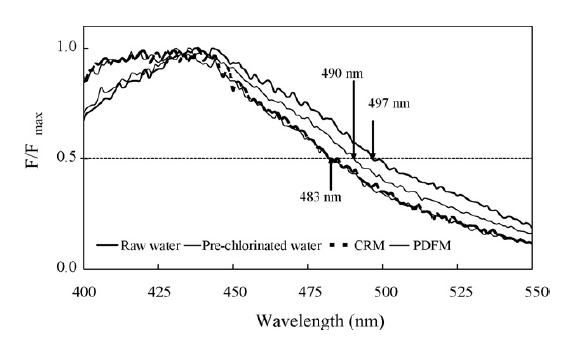
HBF is observed with the two different mixing types. However, since DBP formation is dependent on the structural and chemical characteristics, as well as the NOM content as a precursor, the effects of different mixing types for CC on the structural and chemical characteristics of the HBF in bulk NOM are investigated using fluorescence spectroscopy (Kim and Lee (2006)). Using the method of Fabbricino and Korshin (2004), the wavelength corresponding to the normalised emission band portion at the half-intensity (for wavelengths > maximum emission intensity (λmax)), as a representative parameter of the emission band, is employed. This parameter is denoted as λ0.5, and the wavelengths corresponding toλ0.5 are indicated by the arrows in Fig. 15. The λ0.5 value of hydrophobic NOM decreased by pre-chlorination, from 497 to 490 nm, and thereafter decreased to 483 nm, via CC, irrespective of the initial mixing type. It has been suggested that there is no significant difference between the different mixing types in relation to changes in the structural and chemical characteristics of the HBF in bulk NOM. The decrease in λ0.5 due to water treatment processes is likely to be associated with the breakdown of relatively large molecules of NOM into smaller fragments, where the fluorescence has been shown to exhibit a blue shift. According to Coble (1996), the blue shift, i.e. the emission shift towards a shorter wavelength, is caused by a reduction in the π-electron system, such as a decrease in the number of aromatic rings or conjugated bonds in a chain structure, or the conversion of a linear to a non-linear ring system. Consequently, the DBP formation potentials of hydrophobic NOM could be reduced by CC, independent of the initial mixing type, via a reduction in the reactivity and concentration of hydrophobic NOM, as the aromaticity and precursor content are closely related to the formation potential of DBPs derived from NOM (Kim and Lee (2006)).

Fig. 15. Shift in the Position of the Normalised Band at the Half-Intensity, Λ0.5 (Shown by Arrows), in the Normalised Emission Spectra of Hydrophobic NOM Isolated from Raw and Process Waters (Kim and Lee (2006)).
In addition, fluorescence spectroscopy is useful for NOM fingerprint characterisation, which is intended to provide a greater amount of qualitative as compared to quantitative information. Also, it is known that the formation potential of DBPs is influenced by the OM composition and water treatment method. Therefore, complicated extraction procedures can be sufficiently substituted by much simpler fluorescence spectroscopic methods to evaluate the removal characteristics of NOM components through water treatment processes, without the use of a dried extraction procedure (Kim and Lee (2006)).
Proposal for Coagulant Dosage Optimisation in Operating PDM
The jar-test has been conventionally performed for the determination of the optimal coagulant dosage in CC processes, but was not appropriate in the operation of PDM, as shown by the results in Fig. 13. Due to differences in the coagulation mechanism, the optimal coagulant dosages with the two initial mixing types are different. Because the coagulant dosage, as decided by the jar-test, is considered to cause overdosing with PDM, the introduction of a new method for coagulant dosage optimisation is considered necessary in the operation of PDM. In addition, diurnal and storm-related changes in raw water quality, time limit for jar-test, and broad range of coagulant chemicals are factors that caused difficulties in proper coagulation control. Therefore, charge detection is used as one of the new methods for coagulant dosage optimisation, and is also evaluated. The method is based on the stoichiometric reaction between oppositely charged polyelectrolytes, and the end point, where charge neutralisation occurred, determined using SPS. The optimisation of the coagulant dosage using the SPS over operation period is within the range 10.3—12.9 ppm (2.5—3.1 mg L-1 as Al2O3), which is lower than the dosage (15 ppm, 3.6 mg L-1 as Al2O3) found using the jar-test, as shown in Fig. 16. Though there are significant variations in raw water quality over operation period as shown in Table 1, residual turbidity of less than 0.5 NTU is obtained in the operation of PDM equipped with SPS. The PDM in combination with SPS could also effectively reduce the content of OM with relatively lower coagulant dosage. Therefore, new methods, such as SPS, should be considered for the detection of the optimal coagulant dosage point when operating PDM. This could also produce a smaller volume of waste solids, with the use of relatively lower coagulant doses, since PDM requires a lower coagulant dosage than CRM. For mechanical mixing such as CRM, moreover, the power requirement as common design parameter is a range of 0.85—1.0 horsepower (hp) per million gallons per day (mgd) (Kawamura (2000)), while the specific mixing power input (hp/mgd) of the hydraulic jet including PDM is constant for any plant capacity and is typically within a range of 0.1—0.2 hp/mgd (Clark et al. (1994)). It suggests that in-line hydraulic jet mixer such as PDM can reduce the energy waste (Kim and Lee (2006)).

Fig. 16. Comparison of Jar-Test and SPS for Decision of Optimal Coagulant Dosage (Kim and Lee (2006)).
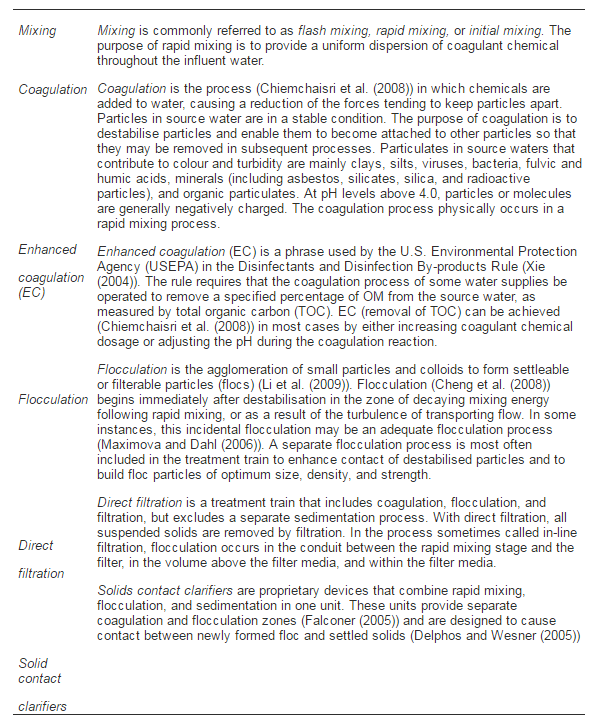
Mixing, Coagulation, and Flocculation
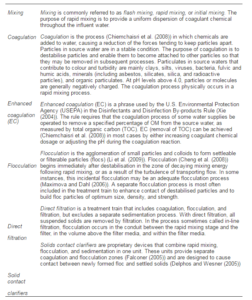
First, Table 4 presents some fundamental definitions which must be mentioned here (Li et al. (2009), Xie (2004), Delphos and Wesner (2005), Chiemchaisri et al. (2008), Cheng et al. (2008), Maximova and Dahl (2006), Falconer (2005)). As seen above, coagulation reactions (Ghafari et al. (2009)) occur rapidly, probably taking less than one second. Principal mechanisms that contribute to the removal of particulates, when coagulating chemicals such as alum or ferric chloride are mixed with water, include chemical precipitation, reduction of electrostatic forces that tend to keep particles apart, physical collisions between particles and particle bridging. Several factors affect the type and amount of coagulating chemicals required, including the nature (Ghernaout et al. (2010)) of suspended solids and the chemical characteristics of the influent water (Delphos and Wesner (2005)), Larue and Vorobiev (2003)).
Table 4: Definitions of Mixing, Coagulation, and Flocculation (Li Et Al. (2009), Xie (2004), Delphos and Wesner (2005), Chiemchaisri Et Al. (2008), Cheng Et Al. (2008), Maximova and Dahl (2006), Falconer (2005)).
6.1. Adjustment of pH
Control of pH and alkalinity is an essential aspect of coagulation. The optimum pH for coagulation varies but is generally within the following ranges for turbidity removal:
- Alum: pH 5.5 to 7.5 (typical pH 7.0);
- Ferric salts: pH 5.0 to 8.5 (typical pH 7.5) (Delphos and Wesner (2005)).
It can be necessary to adjust the pH of some source waters to achieve optimum coagulation. The pH is often lowered by adding carbon dioxide or an acid. Alum and ferric chloride consume alkalinity and can lower pH; however, reducing pH by adding more chemicals than is required for coagulation should be avoided as it increases overall chemical costs and sludge production/costs. In some source waters with low pH or low alkalinity, it may be necessary to add caustic soda or lime to raise pH and to offset the acidity of metal-ion coagulants, even in an EC mode of operation. For waters that require EC to remove OM, the pH of coagulation should be lowered as compared to coagulation for turbidity removal only. Typically, the optimum pH for organics’ removal with alum is between 6.0 and 6.5, and between 5.5 and 6.0 for ferric coagulants. Often, PACl can provide organics’ removal without as significant a decrease in pH (Delphos and Wesner (2005)), Wei et al. (2009)).
However, there are a number of secondary impacts of utilising the higher coagulant dosages and lower pH values for EC. A few of these impacts are summarised in Table 5.
Table 5: Secondary Impacts of Utilising the Higher Coagulant Dosages and Lower Ph Values for EC (Delphos and Wesner (2005)).
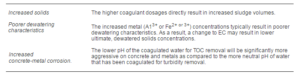
If pH is diminished to increase the coagulation efficiency, it is important to adjust the pH to provide less corrosive treated water (Alley (2007)). If the pH is lowered to improve coagulation (Eckenfelder (2000)) and organics’ removal, it is often recommended to readjust the pH after the filtration process as compared to pre-filtration. This is due to the fact that some OM may be adsorbed onto the floc that may carry over from the clarification process, and any pre-filtration pH adjustment may then result in the “release” of this OM, which could pass through the filters and contribute to subsequent DBP formation (Delphos and Wesner (2005)), Zhang et al. (2008)).
Design of Chemical Mixing
Chemical mixing (Weiner and Matthews (2003)) can be accomplished by several different types of equipment designed to mix the applied chemicals with the source water as quickly as possible. The intensity of agitation required for optimum rapid mixing and flocculation is measured by the G value (Shammas (2005)). The G value concept, developed by Camp and Stein (1943), is widely used in designing rapid mixing and flocculation processes (Alley (2007)) and is defined by the equation (Spellman (2008)):
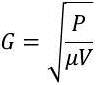 (1)
(1)
where
G = root-mean-square velocity gradient, or rate of change of velocity, s-1
P = power input, kg m2 s-3
μ = dynamic viscosity, kg m-1 s-1
V = volume, m3 (Shammas (2005), Delphos and Wesner (2005)).
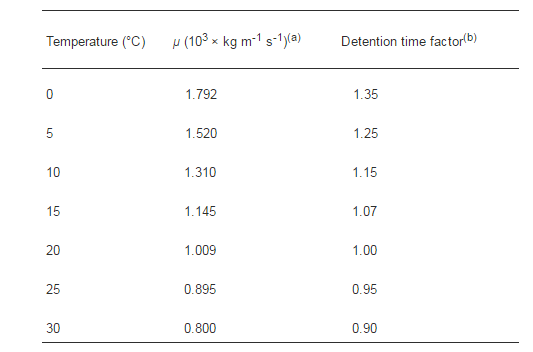
Equations are also available to calculate G for various types of mixing arrangements, and manufacturers of mixing and flocculation equipment provide information on G values for their equipment (Bridgeman et al. (2008)). Another parameter used in designing mixing systems is Gt, which is the dimensionless product of G and detention time t in s. Rapid mix and flocculation systems design (Thomas et al. (1999)) are temperature-dependent because water viscosity varies with temperature, as shown in Table 6(a). Guidelines for adjusting detention times in both rapid mix and flocculation basins are shown in Table 6(b) (Delphos and Wesner (2005), Atkinson et al. (2005), Yoon and Deng (2004), Prat and Ducoste (2007)).
Table 6: Water Viscosity and Water Temperature (A) And Guidelines for Mixer Detention Times (B) (Delphos and Wesner (2005)).

Coagulant chemicals (Spellman (2008), Owen et al. (2008)) can be mixed by several methods, including:
– Mechanical devices in a dedicated basin,
– In-line blenders,
– Hydraulic methods,
– Air mixing,
– Induction mixing (Shammas (2005), Delphos and Wesner (2005), Weiner and Matthews (2003), Spellman (2008), Atkinson et al. (2005), Thakur et al. (2003), Byun et al. (2005)).
The Future of Coagulation/Flocculation
Coagulation (Byun et al. (2005), Moussas and Zouboulis (2008)) is a universal process for treating drinking water. It has been traditionally considered to be not only an economical but also a cost-saving technique. Even though there are many state-of-art techniques for removing unwanted particles, NOM and infectious microorganisms in water, coagulation accompanied by settling plays a crucial role. Up to now, many studies have focused on determining the optimal conditions for coagulation such as the mixing intensity, pH and the dominant mechanisms for efficient performance (Rossini et al. (1999), Committee report (1979), Van Benschoten and Edzwald (1990), Lu et al. (1999)). Among those endeavors, coagulant mixing has been a major focus. Various types of rapid mixing have been developed. These include mechanical mixing, which is conventionally used for coagulant mixing in water treatment (Amirtharajah and Mills (1982)), diffusion mixing by a pressured water jet, in-line static mixing (Thakur et al. (2003)), in-line mechanical mixing, hydraulic mixing and mechanical flash mixing (Byun et al. (2005)). Among these, the types of in-line mixing have been of interest due to the advantages of effective coagulation, and the cost-saving characteristics of power consumption (Byun et al. (2005)). The design criteria or velocity gradient are also examined in an instantaneous inline blender and a turbulent pipe-flow (Byun et al. (2005)). This trend is attributed to the fact that fast and instantaneous mixing within microseconds is more favourable for an aluminium based coagulant to be dispersed and attached to the target particles and organics. Once an aluminium-based coagulant is added to water, it undergoes many chemical reactions (Byun et al. (2005)).
Coagulation studies have shown that both charge neutralisation and sweep coagulation including entrapment or bridge formation are the major coagulation mechanisms (Xiao et al. (2008)). Of these, charge neutralisation is the most preferred economically and environmentally because it enables the coagulant dosage to be minimised and reduces the residual aluminium in water. Charge neutralisation (Sun et al. (2008)) can be achieved by two physical methods, namely, pH or mixing control of the coagulant. However, pH control is nearly not preferable due to the difficulty associated with the direct application in water treatment. As an alternative, sweep coagulation is usually in practice, in which the OM and colloids are agglomerated with the precipitating aluminium hydroxide (Al(OH)3(s)). Hence, a higher coagulant dosage than needed for charge neutralisation is required. An instantaneous condition within 1 s using coagulant mixing is essential to control the coagulation process at the charge neutralisation step. Although charge neutralisation (Jarvis et al. (2006)) by pH control has been reported, there are few studies on the effect of charge neutralisation accomplished by instantaneous mixing particularly those on the removal efficiency of turbidity and DOC (Ghernaout et al. (2010)). In addition, PACl has had wider use in water treatment as a coagulant than alum (Wu et al. (2008)) on account of its ease in handling. Unfortunately, in case using a PACl coagulant, charge neutralisation is more difficult to control due to the polymeric characteristics of the PACl (Van Benschoten and Edzwald (1990)). Therefore, sweep coagulation is a more dominant process control method in that case (Byun et al. (2005), Graham et al. (2008)).
The Concept of Ultraflocculation
In a conventional flocculation process, the (destabilised) particles are treated by a gentle mixing (average velocity gradient: 20 s-1 < G < 70 s-1). Although some systems can be operated with as little as 10 min of treatment time, others may require up to 1 h. The average is probably about 30 min (Maes et al. (2003)). Young et al. (2000) studied the effect of mixing on the kinetics of polymer aided flocculation of a kaolin suspension of 20 mg L-1, which was destabilised by 5 mg L-1 alum. For a flocculation time of 30 min, they found that the optimum G values occurred at 70—100 s-1, and the critical mixing rate occurred at 400 s-1, beyond which significant floc break-up occurred (Maes et al. (2003)).
When suspensions containing a low sorbent concentration are treated by this conventional flocculation process, a large treatment time and sedimentation time is needed. Large water treatment installations would be necessary. In this case, ultraflocculation is an alternative to treat a suspension containing a low concentration of hydrophobic sorbent particles (Rulyov (1999)). Ultraflocculation is a process by which a suspension of particles, to which a flocculant is added, is treated in an intense hydrodynamic field (G > 103 s-1) for a short time period. Compared to conventional flocculation, the intensity of the hydrodynamic field applied in ultraflocculation is much larger, while the time period in which the suspension is treated is much shorter (Maes et al. (2003)).
Finally, the increase of the amount of coagulant may lead to an increase of the residual metal (Al/Fe) in drinking water. Some studies (Divakaran and Pillai (2001)) have discovered a number of snags concerning the use of alum salts, for example Alzheimer’s disease and other related problems associated with residual alum in treated water (Oladoja and Aliu (2009)).
Conclusions
The main conclusions withdrawn from this review are as follows:
- A coagulation process using hydrolysable metal salts (HMS) such as alum is commonly involved in many fields, such as environmental engineering and separation processes. Generally, coagulation mechanisms using HMS are divided into double-layer compression, charge neutralisation, and enmeshment (or sweep coagulation). The positively charged hydrolysed metal species destabilise the negatively charged contaminants in the solution, leading to charge neutralisation. The enmeshment is generally viewed as the process in which amorphous flocs adsorb and/or enmesh unsettled particles. Destabilisation by double-layer compression, however, is not a practical method for a water treatment plant using HMS as coagulant, because the salt concentrations required for destabilisation by double-layer compression may approach that of seawater. As the concentration of HMS increases, flocs are formed and thus enmeshment occurs.
- In many of the conventional WTPs, the coagulant mixing is typically performed in a concrete basin with a mechanical mixer, and requires about 1—2 min of retention time. Mechanical mixing with a longer retention time cannot guarantee an instantaneous and uniform coagulant dispersion. For this reason, the so-called PDM has been proposed. PDM is a reasonable method and also has the potential to solve problems, such as noise, energy waste, and high maintenance cost, related with the use of a mechanical mixer. Using various rapid mixing devices to test the sedimentation performance, it was shown that in-line hydraulic jet and static mixers were able to achieve performance equivalent to that of the mechanical mixing type at a lower coagulant dosage. Manufacturers have suggested the pressurised/main inlet water flow-rate ratio (pumping rate) as the most important parameter. It was recommended that the flow-rate ratio should be in the range of 8—10% in order to guarantee uniform coagulant dispersion in PDM. Recently, the PDM has been introduced for the rapid and complete dispersion of a coagulant within a second before the metal hydroxide precipitate has been formed. The PDM is an effective device for the quick dispersion of hydrolysing metal salts.
- Because the jar-test technique, which has been used to determine the minimal coagulant concentration, and the residual turbidity of the water uses mixing device with back mixing type, it is suggested that this could involve the problem caused by the use of excess coagulant with the operation of the in-line initial mixing. Since the important operation aspect of the in-line initial mixing process is the application of the correct quantities to changing raw water quality, a monitor system using PDA has been tried to determine the chemical dosage in coagulation process. However, PDA technique as well as zeta potential measurement, which requires a relatively long time for responding, is not feasible for determining the optimal coagulant dosage with real-time because influent turbidities and the coagulant demands are quite time-variant. From this reason, streaming current (i.e. streaming potential) detector units have improved on the zeta potential measurement and appear to be successful in coagulant control.
- Better sedimentation performance with the use of an in-line initial mixer may favourably influence the removal of NOM as well as the turbidity in a coagulation/sedimentation process, and the composition and characteristic of NOM could also be influenced by different initial mixing types. In addition, since the formation potential of DBPs is influenced by the OM composition and water treatment method, the molecular structure of NOM is one of the main characteristics studied for the control of DBPs. The composition of NOM can be investigated by numerous methods, including physicochemical fractionation and spectroscopic measurements. NOM fractionation, using adsorption resins, is generally considered a state-of-art method, which is used to estimate the behaviours and properties of NOM from various sources. A method for measuring the spectra of NOM using fluorescence spectroscopy is also largely accepted as an adequate method for the qualitative characterisation of NOM.
- For coagulation/flocculation processes, we have more pronounced tendencies to in-line coagulation andultraflocculation designs, both of them are energetically intense and extremely short as compared to conventional coagulation and flocculation tanks. The next generation of coagulation/flocculation devices would be more efficient and more space and energy saving.
References
Alley, E.R. (2007). “Water Quality Control Handbook,” 2nd ed., McGraw-Hill, NY, USA.
Publisher – Google Scholar
Amirtharajah, A. (1981). ‘Initial Mixing: Coagulation and Filtration: Back to the Basics,’ in: Proceedings of Am. Water Works Assoc., Denver, USA.
Google Scholar
Amirtharajah, A. & Mills, P. (1982). ‘Rapid Mix Design for Alum Coagulation,’ J. Am. Water Works Assoc. (74) 210-216.
Asano, T., Burton, F.L., Leverenz, H.L., Tsuchihashi, R. & Tchobanoglous, G. (2007). “Water Reuse, Issues, Technologies, and Applications,” McGraw-Hill, NY, USA.
Publisher – Google Scholar
Atkinson, J.F., Chakraborti, R.K. & Van Benschoten, J.E. (2005). “Effects of Floc Size and Shape in Particle Aggregation (ch. 5).“ In: Droppo, I.G., Leppard, G.G., Liss, S.N., Milligan, T.G. (Eds.). “Flocculation in Natural and Engineered Environmental Systems,” CRC press, Boca Raton, FL, USA.
Google Scholar
Baalousha, M. (2009). “Aggregation and Disaggregation of Iron Oxide Nanoparticles: Influence of Particle Concentration, Ph and Natural Organic Matter,” Science of the Total Environment. (407) 2093-2101.
Publisher – Google Scholar
Barany, S. & Szepesszentgyörgyi, A. (2004). “Flocculation of Cellular Suspensions by Polyelectrolytes,” Advances in Colloid and Interface Science. (111) 117-129.
Publisher – Google Scholar
Barbot, E., Moustier, S., Bottero, J.Y. & Moulin, P. (2008). “Coagulation and ultrafiltration: Understanding of the Key Parameters of the Hybrid Process,” Journal of Membrane Science. (325) 520-527.
Publisher – Google Scholar
Bridgeman, J., Jefferson, B. & Parsons, S. (2008). “Assessing Floc Strength Using CFD to Improve Organics Removal,”Chemical Engineering Research and Design (86) 941-950.
Publisher – Google Scholar
Bull, R.J. & Kopfler, F.C. (1991). “Health Effects of Disinfectants and Disinfection By-Products,” Am. Water Works Assoc. Research Foundation, Denver, USA.
Publisher – Google Scholar
Byun, S., Oh, J., Lee, B.-Y. & Lee, S. (2005). “Improvement of Coagulation Efficiency Using Instantaneous Flash Mixer (IFM) for Water Treatment,” Colloids and Surfaces A: Physicochemical and Engineering Aspects (268) 104-110.
Publisher – Google Scholar
Cabaniss, S.E. & Shuman, M.S. (1988). “Copper Binding by Dissolved Organic Matter:I. Suwannee River Fulvic Acid Equilibria,” Geochimica et Cosmochimica Acta (52) 185-193.
Publisher – Google Scholar
Camp, T.R. & Stein, P.C. (1943). “Velocity Gradients and Internal Work in Fluid Motion,” Journal of the Boston Society of Civil Engineers. (30) 219-237.
Publisher – Google Scholar
Chang, C.-Y., Hsu, Y.-H., Lin, Y.-M., Hu, P.-Y., Liu, C.-C. & Wang, K.-H. (2001). “The Organic Precursors Affecting the Formation of Disinfection By-Products with Chlorine Dioxide,” Chemosphere (44) 1153-1158.
Publisher – Google Scholar
Cheng, W.P., Kao, Y.P. & Yu, R.F. (2008). “A Novel Method for On-Line Evaluation of Floc Size in Coagulation Process,”Water Research. 42 (2008) 2691-2697.
Publisher – Google Scholar
Cheremisinoff, N.P. (2002). “Handbook of Water and Wastewater Treatment Technologies,” Butterworth-Heinemann, Boston, USA.
Publisher – Google Scholar
Chiemchaisri, C., Passananon, S., Ngo, H.H. & Vigneswaran, S. (2008). “Enhanced Natural Organic Matter Removal in Floating Media Filter Coupled with Microfiltration Membrane for River Water Treatment,” Desalination (234) 335-343.
Publisher – Google Scholar
Choi, Y.H., Kim, H.S. & Kweon, J.H. (2008). “Role of Hydrophobic Natural Organic Matter Flocs on the Fouling in Coagulation-Membrane Processes,” Separation and Purification Technology. (62) 529-534.
Publisher – Google Scholar
Clark, M.M., Srivastava, R.M., Lang, R.R., Trussell, R.R., Mc-Collum, L.J., Bailey, D., Christie, J.D. & Stolarik, G. (1994). ‘Selection and Design of Mixing Processes for Coagulation,’ Denver: American Water Works Association. Research Foundation.
Google Scholar
Coble, P.G. (1996). “Characterization of Marine and Terrestrial DOM in Seawater Using Excitation—Emission Matrix Spectroscopy,” Marine Chemistry. (51) 325-346.
Publisher – Google Scholar
Committee report, (1979). ‘Organics Removal by Coagulation: A Review and Research Needs,’ Journal American Water Works Association. (71) 588-603.
De Zuane, J. (1997). “Handbook of Drinking Water Quality,” 2nd ed., Wiley, NY, USA.
Publisher – Google Scholar
Deangelo, A.B. & McMillan, L.P. (1988). ‘The Carcinogenicity of the Chlorinated Acetic Acids,’ USEPA, Health Effect Research Laboratory, Cincinnati, USA.
Delphos, P.J. & Wesner, G.M. (2005). ‘Mixing, Coagulation, and Flocculation (ch. 6),’ Water Treatment Plant Design, Am. Water Works Assoc./ASCE, (E.E. Baruth, Tech. Ed.). “ 4th ed., McGraw-Hill, NY, USA.
Google Scholar
Divakaran, R. & Pillai, V.N.S. (2001). “Flocculation of Kaolinite Suspension in Water by Chitosan,” Water Research. 35 (2001) 3904-3908.
Publisher – Google Scholar
Eckenfelder, Jr., W.W. (2000). ‘Industrial Water Pollution Control,’ 3rd ed., McGraw-Hill, NY, USA.
Google Scholar
Edzwald, J.K. & Tobiason, J.E. (1999). “Enhanced Coagulation: US Requirements and a Broader View,” Water Science and Technology. (40) 63-70.
Publisher – Google Scholar
Fabbricino, M. & Korshin, G.V. (2004). “Probing the Mechanisms of NOM Chlorination Using Fluorescence: Formation of Disinfection By-Products in Alento River Water,” Water Sci. Technol.: Water Supply (4) 227-233.
Publisher – Google Scholar
Falconer, I.R. (2005). ‘Cyanobacterial Toxins of Drinking Water Supplies, Cylindrospermopsins and Microcystins,’ CRC press, Boca Raton, FL, USA.
Gerrity, D., Mayer, B., Ryu, H., Crittenden, J. & Abbaszadegan, M. (2009). “A Comparison of Pilot-Scale Photocatalysis and Enhanced Coagulation for Disinfection Byproduct Mitigation,” Water Research. (43) 1597-1610.
Publisher – Google Scholar
Ghafari, S., Abdul Aziz, H., Isa & M.H., Zinatizadeh, A.A. (2009). “Application of Response Surface Methodology (RSM) To Optimize Coagulation—Flocculation Treatment of Leachate Using Poly-Aluminum Chloride (PAC) and Alum,” Journal of Hazardous Materials. (163) 650-656.
Publisher – Google Scholar
Ghernaout, D. (2013). “The Best Available Technology of Water/Wastewater Treatment and Seawater Desalination: Simulation of the Open Sky Seawater Distillation,” Green and Sustainable Chemistry. (3) 68-88.
Publisher – Google Scholar
Ghernaout, D. (2014). “The Hydrophilic/Hydrophobic Ratio vs. Dissolved Organics Removal by Coagulation – A Review,”Journal of King Saud University – Science. (26) 169-180.
Publisher – Google Scholar
Ghernaout, D. & Ghernaout, B. (2012). “Sweep Flocculation as a Second form of Charge Neutralisation–A Review,”Desalination and Water Treatment. (44) 15-28.
Publisher – Google Scholar
Ghernaout, D., Ghernaout, B. & Kellil, A. (2009). “Natural Organic Matter Removal and Enhanced Coagulation as a Link between Coagulation and Electrocoagulation,” Desalination and Water Treatment. (2) 203-222.
Publisher – Google Scholar
Ghernaout, D., Ghernaout, B. & Naceur, M.W. (2011). “Embodying the Chemical Water Treatment in the Green Chemistry–A Review,” Desalination (271) 1-10.
Publisher – Google Scholar
Ghernaout, B., Ghernaout, D. & Saiba, A. (2010). “Algae and Cyanotoxins Removal by Coagulation/Flocculation: A Review,” Desalination and Water Treatment. (20) 133-143.
Publisher – Google Scholar
Ghernaout, D. & Naceur, M.W. (2011). “Ferrate(VI): In Situ Generation and Water Treatment — A Review,” Desalination and Water Treatment. (30) 319-332.
Publisher – Google Scholar
Goula, A.M., Kostoglou, M., Karapantsios, T.D. & Zouboulis, A.I. (2008). “A CFD Methodology for the Design of Sedimentation Tanks in Potable Water Treatment Case Study: The Influence of a Feed Flow Control Baffle,” Chemical Engineering Journal. (140) 110-121.
Publisher – Google Scholar
Graham, N., Gang, F., Fowler, G. & Watts, M. (2008). “Characterisation and Coagulation Performance of a Tannin-Based Cationic Polymer: A Preliminary Assessment,” Colloids and Surfaces A: Physicochemical and Engineering Aspects(327) 9-16.
Publisher – Google Scholar
Gray, N.F. (2005). “Water Technology, an Introduction for Environmental Scientists and Engineers,” 2nd ed., Elsevier, Amsterdam, The Netherlands.
Publisher – Google Scholar
Gregor, J.E., Nokes, C.J. & Fenton, E. (1997). “Optimising Natural Organic Matter Removal from Low Turbidity Waters by Controlled Ph Adjustment of Aluminium Coagulation,” Water Research. 31 (31) 2949-2958.
Publisher – Google Scholar
Gregory, J. (2006). “Floc Formation and Floc Structure,’ (ch. 3). “In: Interface science in drinking water treatment, theory and applications (Eds. G. Newcombe, D. Dixon). “In: Interface science and technology (vol. 10, Series Ed. A. Hubbard). “ Elsevier, Amsterdam, The Netherlands.
Google Scholar
Huang, C. & Liu, C.-B. (1996). “Automatic Control for Chemical Dosing in Laboratory-Scale Coagulation Process by Using an Optical Monitor,” Water Research. (30) 1924-1929.
Publisher – Google Scholar
Hudson, H.E. & Wolfner, J.P. (1967). ‘Design of Mixing and Sedimentation Basins,’ Journal of American Water Works Association. (59) 1257-1268.
Google Scholar
Jarvis, P., Jefferson, B. & Parsons, S.A. (2006). “Floc Structural Characteristics Using Conventional Coagulation for a High Doc, Low Alkalinity Surface Water Source,” Water Research. (40) 2727-2737.
Publisher – Google Scholar
Kam, S.-K. & Gregory, J. (2001). “The Interaction of Humic Substances with Cationic Polyelectrolytes,” Water Research. (35) 3557-3566.
Publisher – Google Scholar
Kawamura, S. (2000). “Integrated Design and Operation of Water Treatment Facilities,” 2nd ed., Wiley, NY, USA.
Publisher – Google Scholar
Khan, E., Babcock, R.W., Suffet, I.H. & Stenstorm, M.K. (1998). “Biodegradable Dissolved Organic Carbon for Indication Wastewater Reclamation Plant Performance and Treated Wastewater Quality,” Water Environment Research. (70) 1033-1040.
Publisher – Google Scholar
Kim, H.C. & Lee, S. (2006). “Pump Diffusion Flash Mixing (PDFM) for Improving Coagulation Process in Drinking Water Treatment,” Sep. Purif. Technol. (52) 117-125.
Publisher – Google Scholar
Kim, H.C., Oh, H.K., Ahn, S.K., Yu, M.J. & Bang, K.W. (2004). ‘Characterization of Natural Organic Matter in Conventional Water Treatment Processes for Han River Water to Monitor and Control DBPs,’ in: Proceedings of IWA World Water Congress and Exhibition, Marrakech, Morocco.
Google Scholar
‘Kurita Handbook of Water Treatment,’ (1999). “2nd English ed., Kurita water industries ltd., Tokyo, Japan.
Google Scholar
Larue, O. & Vorobiev, E. (2003). “Floc Size Estimation in Iron Induced Electrocoagulation and Coagulation Using Sedimentation Data,” International Journal of Mineral Processing. 71 (2003) 1-15.
Publisher – Google Scholar
Letterman, R.D., Amirtharajah, A. & O’Melia, C.R. (1999). ‘Coagulation and Flocculation in Water Quality and Treatment,’ 5th ed., McGraw-Hill, NY, USA.
Li, T., Yan, X., Wang, D. & Wang, F. (2009). “Impact of Preozonation on the Performance of Coagulated Flocs,”Chemosphere (75) 187-192.
Publisher – Google Scholar
Lin, J.-L., Huang, C., Chin, C.-J.M. & Pan, J.R. (2008). “Coagulation Dynamics of Fractal Flocs Induced by Enmeshment and Electrostatic Patch Mechanisms,” Water Research. (42) 4457-4466.
Publisher – Google Scholar
Listiarini, K., Sun, D.D. & Leckie, J.O. (2009). “Organic Fouling of Nanofiltration Membranes: Evaluating the Effects of Humic Acid, Calcium, Alum Coagulant and Their Combinations on the Specific Cake Resistance,” J. Membr. Sci. (332) 56-62.
Publisher – Google Scholar
Lu, X.Q., Chen, Z. & Yang, X. (1999). “Spectroscopic Study of Aluminum Speciation in Removing Humic Substances by Al Coagulation,” Water Research. (33) 3271-3280.
Publisher – Google Scholar
Ma, H., Allen, H.E. & Yin, Y. (2001). “Characterization of Isolated Fractions of Dissolved Organic Matter from Natural Waters and a Wastewater Effluent,” Water Research. (35) 985-996.
Publisher – Google Scholar
Maes, A., Vreysen, S. & Rulyov, N.N. (2003). “Effect of Various Parameters on the Ultraflocculation of Fine Sorbent Particles, Used in the Wastewater Purification from Organic Contaminants,” Water Research. (37) 2090-2096.
Publisher – Google Scholar
Mavros, P. (2001). “Flow Visualization in Stirred Vessels: A Review of Experimental Techniques,” Chemical Engineering Research and Design 79 Part A 113-127.
Publisher – Google Scholar
Maximova, N. & Dahl, O. (2006). “Environmental Implications of Aggregation Phenomena: Current Understanding,”Current Opinion in Colloid & Interface Science. (11) 246-266.
Publisher – Google Scholar
McCurdy, K. Carlson, D. & Gregory, D. (2004). “Floc Morphology and Cyclic Shearing Recovery: Comparison of Alum and Polyaluminum Chloride Coagulants,” Water Research. (38) 486-494.
Publisher – Google Scholar
Moussas, P.A. & Zouboulis, A.I. (2008). “A Study on the Properties and Coagulation Behaviour of Modified Inorganic Polymeric Coagulant–Polyferric Silicate Sulphate (PFSiS),” Separation and Purification Technology. (63) 475-483.
Publisher – Google Scholar
Nason, J.A. & Lawler, D.F. (2009). “Particle Size Distribution Dynamics during Precipitative Softening: Declining Solution Composition,” Water Research. (43) 303-312.
Publisher – Google Scholar
O’connor, J.T., O’connor, T. & Twait, R. (2009). “Water Treatment Plant Performance Evaluations and Operations,” Wiley, NY, USA.
Publisher – Google Scholar
Oh, J.-I. & Lee, S. (2005). “Influence of Streaming Potential on Flux Decline of Microfiltration with In-Line Rapid Pre-Coagulation Process for Drinking Water Production,” Journal of Membrane Science. (254) 39-47.
Publisher – Google Scholar
Oladoja, N.A. & Aliu, Y.D. (2009). “Snail Shell as Coagulant Aid in the Alum Precipitation of Malachite Green from Aqua System,” Journal of Hazardous Materials. (164) 1496-1502.
Publisher – Google Scholar
Owen, A.T., Fawell, P.D., Swift, J.D., Labbett, D.M., Benn, F.A. & Farrow, J.B. (2008). “Using Turbulent Pipe Flow to Study the Factors Affecting Polymer-Bridging Flocculation of Mineral Systems,” International Journal of Mineral Processing. (87) 90-99.
Publisher – Google Scholar
Park, Y.O., Park, N.S., Kim, K.D., Lim, K.H. & Wang, C.K. (2009). “Characteristics of Coagulants Dispersion in Full-Scale Pump Diffusion Mixers,” Environmental Engineering Science. (26) 1-6.
Publisher – Google Scholar
Parsons, S.A. & Jefferson, B. (2006). “Introduction to Potable Water Treatment Processes,” Blackwell Publishing, Oxford, UK.
Publisher – Google Scholar
Parsons, S.A., Jefferson, B., Goslan, E.H., Jarvis, P.R. & Fearing, D.A. (2004). ‘NOM-the Relationship between Character and Treatability,’ IWA World Water Congress and Exhibition, Marrakech, Morocco.
Google Scholar
Pashley, R.M. & Karaman, M.E. (2004). “Applied Colloid and Surface Chemistry,” Wiley, NY, US .
Publisher – Google Scholar
Peuravuori, J., Koivikko, R. & Pihlaja, K. (2002). “Characterization, Differentiation and Classification of Aquatic Humic Matter Separated with Different Sorbents: Synchronous Scanning Fluorescence Spectroscopy,” Water Research. (36) 4552-4562.
Publisher – Google Scholar
Prat, O.P. & Ducoste, J.J. (2007). “Simulation of Flocculation in Stirred Vessels Lagrangian versus Eulerian,” Chemical Engineering Research and Design (85 Part A) 207-219.
Publisher – Google Scholar
Rossini, M., Garrido, J.G. & Galluzzo, M. (1999). “Optimization of the Coagulation-Flocculation Treatment: Influence of Rapid Mix Parameters,” Water Research. (33) 1817-1826.
Publisher – Google Scholar
Rulyov, N.N. (1999). “Application of Ultra-Flocculation and Turbulent Micro-Flotation to the Removal of Fine Contaminants from Water,” Colloids and Surfaces A: Physicochemical and Engineering Aspects (151) 283-291.
Publisher – Google Scholar
Schäfer, A.I. (2001). “Natural Organics Removal Using Membranes, Principles, Performance and Cost, Technomic,”Lancaster-Basel, Switzerland.
Publisher – Google Scholar
Shammas, N.K. (2005). “Coagulation and Flocculation,” In: Physicochemical Treatment Processes (vol. 3). “ Handbook of environmental engineering (Eds. L.K. Wang, Y.-T. Hung, N.K. Shammas). Humana Press, Totowa, NJ, USA.
Publisher – Google Scholar
Smith, Jr. J.E., Renner, R.C., Hegg, B.A. & Bender, J.H. (1991). “Upgrading Existing or Designing New Drinking Water Treatment Facilities,” Noyes Data Corporation, Park Ridge, NJ, USA.
Publisher – Google Scholar
Spellman, F.R. (2008). “The Science of Water, Concepts and Applications,” 2nd ed., CRC press, Boca Raton, FL, USA.
Publisher – Google Scholar
Sun, H., Hankins, N.P., Azzopardi, B.J., Hilal, N. & Almeida, C.A.P. (2008). “A Pilot-Plant Study of the Adsorptive Micellar Flocculation Process: Optimum Design and Operation,” Separation and Purification Technology. (62) 273-280.
Publisher – Google Scholar
Thakur, R.K., Vial, C., Nigam, K.D.P., Nauman, E.B. & Djelveh, G. (2003). “Static Mixers in the Process Industries-A Review,” Chemical Engineering Research and Design (81 Part A) 787-826.
Publisher – Google Scholar
Thomas, D.N., Judd, S.J. & Fawcett, N. (1999). “Flocculation Modelling: A Review,” Water Research. (33) 1579-1592.
Publisher – Google Scholar
Thurman, E.M. & Malcolm, R.L. (1981). “Preparative Isolation of Aquatic Humic Substances,” Environmental Science & Technology. (15) 463-466.
Publisher – Google Scholar
USEPA, (1999). ‘Enhanced Coagulation, Enhanced Precipitative Softening Guidance Manual,’ Office of Water (4607). “ EPA 815-R-99-012, USA.
Van Benschoten, J.E. & Edzwald, J.K. (1990). “Chemical Aspects of Coagulation Using Aluminum Salts——I. Hydrolytic Reactions of Alum and Polyaluminum Chloride,” Water Research. (24) 1519-1526.
Publisher – Google Scholar
Vrale, L. & Jorden, R.M. (1971). “Rapid Mixing in Water Treatment,” American Water Works Association. (63) 52-58.
Publisher – Google Scholar
Wang, J. & Wang, X. (2006). “Ultrafiltration with in-line Coagulation for the Removal of Natural Humic Acid and Membrane Fouling Mechanism,” Journal of Environmental Sciences. (18) 880-884.
Publisher – Google Scholar
Wei, J., Gao, B., Yue, Q., Wang, Y., Li, W. & Zhu, X. (2009). “Comparison of Coagulation Behavior and Floc Structure Characteristic of Different Polyferric-Cationic Polymer Dual-Coagulants in Humic Acid Solution,” Water Research. (43) 724-732.
Publisher – Google Scholar
Weiner, R.E. & Matthews, R.A. (2003). “Environmental Engineering, 4th ed.,” Butterworth-Heinemann, Amsterdam, The Netherlands.
Publisher – Google Scholar
Worrall, F. & Burt, T.P. (2009). “Changes in DOC Treatability: Indications of Compositional Changes in DOC Trends,”Journal of Hydrology. (366) 1-8.
Publisher – Google Scholar
Xiao, F., Huang, J.-C.H., Zhang, B. & Cui, C. (2009). “Effects of Low Temperature on Coagulation Kinetics and Floc Surface Morphology Using Alum,” Desalination (237) 201-213.
Publisher – Google Scholar
Xiao, F., Zhang, X. & Lee, C. (2008). “Is Electrophoretic Mobility Determination Meaningful for Aluminum(III) Coagulation of Kaolinite Suspension?,” Journal of Colloid and Interface Science. (327) 348-353.
Publisher – Google Scholar
Xie, Y.F. (2004). “Disinfection by-products in Drinking Water, Formation, Analysis, and Control,” CRC press, Boca Raton, FL, USA.
Publisher – Google Scholar
Yoon, S.-Y. & Deng, Y. (2004). “Flocculation and Reflocculation of Clay Suspension by Different Polymer Systems under Turbulent Conditions,” Journal of Colloid and Interface Science. (278) 139-145.
Publisher – Google Scholar
Yoon, T.I. & Kim, C.G. (2008). “Case Studies on Rapid Coagulation Processes to Cope with Total Emission Controls,”Desalination (231) 290-296.
Publisher – Google Scholar
Young, S., Stanley, S.J. & Smith, D.W. (2000). “Effect of Mixing on the Kinetics of Polymer-Aided Flocculation,” J. Water Supply Res. (49) 1-8.
Publisher – Google Scholar
Yu, W., Li, G., Xu, Y. & Yang, X. (2009). “Breakage and re-growth of Flocs Formed by Alum and PACl,” Powder Technology. (189) 439-443.
Publisher – Google Scholar
Zhang, P., Wu, Z., Zhang, G., Zeng, G., Zhang, H., Li, J., Song, X. & Dong, J. (2008). “Coagulation Characteristics of Polyaluminum Chlorides PAC-Al30 on Humic Acid Removal from Water,” Separation and Purification Technology. (63) 642-647.
Publisher – Google Scholar
Zouboulis, A.I. & Tzoupanos, N.D. (2009). “Polyaluminium Silicate Chloride–A Systematic Study for the Preparation and Application of an Efficient Coagulant for Water or Wastewater Treatment,” J. Hazard. Mater. (162) 1379-1389.
Publisher – Google Scholar