Introduction
Most studies aim to find ways to improve students’ mathematics achievement and instill positive attitudes as students face numerous difficulties in mathematics (Jones, 2000; Power, 2001; Wisenbaker, Scott, & Fadia, 1999). There is a need to create a positive environment in learning mathematics with the use of technology (Lee, 2004). Various instructional approaches have been widely adopted in teaching and learning mathematics. These include approaches using various technologies such as videos learning (Esteban, Gonzalez, & Tejero, 2000), computer algebra system Mathcad (Zand & Crowe, 2001), wiki-based website (Peterson, 2009) and World Wide Web (WWW) (Schwarz & Sutherland, 1997; West & Ogden, 1998). As found in various studies that the graphing calculator (GC), one of the handheld technological tools benefited students and educators in teaching and learning algebra and calculus. The GC is one of the new technological devices that could act as an ICT in teaching and learning, especially in mathematics. It is a purpose built handheld mathematical computer that draws and analyses graphs, computes the values of mathematical expressions, solves equations, performs symbolic manipulation, performs statistical analyses, is programmable, and communicates information between devices (P. Jones, 2003). The benefits include: improved students’ mathematics achievement and attitude (Heller, Curtis, Jaffe, & Verboncoeur, 2005; Noraini, 2006; Tan, 2012; Tan, Madhubala, & Lau, 2011) and enhanced students’ conceptual understanding (Heller et al., 2005; Lim & Kor, 2004; Wasike, 2006). Spinato (2011) too found that GC was most effective in the areas of initiating a strategy and monitoring and it had a positive impact upon students’ reasoning skills, especially when it was used together with the analytic approach during both instruction and testing. In addition, GCs provided quality answers in a shorter time period, which saved tedious computational tasks (Oldknow, 1999; Shore, 1999; Sundram, 2008), and encouraged enjoyment, fun and active participation among students when performing mathematical tasks (Moreno-Armella & Cinvestar, 1999). However, the adoption of the handheld technology instruction in Malaysian higher learning institutions and in the subject of Probability appears limited. It was found that most of the previous studies were conducted in Calculus and Algebra, and none in Probability. In addition, Probability – one of the mathematics subjects which cover topics such as Random Variables, Binomial Distribution, Poisson Distribution, Normal Distribution, etc. – is important and applies to our daily lives. Among others, it features prominently in games, in data processing, in social sciences, and in natural sciences (John, 2004; Nasir, 1997). The National Council of Teachers Mathematics (NCTM, 2000) recognizes the importance of probability in the Standards for School Mathematics; as the knowledge about data analysis and the related aspects of probability will help students to reason statistically. Hence, the main purpose of this research is to examine students’ perceptions of the adoption of the GC instructional approach in learning Probability.
Methodology
Sample
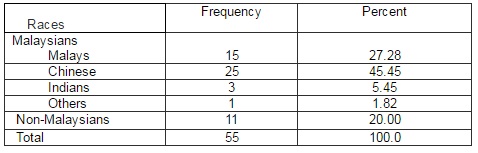
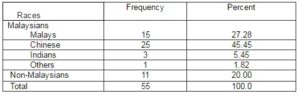
A convenient sampling approach was adopted where the students involved in this study were those who registered for Probability and Statistics in Information Technology degree program. There were 55 students (48 males and 7 females) in the sample. Their age range was 20-28 years-old. Table 1 shows that there are 44 Malaysians and 11 non-Malaysians in the sample.
Table 1: Frequency and Percentage for Races
Instrument
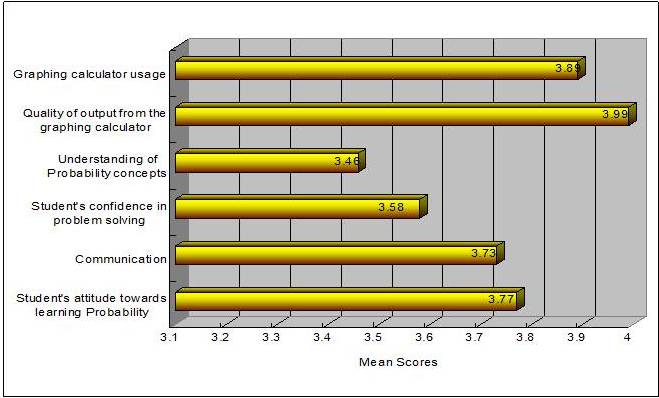
An adapted questionnaire called “Questionnaires on Students’ Perception on the use of Graphing Calculator in learning and teaching probability (QSP)” which consists of 22 likert-scale questions, ranged from ‘strongly disagree’, ‘disagree’, ‘neither agree nor disagree’, ‘agree’ to ‘strongly agree’, was employed to measure students’ perception of using GC in probability classroom, It is a paper-and-pencil questionnaire and is adapted from Noraini et al.’s (2003). Data collected from QSP are to measure the six specific aspects: ‘Graphing Calculator usage’, ‘Quality of output from the Graphing Calculator’, ‘Understanding of probability concepts’, ‘Student’s confidence in problem solving’, ‘Communication’ and ‘Student’s attitude towards learning probability’.
Procedure
The topics chosen for this study were Random Variables, Binomial Distribution, Poisson Distribution and Normal Distribution. The GC instructional teaching was conducted in four lessons. To avoid research bias, the teaching was conducted by an instructor who was not a researcher for this study. Each lesson took 2 hours. The lesson began with 30 minutes of delivering the fundamental theory and examples by the lecturer to students. The GC instructional approach of solving problems was employed when explaining the examples. Students were then provided the GC activity worksheet for the problem solving using the GC. It took about 60 minutes for the GC activity. The lesson ended with the presentation of solutions by students and conclusion by the lecturer.
At the end of the study, students were given QSP. The data collected from QSP was then analysed using SPSS 14.0.
Results
The results of students’ perceptions toward the use of GC in learning Probability, with particular focus on the six aspects are shown in Fig. 1. It is found that the students’ perception towards the use of GC in their learning of Probability is favorable. All aspects scored averages of 3.46 and above. The aspect of “Quality of output from the graphing calculator” scored the highest mean of 3.99.
 Fig. 1: Chart for the Means of the Six Aspects
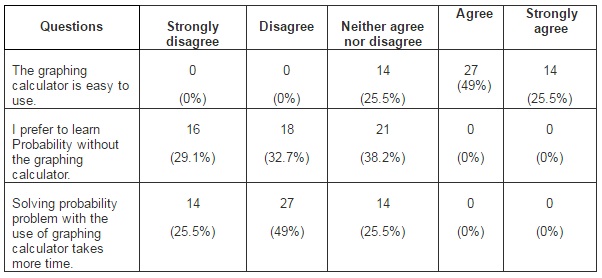
Further analysis on each question of the six aspects was conducted. It is found from Table 2 that a majority of students agreed on the GC usage in Probability learning.
Table 2: Frequency and Percentages of Students’ Perception on the GC Usage
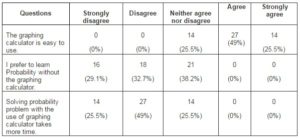
A majority of students (74.5%) agreed and strongly agreed that the GC is easy to use, 61.8% of students strongly disagreed and disagreed on their preferences to learn probability without the GC and 74.5% strongly disagreed and disagreed that solving Probability problem with the GC time consuming.
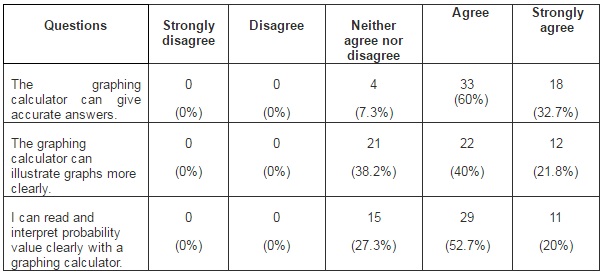
Table 3: Frequency and Percentages of Students’ Perception on Quality of Output from the GC
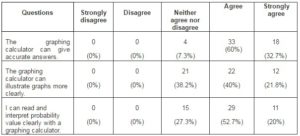
The second aspect was on the students’ perception towards the quality of output from the GC (Table 3). A majority of the students had a positive response to all three statements on the quality of output from the GC. It is clearly seen that 18 (32.7%) strongly agreed and 33 (60%) agreed, the GC gave accurate answers in the solving of Probability questions. No one denied the accuracy of answers given by the GC and the clear illustration of graphs shown on the screen of the GC. No one faced the problem of not being able to read and interpret the probability value clearly with the GC. 12 (21.8%) strongly agreed and 22 (40%) agreed that the GC illustrated the graphs more clearly, while 11 (20%) strongly agreed and 29 (52.7%) agreed that they could read and interpret the probability value clearly with the GC.
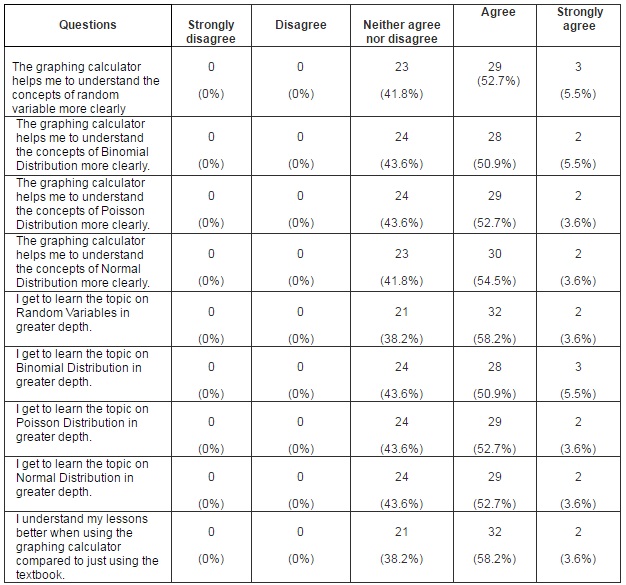
Table 4: Frequency and Percentages of Students’ Perception on How the GC Helps to Understand Probability Concepts
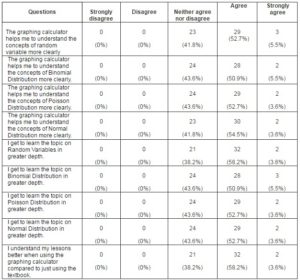
It can be found from Table 4 that more than 50% of students who responded agreed and strongly agreed to all the statements. 58.2%, 56.4%, 56.3% and 58.1% of the students agreed and strongly agreed that the GC had helped them in understanding the concepts of Random Variable, Binomial Distribution, Poisson Distribution and Normal Distribution, respectively.
No student disagreed and strongly disagreed that they got to learn Random Variables, Binomial Distribution, Poisson Distribution and Normal Distribution in greater depth. It was found that 32 (58.2%) of the students agreed and 2 (3.6%) strongly agreed that they got to learn Random Variables in greater depth, 28 (50.9%) agreed and 3 (5.5%) strongly agreed that they got to learn Binomial Distribution in greater depth, whereas 29 (52.7%) agreed and 2 (3.6%) strongly agreed that they got to learn the topics of Poisson Distribution and Normal Distribution, respectively, in greater depth.
As seen in the last statement, 61.8% of the students noted that they were able to understand the lessons better when they used the GC, compared to only using the textbook in their learning. 32 (58.2%) students agreed and 2 (3.6%) strong agreed with this statement.
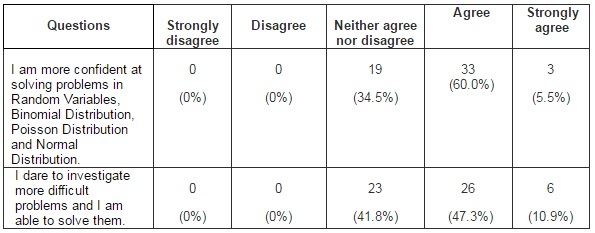
Table 5: Frequency and Percentages of Students’ Perception on Their Confidence in Problem Solving
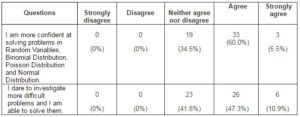
There were only two items for the next aspect on students’ confidence in problem solving when the GC was used, as shown in Table 5. No student perceived that they had less confidence at solving problems of the Random Variable, Binomial Distribution, Poisson Distribution and Normal Distribution, as well as less daring to explore more difficult problems and low ability to solve the problems independently. 33 (60.0%) agreed and 3 (5.5%) strongly agreed that they felt more confident to solve the problems for all four topics. In terms of whether the GC had increased students’ daringness to explore more difficult problems and the ability of solving them, 26 (47.3%) of the students were “daring” enough and 6 (10.9%) of them were “very daring” to explore more difficult problems and were able to solve the problems independently. 19 (34.5%) of the students were unsure whether the GC had helped to increase their level of confidence at solving the problems in the four topics taught, and 23 (41.8%) of them were not sure of their daringness to explore more difficult problems and their ability to solve the problems independently.
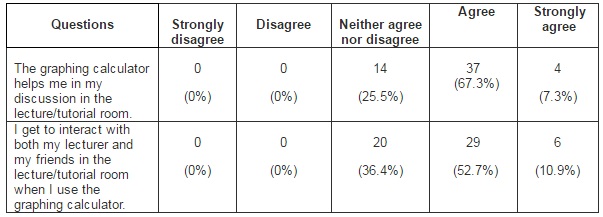
Table 6: Frequency and Percentages of Students’ Perception on the GC Helps Them in Communication
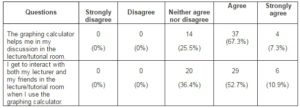
As seen in Table 6, two statements investigated the students’ perception on their communicative abilities when using the GC during the discussion. There were 74.6% (37 students or 67.3% agreed and 4 students or 7.3% strongly agreed) of the students who felt that the GC had helped them in their discussions during the lectures/tutorials. 14 (25.5%) students were non-committal. On the other hand, no one either did not agree or strongly disagreed that the GC had helped them to interact with their instructor and friends in their discussion during the lectures/tutorials. The GC had also encouraged 63.6% (52.7% strongly agreed and 10.9% agreed) of the students to interact with their instructor and friends. They held many discussions on getting the solutions for the problems given on the instructional activities. They also compared the answers on the screen of the GC among themselves because the GC was a tool for them to explore more difficult problems and investigate many ‘what if’ situations. However, 20 (36.4%) of them were unsure whether the GC had encouraged interaction among friends and instructor.
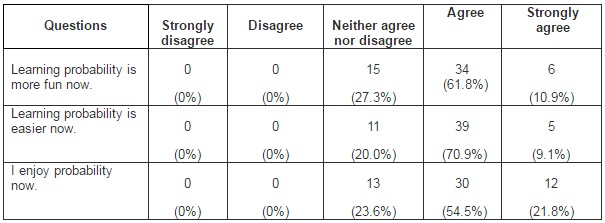
Table 7: Frequency and Percentages of Students’ Perception on Their Attitude towards Learning Probability
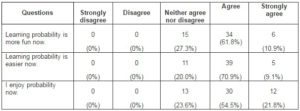
72.7% of the students felt that their learning of Probability was more fun now with the use of the GC (Table 7), that is, 61.8% agreed and 10.9% of the students strongly agreed on this view. The GC environment now made them relaxed in the discussion. If they obtained the wrong answer, their friend guided them towards the solutions or the GC could confirm the answer for them. Therefore, as we can see from Table 8, 80% (39 students or 70.9% agreed and 5 students or 9.1% strongly agreed) of the students perceived that the GC provided them the environment which made their learning of Probability become easier. In the “enjoyment” of learning Probability with GCs, 30 (54.5%) and 12 (21.8%) students, respectively, perceived that they enjoyed and thoroughly enjoyed Probability now.
Discussions
The findings of this study indicate a favourable response towards the use of the GC as a tool as they were experiencing it for the first time in learning mathematics, particularly in Probability. Students did not find it complicated or difficult to use. On the contrary, they found it rather easy to use and less time consuming. The GC appeared to make the seemingly ‘routine’ calculation ‘fun’ and easy to work on. As pointed out by Oldknow (1999) and Shore (1999), the rate at which GCs enabled the students to solve problems was clearly favourable in this study, as it made mathematics problems easier and faster to work out. Students displayed the enjoyment in exploring and investigating Probability. Students channelled the saved time and energy to solve more Probability problems and interpreting the problems, solutions and answers either from GCs or GC worksheets; and learnt more materials in a shorter time.
GCs also provided quality output, i.e. the accurate answers in a shorter period of time as proposed by Sundram (2008). In this study, most of the students expressed satisfaction with the quality of output produced from GCs; in terms of accuracy of answers, clear illustrations of graphs and ease of interpretation of values, which enhanced their understanding of the concepts and consequently their level of confidence in solving Probability problems. The unique abilities of the GC coupled with graphical and tabular strategies provided students with a wider range of solution strategies which allowed the ease of switching to another strategy when the presently used strategies failed. With increased understanding of concepts, the levels of confidence and levels of satisfaction seemed to have been boosted and surprisingly it was observed that students displayed a positive attitude towards learning Probability.
The GC enabled students to develop conceptual understanding and problem-solving abilities in mathematics particularly in dealing with the four topics addressed in this study. This was due to the fact that the GC helped students to assess the reasonableness of their answers, to justify their answers, and then to form conclusions, inferences, and generalizations based upon their solution to the problem (Spinato, 2011). Students displayed a better understanding of their lessons when using GCs compared to using mere textbooks and they also displayed the ‘daringness’ in investigating more difficult problems as well as their ability to solve the problems independently. It gave room for the exploration of problem solving. Subsequently, students ventured into more challenging problems confidently. Another evidence of attitudes change with the use of GCs was the students’ improved communication abilities. Students’ involvement and participation in the discussions of activities were promoted especially during the process of fielding and exploring mathematical questions that required them to exhibit and contrast the potential of diverse resources and mathematical strategies (Moreno-Armella & Cinvestar, 1999).
Consistent with the previous research, a positive attitude and increased motivation to learn Probability was cultivated, i.e. most of the students found learning with GCs fun, easy and enjoyable. The fun and enjoyable learning environment appears to enable students to learn Probability with less anxiety and consequently made the learning process easy. The learning of Probability also appeared to be less stressful and they found it easy to relate the theories learnt to the real life situations. Students found that they enjoy learning Probability now.
Recommendation
This study only examined the students’ perceptions and attitudes toward the use of GCs. It is worthwhile to study the teachers’ perceptions toward using GCs in the teaching of Probability. This would be helpful in providing information to universities, educators and the Malaysian Ministry of Education on teachers’ perceptions towards the GC usage, such as their readiness to use ICT in teaching and in what aspects they should emphasise during the incorporation of GCs in teaching. Thus, necessary actions could be taken in the planning and implementation of ICT programmes in learning institutions. In addition, the considerations, planning and introduction of appropriate GC programmes can be conducted in teacher training institutions to prepare pre-service teachers to incorporate GCs in their teaching when they teach in schools.
(adsbygoogle = window.adsbygoogle || []).push({});
References
Esteban, S., Gonzalez, M. P. & Tejero, L. J. (2000). “Videos as a Learning Support to Improve Mathematics Education. I. Advantages and Methodology,” Proceedings of the International Conference on “Mathematics for Living”, Jordan.
Publisher – Google Scholar
Heller, J. I., Curtis, D. A., Jaffe, R. & Verboncoeur, C. J. (2005). “Impact of Handheld Graphing Calculator Use on Students Achievement in Algebra 1,” Heller Research Associates.
Publisher
Idris, N. (2006). “Exploring the Effect of TI-84 Plus on Achievement and Anxiety in Mathematics,” Eurasia Journal of Mathematics, Science and Technology Education, 2(3), 67-78.
Publisher
John, S. (2004). ‘Difficulties Encountered by College Students in Solving Probability Problems,’ Unpublished Master Project Paper/Research Report, Malaya University, Malaysia.
Jones, P. (2003). ‘The Graphing Calculator: Education Potential & Challenges,’ Proceedings of the 1st National Conference on Graphing Calculators, Malaysia.
Jones, T. (2000). ‘Instructional Approaches to Teaching Problem Solving in Matehmatics: Integrating Theories of Learning and Technology,’ Final Paper, EDUC6100. [Online], [Retrieved January 11, 2006], http://www.mindymac.com/edu6100projects/TjonesProblem6100.htm.
Lee, P. Y. (2004). ‘The Impact of Technology on Teaching of Mathematics,’ Yahya, A. H., Adam, B., Ahmad Izani, M. I., Koh, H. L. & Low, H. C. (Eds.), Malaysia, Penerbit Universiti Sains Malaysia.
Moreno-Armella, L. & Cinvestar, M. S.- T. (1999). ‘The Use of Hand Calculators as Cognitive Tools in Mathematical Problem Solving,’ Laughbaum, E. D. (Ed.), Columbus, OH, The Ohio State University.
Google Scholar
Nasir, K. (1997). ‘Factors Affecting Mathematics Achievement in Malaysian Schools,’ Unpublished Doctoral Dissertation, Indiana University, Indiana.
Google Scholar
NCTM. (2000). ‘Principles and Standards for School Mathematics,’ (electronic ed.), Reston, V.A.
Google Scholar
Noraini, I., Tay, B. L., Goh, L. S., Nilawati, M., Ding, H. E., Aziah, A. A., et al. (2003). ‘A Graphing Calculator-Based Instruction and Its Impact on the Teaching and Learning of Mathematics,’ KaGUM Project 2001.
Google Scholar
Oldknow, A. (1999). ‘Personal Computing Technology: Use and Possibilities,’ Laughbaum, E. D. (Ed.), Columbus, OH, The Ohio State University.
Peterson, E. (2009). “Using Wiki to Enhance Cooperative Learning in a Real Analysis Course,” Primus, 19(1), 18-28.
Publisher – Google Scholar
Power, M. (2001). ‘Computer Mediated Learning Support for Mathematics,’ [Online], [Retrieved January 11, 2006], http://www.ics.Ltsn.ac.uk/pub/conf2001/posters/Power.htm.
Sam, L. C. & Kee, K. L. (2004). ‘Teaching Statistics with Graphical Calculators in Malaysia: Challenges and Constraints,’ Micromath, Oxford, 20(2), 30.
Google Scholar
Schwarz, C. J. & Sutherland, J. (1997). “An On-Line Workshop Using a Simple Capture-Recapture Experiment to Illustrate the Concepts of a Sampling Distribution,” Journal of Statistics Education, 5(1).
Publisher – Google Scholar
Shore, M. A. (1999). The Effect of Graphing Calculators on College Students’ Ability to Solve Procedural and Conceptual Problems in Developmental Algebra, West Virginia University, Morgantown,West Virginia.
Publisher – Google Scholar
Spinato, H. J. (2011). The Effects of Graphing Calculator use on High-School Students’ Reasoning in Integral Calculus, University of New Orleans.
Publisher – Google Scholar
Sundram, M. (2008). “Designing Examination Questions by Incorporating the Use of Graphing Calculator,” Proceedings of the 3rd National Conference of Graphing Calculators, Malaysia.
Publisher – Google Scholar
Tan, C.- K. (2012). “Effects of the Application of Graphing Calculator on Students’ Probability Achievement,” Computers & Education, 58, 1117-1126.
Publisher – Google Scholar
Tan, C.- K., Harji, M. B. & Lau, S.- H. (2011). “Fostering Positive Attitude in Probablity Learning Using Graphing Calculator,” Computers & Education, 57, 2011-2024.
Publisher – Google Scholar
Wasike, D. W. (2006). “Effectiveness of a Language Based Program in School Mathematics on Students Understanding of Statistics,” Eurasia Journal of Mathematics, Science and Technology Education, 2(3), 79-87.
Publisher – Google Scholar
West, R. W. & Ogden, R. T. (1998). “Interactive Demonstrations for Statistics Education on the World Wide Web,” Journal of Statistics Education, 6(3).
Publisher – Google Scholar
Wisenbaker, J. M., Scott, J. S. & Fadia, N. (1999). “A Corss-Cultural Comparison of Path Models Relating Attitudes About and Achievement in Introductory Statistics Courses,” Proceedings of the International Statistical Institute,[Online], [Retrived March 10, 2006], http://www.stat.fi/isi99/proceedings/arkisto/varasto/wise0263.pdf
Publisher
Zand, H. & Crowe, W. D. (2001). “Distance Learners and a CAS-based Mathematics Course: Evaluation and Its Problems,” Proceedings of the the 6th ATCM Conference.
Publisher – Google Scholar