Introduction
With the recent attention to the possibilities of data (Chen et al., 2012; Gopalkrishnan & Steier 2012; Işık et al., 2013) and with Big Data igniting “the management revolution” (McAfee & Brynjolfsson 2012; Bughin et al., 2013), organizations have been forced to reconsider their use of data and business analytics in strategic management, especially on building a competitive advantage (Porter 1985; Kaplan & Norton 1996; White 2004). Analyzing data can improve the success rate of any of the three generic strategies Porter identified: in cost leadership, data analytics can improve efficiency and find alternative ways for implementation; in differentiation data outside the organization plays a key role as the organization tries to identify where the best profits are in the long term; and in focus data can reveal interesting segments and industries.
Managers are now pressured to build data-oriented management systems to make sense of the enormous amount of data (Kiron & Shockley 2011). Studies have shown that the challenge of building a data-oriented culture is not technological, but managerial and cultural (Barton & Court 2012; Kiron & Shockley 2011; Kiron et al., 2012). A data-oriented culture supports and guides the use of analytics. It is not enough to simply have the data, people and tools – an organization also needs strong cultural commitments to create a competitive advantage (Kiron & Shockley 2011). A data-oriented culture consists of using data and analytics as a strategic asset, having strong support from management throughout the organization, and having the results of the analytics (the insights) available to the right people at the right time. Furthermore, being able to build a competitive advantage with analytics, an organization should also have strong information management and analytics expertise.
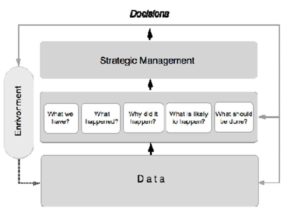
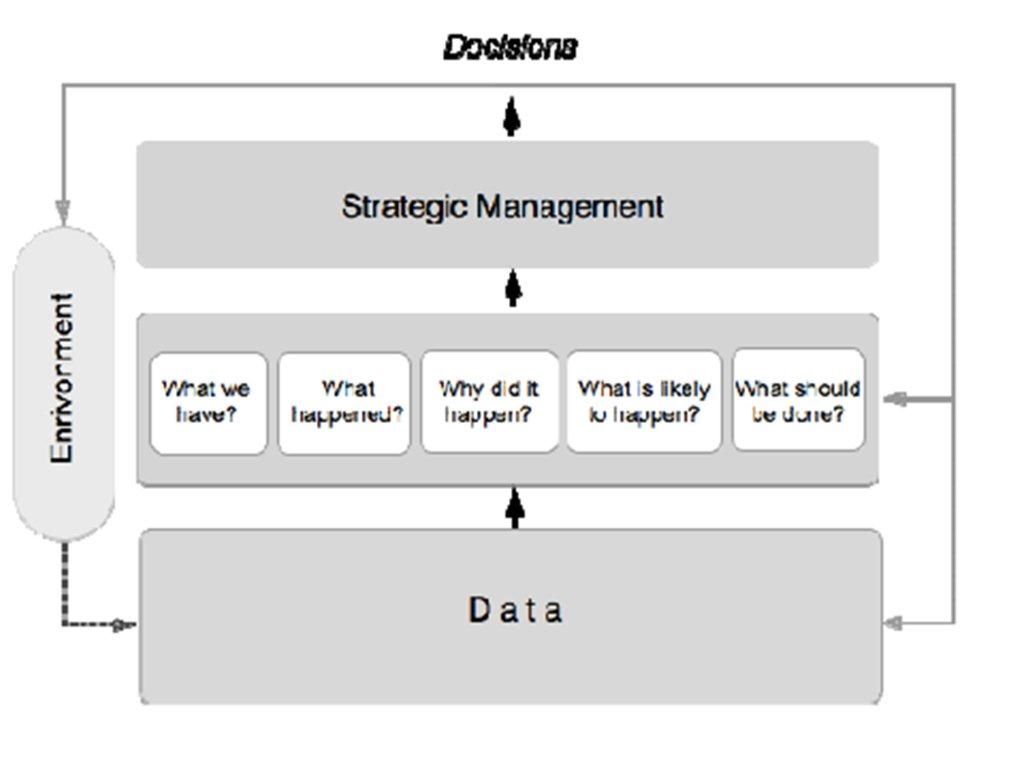
Figure1: the process view of data, analytics, strategic management, and the organization’s environment
Several authors suggest taking a data-oriented view to strategic management (Kiron & Shockley 2011; Davenport 2013; Barton & Court 2012). According to Kaplan and Norton (2004) strategic management is an iterative cycle of strategy formulation, strategy implementation and strategy evaluation. Furthermore, Lamb says that strategic management is “an ongoing process that evaluates and controls the business and the industries in which the company is involved; and then reassesses each strategy regularly to determine how it has been implemented and whether it has succeeded” (Lamb 2008). There are several management systems based on the cycle of planning, executing, analyzing and making changes, ranging from Deming cycle to Balanced Scorecard (Deming 2000; Kaplan & Norton 1996). The goal of successful strategic management is often to build a sustainable competitive advantage to protect the future earnings of the business (Porter 1985). Business Intelligence & Analytics are the key elements of a data-oriented management system in the process of interpreting data (Fig. 1.).
By combining theories on strategic management, process improvement, and data-oriented culture, we present in this paper a model for systematically assessing organization’s analytical capabilities. The model helps an organization in four ways: first, by recognizing how well the organization exploits all types and kinds of data available inside and outside the organization; second, how well the organization uses that data; third, how the organization can continuously improve to bridge the gap between its strategic needs and the current analytical capabilities; and fourth, how to bind the data, current situation and improvement planning with the strategic needs of the organization.
Data is an asset that is defined to be “anything that has value to organization”, and types of assets are included as follows (ISO/IEC n.d.): “a) information (knowledge or data); b) software, such as a computer program; c) physical, such as computer; d) services; e) people, and their qualifications, skills, and experiences; and f) intangibles such as reputation and image”. In business information infrastructures, data lies in different kinds of data storages or file systems, and it is created and maintained via applications (such as sales management, project management, support system, etc.). The applications contain one or more datasets that are collections of data (Wikipedia 2014).
Traditional organizations mostly use structured data that is managed by the organization in their own or hosted applications. However there’s a vast amount of data that does not fit in this category and is not used in analytics. Such data could contain vital information about the organization’s products, processes, customers, competitors, and partners, and market trends. As can be concluded from the previous and in Fig. 1 data lay the foundation for business analytics, and further, for strategic management. Because data have quickly grown in volume, velocity, and variety it can be challenging to recognize the most relevant data for organization. For noticing essential from the big picture, data have to be categorized in a modern way and the organization must have capabilities to analyze it.
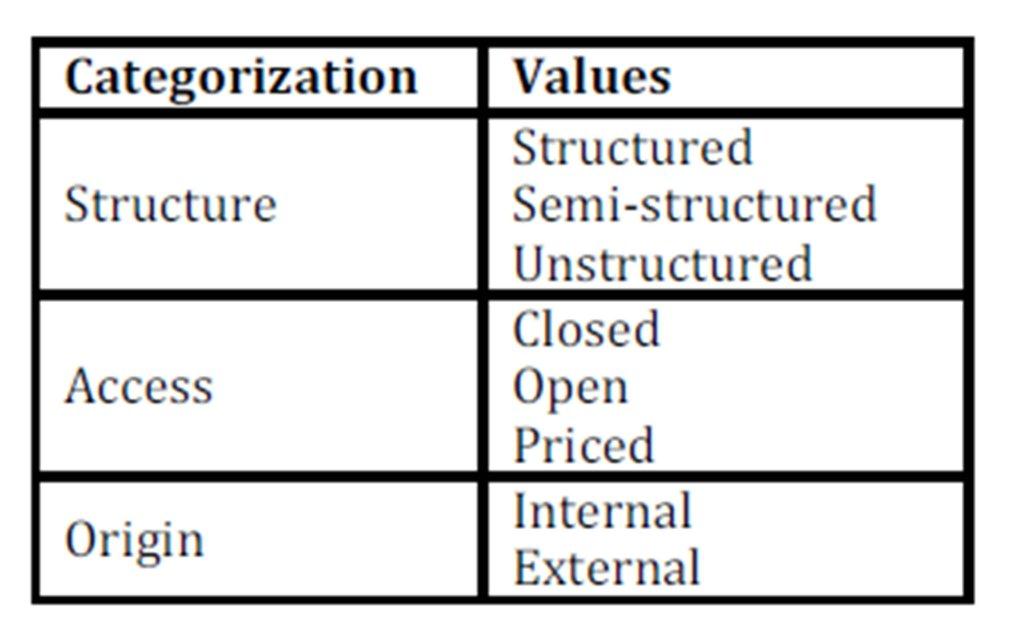
Park & Song (2011) identify the two most used categories of data; structured and unstructured. Bitton (2006) also lists these two categories and identifies that their users have different interfaces to them: Business Intelligence for structured and Search for unstructured data. Li et al., (2008) use three categories, structured, semi-structured, and unstructured, as the basis of their keyword search method. One step further, (B. Park & Song 2011) divide data into structured (i.e. relational form) and unstructured (i.e. text) forms that are acquired from inside or outside the organization.
Another way to categorize data is the access to the data. The availability of open data, both form public and private organizations, has increased over the past few years (Eberius et al., 2012). In Europe, the EU has launched an Open Data Strategy for Europe expecting a high boost on EU’s economy (European Commission n.d.). As a consequence, several governments and public agencies are driving open data wherever legally possible (Zuiderwijk & Janssen 2012). However, making data open is not only for public organizations, as platforms based on crowd-sourced data collection also publish open data (Socrata n.d.). Platforms for collecting, accessing and distributing open data have also emerged – even open data games have been proposed (Friberger & Togelius 2012; Socrata n.d.). Clearly, as a contrast to open data, there is also closed data to illustrate data available only to a certain organization. As a third category between open and closed data, is data that can be bought – we call this priced data.
Data can also be categorized based on its origin: where and by whom it was created or collected. Internal data is created by the organization, even though it would locate outside the organization’s premises on a hosted platform. External data is created by someone else, and access to it is either free or it can be purchased from data vendors (Infochimps 2014; Microsoft 2013). Reference (Petschulat 2010) discusses different kinds of external data and also the risks on using external data. Table 1 summarizes the existing categorizations of data.
Table 1: Prevailing Categorizations of data
The paper is organized as follows. In Section 2, the first phase of the model, application listing, is introduced. In Section 2, the model and its three phases are introduced. In Section 3 we present the discussion of the paper. Finally, Section 4 concludes the paper.
Data Assessment Model
The data assessment model provides a quick and easy way for an organization to understand the variety of data available to it. The assessment can be done by a group of people (or just one person) who are familiar with different applications used around the organization. The model identifies what datasets the organization can use in analytics and to assess the datasets according to their strategic importance and the organization’s level of analytical capability. For example non-technical people may learn that a single application contains more than one datasets and they may discover existing interesting datasets that are not yet used in analytics. The data assessment model contains three phases (Fig. 2.).
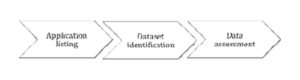
Figure 2: The three phases of the data assessment model
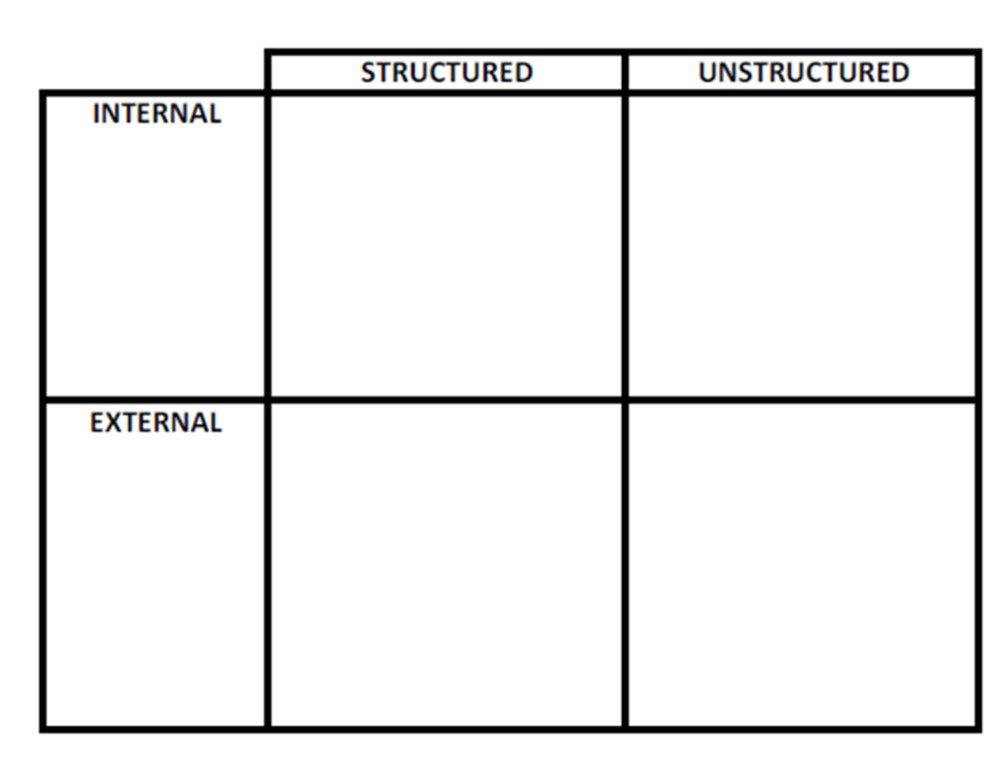
In our model we use a two-dimensional template for identifying datasets of different kind: internal and external, and structured and unstructured (Fig. 3.). We chose to use the term unstructured, instead of separating structured, semi-structured and unstructured, simply for the sake of clarity. The phases of the process are introduced in the following subsections.
Phase 1: Application Listing
The first phase of the model is to list all internal and external applications and place them in the empty boxes on the left side of the template (Fig. 3.). It is easier to start by looking at applications rather than datasets, as one application can contain several datasets. The rule between internal and external is in the ownership of the data; so a hosted application, although located outside the organization is internal as the organization owns the data.
Figure3: The template for identifying business applications and their datasets
Internal data covers all data that are managed by the organization itself. This category contains, e.g. all databases, IT systems, file systems, portals and emails used by the organization that are not available to any other organization without special arrangements. From analytics and IT management point of view, this category is the most typical category, and existing methods and processes tend to cover only this kind of data. Typical applications using and producing data in this category are customer service management (CRM), enterprise resource planning (ERP), sales, marketing, customer self-service, applications and portals.
External data have its origin outside the organization. Bigger organizations have used external data for a long time and external data have a well-established part in their analytics workflows (Petschulat 2010). Such external data include securities data, corporate information, credit risk data, and address/postal code lookup. There are also new external data sources – such as social media, retail sales, web trends, weather, government, and competitive intelligence services – that can offer exiting new possibilities to advanced analytics. Open data fall in the external category. In some cases, an organization can download an open dataset and then use it as it was their own, and in some cases there are service providers that offer the data via APIs or widgets and make using that data easier. As an example, anyone can download the data from OpenStreetMaps, but since hosting and then using a large dataset is not easy, there are companies that host the map data and make it easy to build map-based services (OpenStreetMap 2014; CloudMade 2014).
There are several ways to integrate internal and external data. The elementary way to get the external data, and also very common in the past, is to download a flat file over HTTP or FTP (Petschulat 2010). Recently data providers and content providers have brought more flexible ways to access the data, such as, web portals, Web Services, and REST services.
Phase 2: Dataset Identification
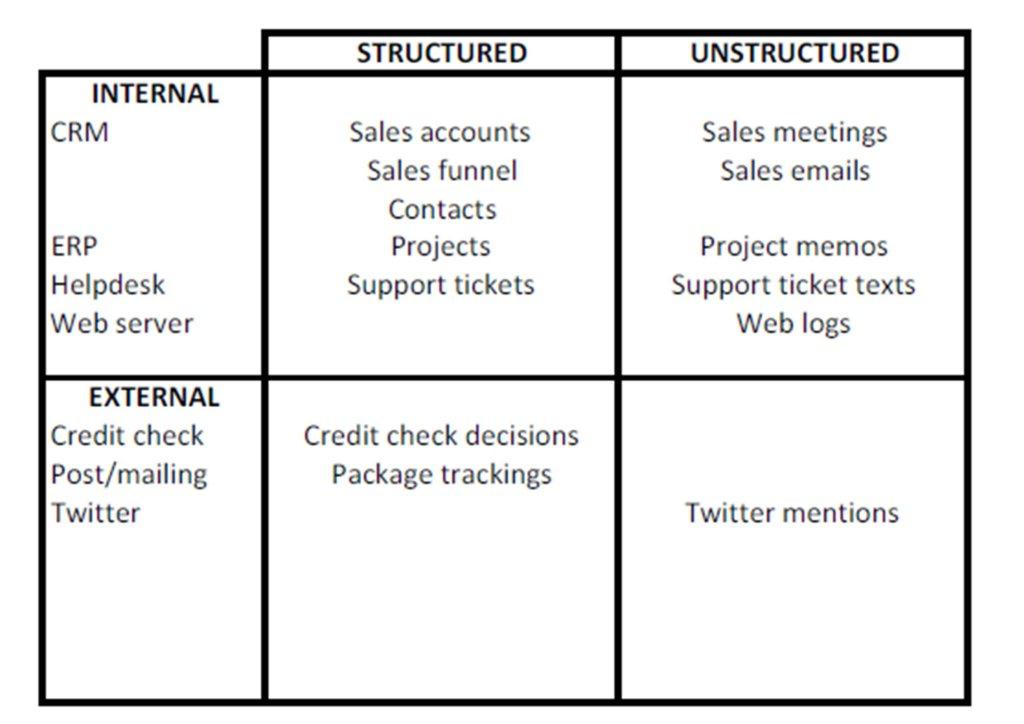
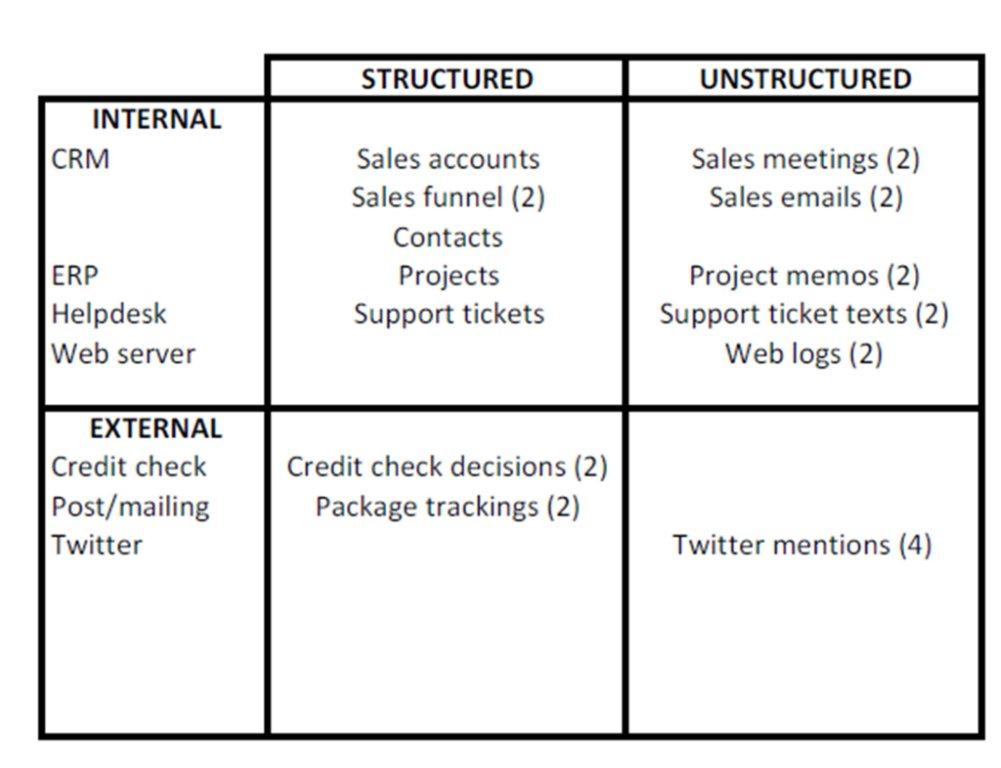
The second phase of the model is to identify datasets contained by the applications and place them in the structured and unstructured boxes accordingly. For example, a customer relationship management application (CRM) might contain the following (internal) structured datasets: accounts, sales funnel, and contacts; and the following unstructured datasets: sales meeting memos and sales emails. Fig. 4 contains an example of the applications and datasets of a small software product firm.
Figure 4: An example of the applications (on the left) and their datasets (in the four-field) in a small software product firm
Structured data are stored in a structural format that makes it easy for the user to know the format and meaning of the data. In most cases the meaning of the data is not in the database, but in the documentation or in the software that uses the data. Structured data can be defined as having a data model (Redman 2008) and typically locating in a relational database.
Unstructured data do not have a data model that would describe how the data are formatted or what the content of the data is. Unstructured data are typically free-form text, audio, images, videos, web pages, documents or other binary data. Some unstructured data, for example log files, can have a seemingly steady format, but still the analytics tools made for structured data cannot be used to analyze it.
It is important to understand that one data source, for example a CRM application, can have both structured datasets and unstructured datasets: structured data as records of accounts and sales cases, and unstructured as memos, emails, and attached documents. This is very often the case with large external data providers. Some data providers, such as Facebook and Twitter, can be considered to have several kinds of data, some of it structured and some unstructured. For example, with Twitter API a developer can search for users and receive a collection of user objects (Twitter n.d.). This would be considered structured data. The developer can also search for tweets or connect to the stream of all tweets and thus get unstructured data.
Phase 3: Data Assessment
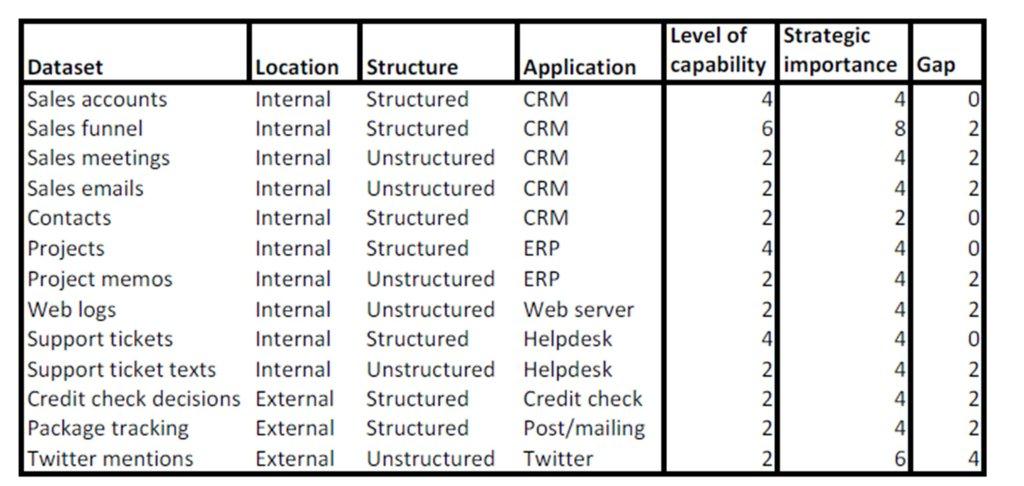
The third phase of the model the assessment, in which all the discovered datasets are listed and their location, structure, and source application are described. Fig. 5 contains the listed datasets for the example introduced in Fig. 4.
Fig. 5: An example of listed datasets with their attributes, capabilities, strategic importance and the gap between capability and importance.
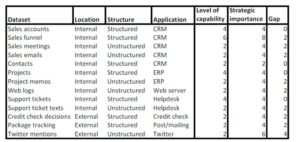
Figure 5: An example of listed datasets with their attributes, capabilities, strategic importance and the gap between capability and importance
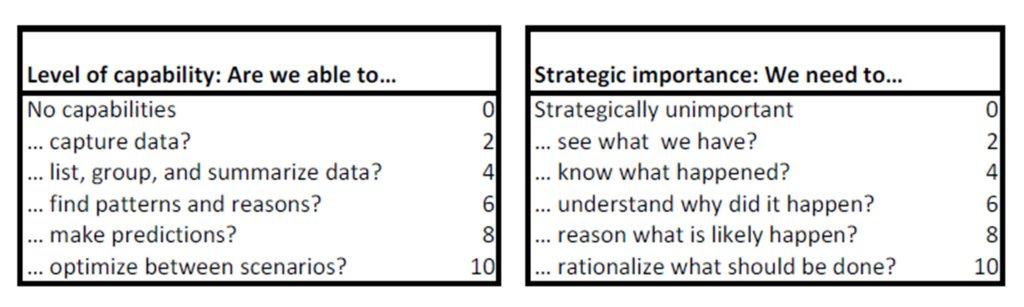
Then each of the datasets is assessed according to the level of analytical capability the organization has to that dataset, and to the strategic importance of the dataset. The level and the importance are integer values between zero and ten. Fig. 6 contains reference values for determining appropriate values for both the level of capability and the strategic importance. The structure of the capability-importance assessment is lightly based on the Resources and Capabilities model by Grant (2008).
Figure 6: Reference tables for level of capability and strategic importance
The result is a list of categorized datasets, marked with strength of capability in analytics, their strategic importance, and strategic needs. If the strategic need column is greater than zero, there is a strategic need to develop analytical capabilities for that dataset. This is indicated by the Gap value in Fig 5. An organization can sort the datasets in descending order by the Gap value (i.e. strategic needs) and focus on improving as many as they can. Finally we can bring the gap values from the table in Fig. 5 to the four-field model and get an easily communicated version of the strategically important development needs (Fig. 7): the higher the gap value is, the bigger the difference between current capability and strategic importance.
Figure 7: The final view of the datasets together with the gap values indicating strategically most important development needs. The higher the gap value is, the bigger the difference between current capability and strategic importance
Discussion
Models, like all tools, have a learning curve. The data assessment model was built to be as self-explaining as possible. To make it even easier, some samples of the contents and formats of the data in different categories were also listed. The proposed model should be easy to understand, and tying it to the use of analytics and strategic management makes it a good tool in discussions between analysts and management. With the model it is easy to quickly learn and show what data is utilized currently and what more could be used if captured, processed, downloaded, or bought. The model might also be a valuable tool in justifying development projects on analytics and data integrations.
The model can be used in brainstorming as a simple four-field drawn on a flap board. The results of these brainstorming session can however be further processed to tie the organization’s current data utilization to the strategic needs of the organization and to understand what are the most significant improvement projects. With the model it is easy to discover for example that text mining on external unstructured data requires a different set of capabilities than numerical reports of internal structured data.
Unique internal data analyzed together with external data can be a great source of unique, hard to copy, analytical findings. Therefore, combining them in analytics together with good analytical capabilities creates new possibilities to build a competitive advantage. The amount of internal data and the analytical knowhow plays a significant role in how long a company can maintain this competitive advantage over time. However, the technical process of utilizing data from all four categories of the model does require a lot of experience in understanding and managing the risks of data quality and availability. Several researchers have identified the problems of external and unstructured data when used with traditional business intelligence; for example, structural elements have been added into the chat application of the customer service to improve the use of the chat transcripts (Wu et al., 2012). Petschulat (2010) lists unpredictable delays, data anomalies, schema changes, and semantic data changes as challenges of using external data sources. The method of taking data from publicly available web sites as a basis for competitive intelligence, and then automatically generating reports is very risky, as the format and availability of the data can change without notice (Petschulat 2010).
While doing a parallel study collecting primary data on the maturity of business analytics in regional organizations, we used the structure of the data assessment model as a tool to measure how well organizations used different kind of data. We found that most organizations begin with one or few internal structural datasets, and then added external datasets to their analytics workflow. After utilizing external structured, some organizations had proceeded to utilizing internal unstructured data. In our regional study we found no organizations utilizing external unstructured data, which was often referenced as the most challenging kind. The organizations explained that it was easier to use existing analytical capabilities on structured data than to build new capabilities required for the analytics of unstructured data. Thus using external datasets was an easier step forward than analyzing unstructured data.
Conclusion
In this paper we proposed a new data assessment model for strategic management that makes the organization’s analytical capabilities and strategically important development needs transparent. The model contains three phases: first the applications are listed, then the datasets contained by the applications are identified, and finally the datasets are assessed according to the level of the organization’s analytical capabilities and its importance from strategic management point of view. The model uses an easily communicated four-field template for mapping data as Internal/External and Structured/Unstructured. The main benefit of the model is to guide in identifying what datasets the organization could use in analytics and in assessing the datasets according to their strategic importance.
There are several interesting possibilities for future work. As one of the future work, we aim to expand this model by adding another model to manage the development of organization’s analytical capabilities. This future work would focus on developing strategically important capabilities (data, tools, and people) and tying their development into strategic management. Another future work involves a parallel study on business analytics maturity in regional organizations. That research focuses on building a modern maturity model for business analytics and using the maturity model in a field-study on the maturity of business analytics in regional organizations. We are planning on combining the model proposed in this paper, the parallel study on business analytics maturity, and the model on developing analytical capabilities into a data asset management framework. The framework would offer a comprehensive and simple tool for managing business analytics.
(adsbygoogle = window.adsbygoogle || []).push({});
References
1. Barton, D. & Court, D., 2012. Making advanced analytics work for you. Harvard business review, 90(10), pp.78–83, 128. Available at: http://www.ncbi.nlm.nih.gov/pubmed/23074867.
Google Scholar
2. Bitton, D., 2006. One Platform for Mining Structured and Unstructured Data : Dream or Reality ?,
Google Scholar
3. Bughin, J., Chui, M. & Manyika, J., 2013. Ten IT-enabled business trends for the decade ahead,
Google Scholar
4. Chen, H., Chiang, R. & Storey, V., 2012. Business intelligence and analytics: from big data to big impact. MIS Quarterly, 36(4), pp.1165–1188. Available at: http://www.just.edu.jo/~amerb/teaching/2-12-13/cs728/83466038.pdf [Accessed June 2, 2013].
Google Scholar
5. CloudMade, 2014. CloudMade – The Location Platform Serving OEMs, Enterprises & Developers. Available at: http://cloudmade.com/ [Accessed March 10, 2014].
6. Davenport, T.H., 2013. Analytics 3.0. Harward Business Review, (December).
7. Deming, W.E., 2000. Out of the crisis, The MIT Press.
8. Eberius, J. et al., 2012. Identifying And Weighting Integration Hypotheses On Open Data Platforms Categories and Subject Descriptors. WOD, pp.22–29.
Google Scholar
9. European Commission, Digital Agenda: Turning government data into gold. Available at: http://europa.eu/rapid/press-release_IP-11-1524_en.htm [Accessed May 24, 2013].
Publisher – GoogleScholar
10. Friberger, M.G. & Togelius, J., 2012. Generating game content from open data. Proceedings of the International Conference on the Foundations of Digital Games – FDG ’12, p.290. Available at: http://dl.acm.org/citation.cfm?doid=2282338.2282404.
Publisher – GoogleScholar
11. Gopalkrishnan, V. & Steier, D., 2012. Big data, big business: bridging the gap. … Workshop on Big Data, …, pp.7–11. Available at: http://dl.acm.org/citation.cfm?id=2351318 [Accessed June 2, 2013].
12. Grant, R.M., 2008. Contemporary Strategy Analysis 6th ed., Oxford: Blackwell Publishing Ltd.
Publisher – GoogleScholar
13. Infochimps, 2014. Data Marketplace. Available at: http://www.infochimps.com/marketplace [Accessed March 20, 2014].
Publisher – GoogleScholar
14. Işık, Ö., Jones, M.C. & Sidorova, A., 2013. Business intelligence success: The roles of BI capabilities and decision environments. Information & Management, 50(1), pp.13–23. Available at: http://www.deepdyve.com/lp/elsevier/business-intelligence-success-the-roles-of-bi-capabilities-and-YXhgJkS5BO [Accessed May 25, 2013].
Google Scholar
15. ISO/IEC, ISO/IEC 27013:2012 Information technology — Security techniques — Guidance on the integrated implementation of ISO/IEC 27001 and ISO/IEC 20000-1,
16. Kaplan, R.S. & Norton, D.P., 2004. Strategy Maps: Converting Intangible Assets into Tangible Outcomes, Harvard Business Press.
Google Scholar
17. Kaplan, R.S. & Norton, D.P., 1996. Using the Balanced Scorecard as a Strategic Management System. Harvard Business Review, (January-February).
Google Scholar
18. Kiron, D., Prentice, P.K. & Ferguson, R.B., 2012. Innovating With Analytics. MITSloan Management Review, 54(2).
19. Kiron, D. & Shockley, R., 2011. Creating Business Value with Analytics. MITSloan Management Review, 53(1).
20. Lamb, R., 2008. Competitive strategic management, Englewood Cliffs: Prentice-Hall.
21. Li, G. et al., 2008. EASE : An Effective 3-in-1 Keyword Search Method for Unstructured , Semi-structured and Structured Data. SIGMOD, pp.903–914.
Publisher – Google Scholar
22. McAfee, A. & Brynjolfsson, E., 2012. Big data: the management revolution. Harvard business review. Available at: http://automotivedigest.com/wp-content/uploads/2013/01/BigDataR1210Cf2.pdf [Accessed June 2, 2013].
Google Scholar
23. Microsoft, 2013. Windows Azure Marketplace. Available at: http://datamarket.azure.com/ [Accessed May 23, 2013].
Publisher – GoogleScholar
24. OpenStreetMap, 2014. OpenStreetMap. Available at: http://www.openstreetmap.org/ [Accessed March 14, 2014].
Publisher – GoogleScholar
25. Park, B. & Song, I., 2011. Toward total business intelligence incorporating structured and unstructured data. Proceedings of the 2nd International Workshop on Business intelligencE and the WEB, pp.12–19. Available at: http://dl.acm.org/citation.cfm?id=1966890 [Accessed June 2, 2013].
Publisher – GoogleScholar
26. Park, B.-K. & Song, I.-Y., 2011. Toward total business intelligence incorporating structured and unstructured data. Proceedings of the 2nd International Workshop on Business intelligencE and the WEB – BEWEB ’11, p.12. Available at: http://portal.acm.org/citation.cfm?doid=1966883.1966890.
Publisher – GoogleScholar
27. Petschulat, S., 2010. Other people’s data. Communications of the ACM, 53(1), p.53. Available at: http://portal.acm.org/citation.cfm?doid=1629175.1629196.
Publisher – Google Scholar
28. Porter, M., 1985. Competitive Advantage, New York: Free Press.
Publisher – GoogleScholar
29. Redman, T.C., 2008. Data Driven: Profiting from Your Most Important Business Asset, Boston: Harvard Business School Press. Available at: http://www.amazon.com/Data-Driven-Profiting-Important-Business/dp/1422119122 [Accessed May 28, 2013].
Publisher – GoogleScholar
30. Socrata, OpenData. Available at: https://opendata.socrata.com/ [Accessed May 23, 2013].
Publisher – GoogleScholar
31. Twitter, Twitter Developers. Available at: https://dev.twitter.com/ [Accessed May 24, 2013].
Publisher – GoogleScholar
32. White, C., 2004. Strategic Management, Basingstoke: Palgrave Macmilla.
Publisher – GoogleScholar
33. Wikipedia, 2014. Data set. Available at: http://en.wikipedia.org/wiki/Data_set [Accessed March 20, 2014].
Publisher – GoogleScholar
34. Wu, M., Bhowmick, A. & Goldberg, J., 2012. Adding structured data in unstructured web chat conversation. Proceedings of the 25th annual ACM symposium on User interface software and technology – UIST ’12, p.75. Available at: http://dl.acm.org/citation.cfm?doid=2380116.2380128.
35. Zuiderwijk, A. & Janssen, M., 2012. A comparison of open data policies and their implementation in two Dutch ministries. Proceedings of the 13th Annual International Conference on Digital Government Research – dg.o ’12, p.84. Available at: http://dl.acm.org/citation.cfm?doid=2307729.2307744.
36. Barton, D. & Court, D., 2012. Making advanced analytics work for you. Harvard business review, 90(10), pp.78–83, 128. Available at: http://www.ncbi.nlm.nih.gov/pubmed/23074867.
Google Scholar
37. Bitton, D., 2006. One Platform for Mining Structured and Unstructured Data : Dream or Reality ?,
Google Scholar
38. Bughin, J., Chui, M. & Manyika, J., 2013. Ten IT-enabled business trends for the decade ahead,
Google Scholar
39. Chen, H., Chiang, R. & Storey, V., 2012. Business intelligence and analytics: from big data to big impact. MIS Quarterly, 36(4), pp.1165–1188. Available at: http://www.just.edu.jo/~amerb/teaching/2-12-13/cs728/83466038.pdf [Accessed June 2, 2013].
GoogleScholar
40. CloudMade, 2014. CloudMade – The Location Platform Serving OEMs, Enterprises & Developers. Available at: http://cloudmade.com/ [Accessed March 10, 2014].
41. Davenport, T.H., 2013. Analytics 3.0. Harward Business Review, (December).
42. Deming, W.E., 2000. Out of the crisis, The MIT Press.
GoogleScholar
43. Eberius, J. et al., 2012. Identifying And Weighting Integration Hypotheses On Open Data Platforms Categories and Subject Descriptors. WOD, pp.22–29.
Publisher – GoogleScholar
44. European Commission, Digital Agenda: Turning government data into gold. Available at: http://europa.eu/rapid/press-release_IP-11-1524_en.htm [Accessed May 24, 2013].
45. Friberger, M.G. & Togelius, J., 2012. Generating game content from open data. Proceedings of the International Conference on the Foundations of Digital Games – FDG ’12, p.290. Available at: http://dl.acm.org/citation.cfm?doid=2282338.2282404.
GoogleScholar
46. Gopalkrishnan, V. & Steier, D., 2012. Big data, big business: bridging the gap. … Workshop on Big Data, …, pp.7–11. Available at: http://dl.acm.org/citation.cfm?id=2351318 [Accessed June 2, 2013].
47. Grant, R.M., 2008. Contemporary Strategy Analysis 6th ed., Oxford: Blackwell Publishing Ltd.
48. Infochimps, 2014. Data Marketplace. Available at: http://www.infochimps.com/marketplace [Accessed March 20, 2014].
49. Işık, Ö., Jones, M.C. & Sidorova, A., 2013. Business intelligence success: The roles of BI capabilities and decision environments. Information & Management, 50(1), pp.13–23. Available at: http://www.deepdyve.com/lp/elsevier/business-intelligence-success-the-roles-of-bi-capabilities-and-YXhgJkS5BO [Accessed May 25, 2013].
Publisher – GoogleScholar
50. ISO/IEC, ISO/IEC 27013:2012 Information technology — Security techniques — Guidance on the integrated implementation of ISO/IEC 27001 and ISO/IEC 20000-1,
51. Kaplan, R.S. & Norton, D.P., 2004. Strategy Maps: Converting Intangible Assets into Tangible Outcomes, Harvard Business Press.
GoogleScholar
52. Kaplan, R.S. & Norton, D.P., 1996. Using the Balanced Scorecard as a Strategic Management System. Harvard Business Review, (January-February).
GoogleScholar
53. Kiron, D., Prentice, P.K. & Ferguson, R.B., 2012. Innovating With Analytics. MITSloan Management Review, 54(2).
54. Kiron, D. & Shockley, R., 2011. Creating Business Value with Analytics. MITSloan Management Review, 53(1).
GoogleScholar
55. Lamb, R., 2008. Competitive strategic management, Englewood Cliffs: Prentice-Hall.
56. Li, G. et al., 2008. EASE : An Effective 3-in-1 Keyword Search Method for Unstructured , Semi-structured and Structured Data. SIGMOD, pp.903–914.
Publisher – GoogleScholar
57. McAfee, A. & Brynjolfsson, E., 2012. Big data: the management revolution. Harvard business review. Available at: http://automotivedigest.com/wp-content/uploads/2013/01/BigDataR1210Cf2.pdf [Accessed June 2, 2013].
GoogleScholar
58. Microsoft, 2013. Windows Azure Marketplace. Available at: http://datamarket.azure.com/ [Accessed May 23, 2013].
59. OpenStreetMap, 2014. OpenStreetMap. Available at: http://www.openstreetmap.org/ [Accessed March 14, 2014].
60. Park, B. & Song, I., 2011. Toward total business intelligence incorporating structured and unstructured data. Proceedings of the 2nd International Workshop on Business intelligencE and the WEB, pp.12–19. Available at: http://dl.acm.org/citation.cfm?id=1966890 [Accessed June 2, 2013].
GoogleScholar
61. Park, B.-K. & Song, I.-Y., 2011. Toward total business intelligence incorporating structured and unstructured data. Proceedings of the 2nd International Workshop on Business intelligencE and the WEB – BEWEB ’11, p.12. Available at: http://portal.acm.org/citation.cfm?doid=1966883.1966890.
GoogleScholar
62. Petschulat, S., 2010. Other people’s data. Communications of the ACM, 53(1), p.53. Available at: http://portal.acm.org/citation.cfm?doid=1629175.1629196.
Publisher – GoogleScholar
63. Porter, M., 1985. Competitive Advantage, New York: Free Press.
64. Redman, T.C., 2008. Data Driven: Profiting from Your Most Important Business Asset, Boston: Harvard Business School Press. Available at: http://www.amazon.com/Data-Driven-Profiting-Important-Business/dp/1422119122 [Accessed May 28, 2013].
GoogleScholar
65. Socrata, OpenData. Available at: https://opendata.socrata.com/ [Accessed May 23, 2013].
66. Twitter, Twitter Developers. Available at: https://dev.twitter.com/ [Accessed May 24, 2013].
67. White, C., 2004. Strategic Management, Basingstoke: Palgrave Macmilla.
68. Wikipedia, 2014. Data set. Available at: http://en.wikipedia.org/wiki/Data_set [Accessed March 20, 2014].
69. Wu, M., Bhowmick, A. & Goldberg, J., 2012. Adding structured data in unstructured web chat conversation. Proceedings of the 25th annual ACM symposium on User interface software and technology – UIST ’12, p.75. Available at: http://dl.acm.org/citation.cfm?doid=2380116.2380128.
70. Zuiderwijk, A. & Janssen, M., 2012. A comparison of open data policies and their implementation in two Dutch ministries. Proceedings of the 13th Annual International Conference on Digital Government Research – dg.o ’12, p.84. Available at: http://dl.acm.org/citation.cfm?doid=2307729.2307744.