Introduction
In recent years it has been widely recognised that water was managed with little regard to the efficiency of its utilisation and with no or very little effective pollution control (Pallett, 1997). A water-stressed country is one in which the demand exceeds the supply or poor quality restricts its use (Perveen & James, 2011). South Africa is such an example with less than 1 700 m3 of water available per capita per year (Rand Water, 2008), along with very limited budgets for the supply and maintenance of basic infrastructure services. According to Cullis (2005) over 6 million people in South Africa are without access to even a basic level of water supply or have only a very limited level of access. The water poverty situation is further worsened by the unawareness of the water scarcity situation and through irresponsible usage.
The term water poverty tends to invoke thoughts of a lack of the actual resource; however, Sullivan et al. (2003) and Sullivan et al. (2005) believe that it should be collectively expressed in terms of resource, access, capacity, use and environment. These five components are contained in the Water Poverty Index (WPI) that was initially developed by Sullivan et al. (2002), and further refined by researchers at the Centre for Ecology and Hydrology in Wallingford, United Kingdom.
When the WPI is represented graphically, it becomes a very effective communication medium to the various stakeholders and role players, as no prior knowledge of the map construction or WPI calculation is required. This enables them to make informed decisions about the area(s) most in need of interventions.
Demarcation
As mentioned earlier South Africa is classified as a water-stressed country (Rand Water, 2008). Water stress leads to the deterioration of fresh water resources, both in terms of quality as well as quantity. According to Rijsberman (2005) water scarcity occurs when the majority of people in an area do not have access to safe and affordable water to satisfy their basic needs for a significant period of time. Basic needs include sufficient water for drinking, washing and sustaining their livelihoods. Rand Water (2008) warns that if South Africans do not learn how to use their limited water supplies wisely, they will move into a water scarcity category – that is, less than 1 000 m3 per person per year – by 2025. World Bank figures indicate that roughly 11 countries globally are water stressed and another 18 countries are affected by water scarcity (Hemson et al., 2008).
This research addresses some of the various needs that were highlighted in the 1994 Reconstruction and Development Program (RDP), which listed “meeting basic needs” as one of its five broad programmes (Melville and Goddard, 1996). Some of the areas that were highlighted in the RDP as being extremely relevant, and therefore in need of research include, amongst others:
• Water, including its provision, sanitation and conservation.
• Social welfare.
This research, either directly or indirectly, assists in addressing all of these needs.
One of the two local municipalities in the demarcated area is the Emfuleni local municipality (ELM). The ELM consists of the two main towns Vanderbijlpark and Vereeniging, along with their surrounding townships and settlements in the southern part of the Gauteng province. The other municipality in the area is the Metsimaholo local municipality (MLM), which consists mainly of the town Sasolburg, along with its surrounding townships and settlements in the northern part of the Free State province.
The ELM has highlighted some challenges that they foresee with regards to their water and sanitation services. These challenges include:
• An ageing water infrastructure.
• A limited preventative maintenance program due to a shortage of personnel.
• Rapid development.
• Flat rate billing for water consumption in certain areas.
• Un-metered areas.
In the ELM area, Metsi-a-Lekoa is responsible for the distribution of potable water, and the conveyance and treatment of collected wastewater. Metsi-A-Lekoa is the dedicated water services authority entity for the ELM and its core functions are the water and sanitation functions of the municipality. They utilize some of the assets of the municipality to accomplish these tasks, and are also responsible for the maintenance and the costs of the water services systems (ELM, 2010).
As in the rest of South Africa, unemployment continues to remain a problem in the demarcated area, and this in turn leads to high poverty levels and a high dependency ratio within the municipality. The ability of the population to save and/or engage in other entrepreneurship activities is therefore directly hampered (ELM, 2010). The dependency ratio refers to the amount of unemployed people depending on the municipality for basic services, without being able to pay for it or without making any sort of economical contribution. Ideally, this ratio should be as close as possible to 0. The economic growth for the municipality has been quite slow when compared to the targets that were set for the region by the Gauteng Growth and Development Strategy (GGDS). For the period from 1995 – 2000 the growth rate was 0.4%, for 2000 – 2006 it was 1.8%, for 2006 – 2011 it is projected to be 1.1%, and for the period from 2011 – 2016 it is also expected to be in the region of 1% (ELM, 2010).
Research Methodology
Under the quantitative methodology researchers use the scientific method, which starts with the specific theory and hypotheses, and then quantitatively measure and analyze based on established research procedures (Swanson et al., 2005). It typically consists of five steps which include:
1. Determining the basic questions to be answered by the research. In this study, the effect that 10 years of development have had on the capacity component of the water poverty index.
2. Determining the participants in the research. Quantitative research benefits greatly from generalizability, or being able to draw conclusions about a population from sample data. In this study, to use the water poverty map and index values compiled by Van der Vyver & Jordaan (2012) as the basis for a case study.
3. Selection of methods to answer the research questions. In this study, using secondary data that was compiled at a national level.
4. Selection of statistical analysis tools for analyzing the collected data. In this study, satisfied through the use of data at a high significance level.
5. Performing the interpretation of the results of the analysis based on the statistical significance determined.
The advantages of a case study as a research strategy include (Denscombe, 2003):
• It allows the researcher to deal with the subtleties and intricacies of complex situations.
• It allows the use of a variety of research methods.
• It fosters the use of multiple sources of data.
• It is suitable for when the researcher has little control over events.
• Concentrates effort on one research site.
• Suitable to both theory-building and theory-testing research.
The research makes use of secondary data which has been collected and processed by Statistics South Africa. The data is at a high assurance level and secondary data saves a lot of time and overcomes financial constraints. The focus is on the effect of ten years as the Census is only performed every decade in South Africa.
Water Management
The major shortcomings of national water management that have been widely recognised recently (Clarke and King, 2004; Langford, 2005; Meyer, 2007; Pallett, 1997) include ineffective and insufficient pollution control, and inefficient utilisation with a lot of waste, due to various reasons. Pallett (1997) argues that good water management should ensure a sustainable supply for human demand whilst ensuring that all the needs of the river basin are met, both from the human and the environmental perspectives. The importance of good water management is vital in determining the water fate of the majority of the world’s population (Clarke and King, 2004).
Management is one of the major problems in the global water sector (Ahmad, 2003), and according to Langford (2005), the reasons why we currently find ourselves in a water and sanitation crisis are:
• Insufficient and decaying infrastructure for water service delivery, especially in deprived rural and urban areas.
• Insufficient capacity and funding for the expansion and maintenance of water supply systems.
• Pollution of traditional water sources, particularly from industrial waste, agricultural runoff and human and animal waste.
• Reduced access to, and depletion of, water resources due to drought, population growth, armed conflict and the dominance of commercial agricultural and industrial activities.
Many researchers (Ahmad, 2003; Cullis, 2005; Sullivan, 2002) suggest that a shift of emphasis to a more holistic approach to water management is necessary. This led to the introduction of the Integrated Water Resource Management (IWRM) framework for water management. Poverty reduction and the sustainability of ecosystems, among other things, form the main focus of this approach, i.e. achieving a sustainable water world. The Global Water Partnership (2000:15) defines IWRM as “a process which promotes the co-ordinated development and management of water, land, and related resources in order to maximise the resultant economic and social welfare in an equitable manner without compromising the sustainability of vital ecosystems”.
At the United Nations Conference on the Environment and Development that was held in 1992 in Rio de Janeiro, IWRM was a major item on the agenda. During this conference the various stakeholders came up with an action plan for the world environmental crisis, called Agenda 21. Under this agenda, the four main objectives of IWRM are (Pallett, 1997):
1. To promote the responsible usage, conservation, and management of our valuable water resources.
2. To mainly in developing countries identify or develop the necessary frameworks to ensure that water policy contributes to economic growth.
3. To ensure the cooperation and involvement of all stakeholders in the water resources management process.
4. To ensure that only projects which are economically efficient, socially appropriate, and that fit into clearly defined strategies are implemented.
Unfortunately, according to Swatuk (2010), although supporting the principle of IWRM, South Africa will experience some difficulties in realising the ideals of IWRM in practice. Examples of some of the contributing factors to these expected difficulties include:
• The loss of more than 1 000 000 jobs in the first post-apartheid decade, which had resulted in major economic implications.
• Fault lines that have appeared within and between the major political parties.
• Capital flight and the out-migration of skilled workers to other countries, which limit the capacity of the state and society to shift toward more efficient, equitable and sustainable processes of wealth creation.
However, several successful actions have been documented as well, namely (Swatuk, 2010):
• Free basic water provision for all.
• Improved demand management through progressive tariff and taxation policies, removal of alien species, leak detection and repair in urban areas, etc.
• Incentives for farmers and industry to move towards more efficient water usage.
Hemson et al. (2008) have analysed many years of work and development in the global water sector. This analysis has led them to compile the following set of guidelines, which, when adhered to, will greatly improve the effectiveness of any water management entity’s efforts:
• Set lower goals, as sufficient funding will not be available, rather than argue strongly for more resources.
• Emphasise the very simplest level of technology with wells and village hand pumps to make local water resources more available to the poor within existing budgets.
• Place responsibility first on communities and second on national governments rather than on international organisations.
• Place the responsibility for initial capital resources on communities and require communities to be responsible for operations and maintenance.
• Make water provision an aspect of community development rather than a public health issue.
• Seek ways in which more can be achieved with more or less the same financial commitment by fixing systems rather than providing greater funding.
• Pay greater attention to the role of women in managing water resources and benefiting from delivery.
• Stress better utilisation of water to improve health conditions, for example personal hygiene and proper sanitation.
Perhaps one of the most well-known examples of poor water management relates to the Aral Sea in Kazakhstan and Uzbekistan. The Aral Sea has shrunk by 66% in volume and by 50% in area since 1957, due to the diversion of two rivers that used to feed it for irrigation by the 1960’s Soviet government (Clarke and King, 2004). The water level of the Aral Sea has dropped by more than 13 metres, and its mineral content has increased fourfold, which has effectively killed off the entire fish population. It went from a sea supporting 60 000 fishermen in producing 40 000 tons of fish, to a poisoned wasteland with no fish production. About half the populations of the once seaside Aral towns and villages have fled, leaving the people who were forced to stay in a constant battle with a deadly mix of pollutants. The infant mortality rate in the Aral region is among the highest in the world (Clarke and King, 2004).
The Water Poverty Indices and Map of the Demarcated Area
The initial methods that were used to determine the efficiency of water management were purely deterministic and relied on data collected on a large-scale. A simpler method with the benefits of being easy to calculate, cost effective to implement, based mostly on existing data, and that was easy to understand was needed by policy makers and funding agencies. This motivated Sullivan et al. (2002) to design the WPI as an alternative water situation assessment tool. The WPI offers the following advantages over the initial methods:
• It simplifies the prioritization of water needs.
• It clarifies the relationship between the physical availability of water, its ease of abstraction, and the level of welfare.
• The WPI is mainly designed to help improve the situation for people with low water resources and poor income and educational capacity.
• It contributes to more accurate monitoring of the progress made in the water sector.
The WPI captures the whole range of issues related to water resources availability as well as their impacts on people (Sullivan et al., 2005). The primary goal was to enable holistic water-resource assessments on a site-specific basis at the community level. The WPI defines water poverty according to five components even though different measurement scales are employed. These component variables, which create a better overall picture of water management challenges (Sullivan et al., 2003), are the following:
• Resources. The actual quantity of water that is available, taking into account the seasonal and inter-annual fluctuations and the impact of the water quality.
• Access. The accessibility of water for human use taking into account the distance to a safe source and the time needed to collect the water for household and other needs – including the irrigation of crops and for industrial use.
• Capacity. The ability to effectively manage water.
• Use. This expresses the amount of water that is being used and withdrawn from the system. Use includes domestic, agricultural and industrial use (Lawrence et al., 2002).
• Environment. This variable captures the environmental impact of water management with the intention to ensure long-term ecological integrity. “Environmental factors which are likely to impact on regulation will affect capacity” (Lawrence et al., 2002:1).
A composite index approach is used to calculate the WPI (Cullis, 2005). Depending on the researcher and the purpose of the research each of the five components can consist of a several sub-components and weightings can be applied to each component or sub-component to indicate the relevant importance. The components are all standardised to fall within the range of 0 to 100 (to simplify direct comparison), resulting in a final WPI value between 0 and 100. The highest value of 100 is considered to be the best situation with 0 being the worst. The purpose of the weightings is to emphasise a specific component of the WPI structure, and the importance of any component should not be predetermined by researchers as it is clearly a political decision (Sullivan, 2005).
The five key components are combined together in the general additive expression as follows (Sullivan, 2002):
Where
WPI = Water Poverty Index score of a particular location;
R = The Resources component with a score out of 100;
A = The Access component with a score out of 100;
C = The Capacity component with a score out of 100;
U = The Use component with a score out of 100;
E = The Environment component with a score out of 100;
w = The weighting factor for each component.
The WPI was further developed and refined by researchers at the Centre for Ecology and Hydrology in Wallingford, UK. They refined the WPI that was developed by Sullivan et al. (2002) in an attempt to quantify the link between water and poverty. The achieved this with the combination of hydrological data with socio-economic data and by so doing provided a complex indicator that reflects the true nature of a community and its access to clean water (Schulze and Dlamini, 2002). These researchers, along with experts from the World Water Council, calculated the WPI for 147 countries all over the world (World Water Forum, 2003). The World Water Council is an independent, international organisation incorporated as a French not-for-profit association with over 250 member organisations based in over 60 countries.
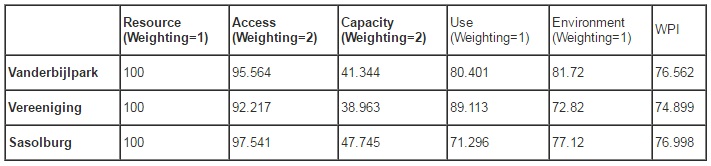
South Africa scored a WPI value of 52, which places it in the lower 50%. Considering that 100 is the perfect goal score, its score of 52 places South Africa roughly in the middle order. The majority of countries in the top ten are in the developed world, are water rich, and have extreme winters (i.e. snowfall), whereas all the countries in the lowest ten positions are in the developing world where there are relatively mild winters, and under-development plays a larger role in water poverty than the availability of the resource. Table 1 contains the WPI values as compiled by Van der Vyver & Jordaan (2012).
Table 1: WPI values
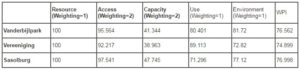
(Source: Van der Vyver & Jordaan, 2012)
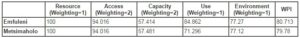
The above mentioned study produced scores of in the high seventies for all the involved towns, which is relatively high in comparison with the entire country, which has a WPI of only 52. The lowest scoring component for all three towns was the capacity component, mainly due to extremely low education level figures. Improving education should therefore be the main focus in the region to improve the overall water poverty.
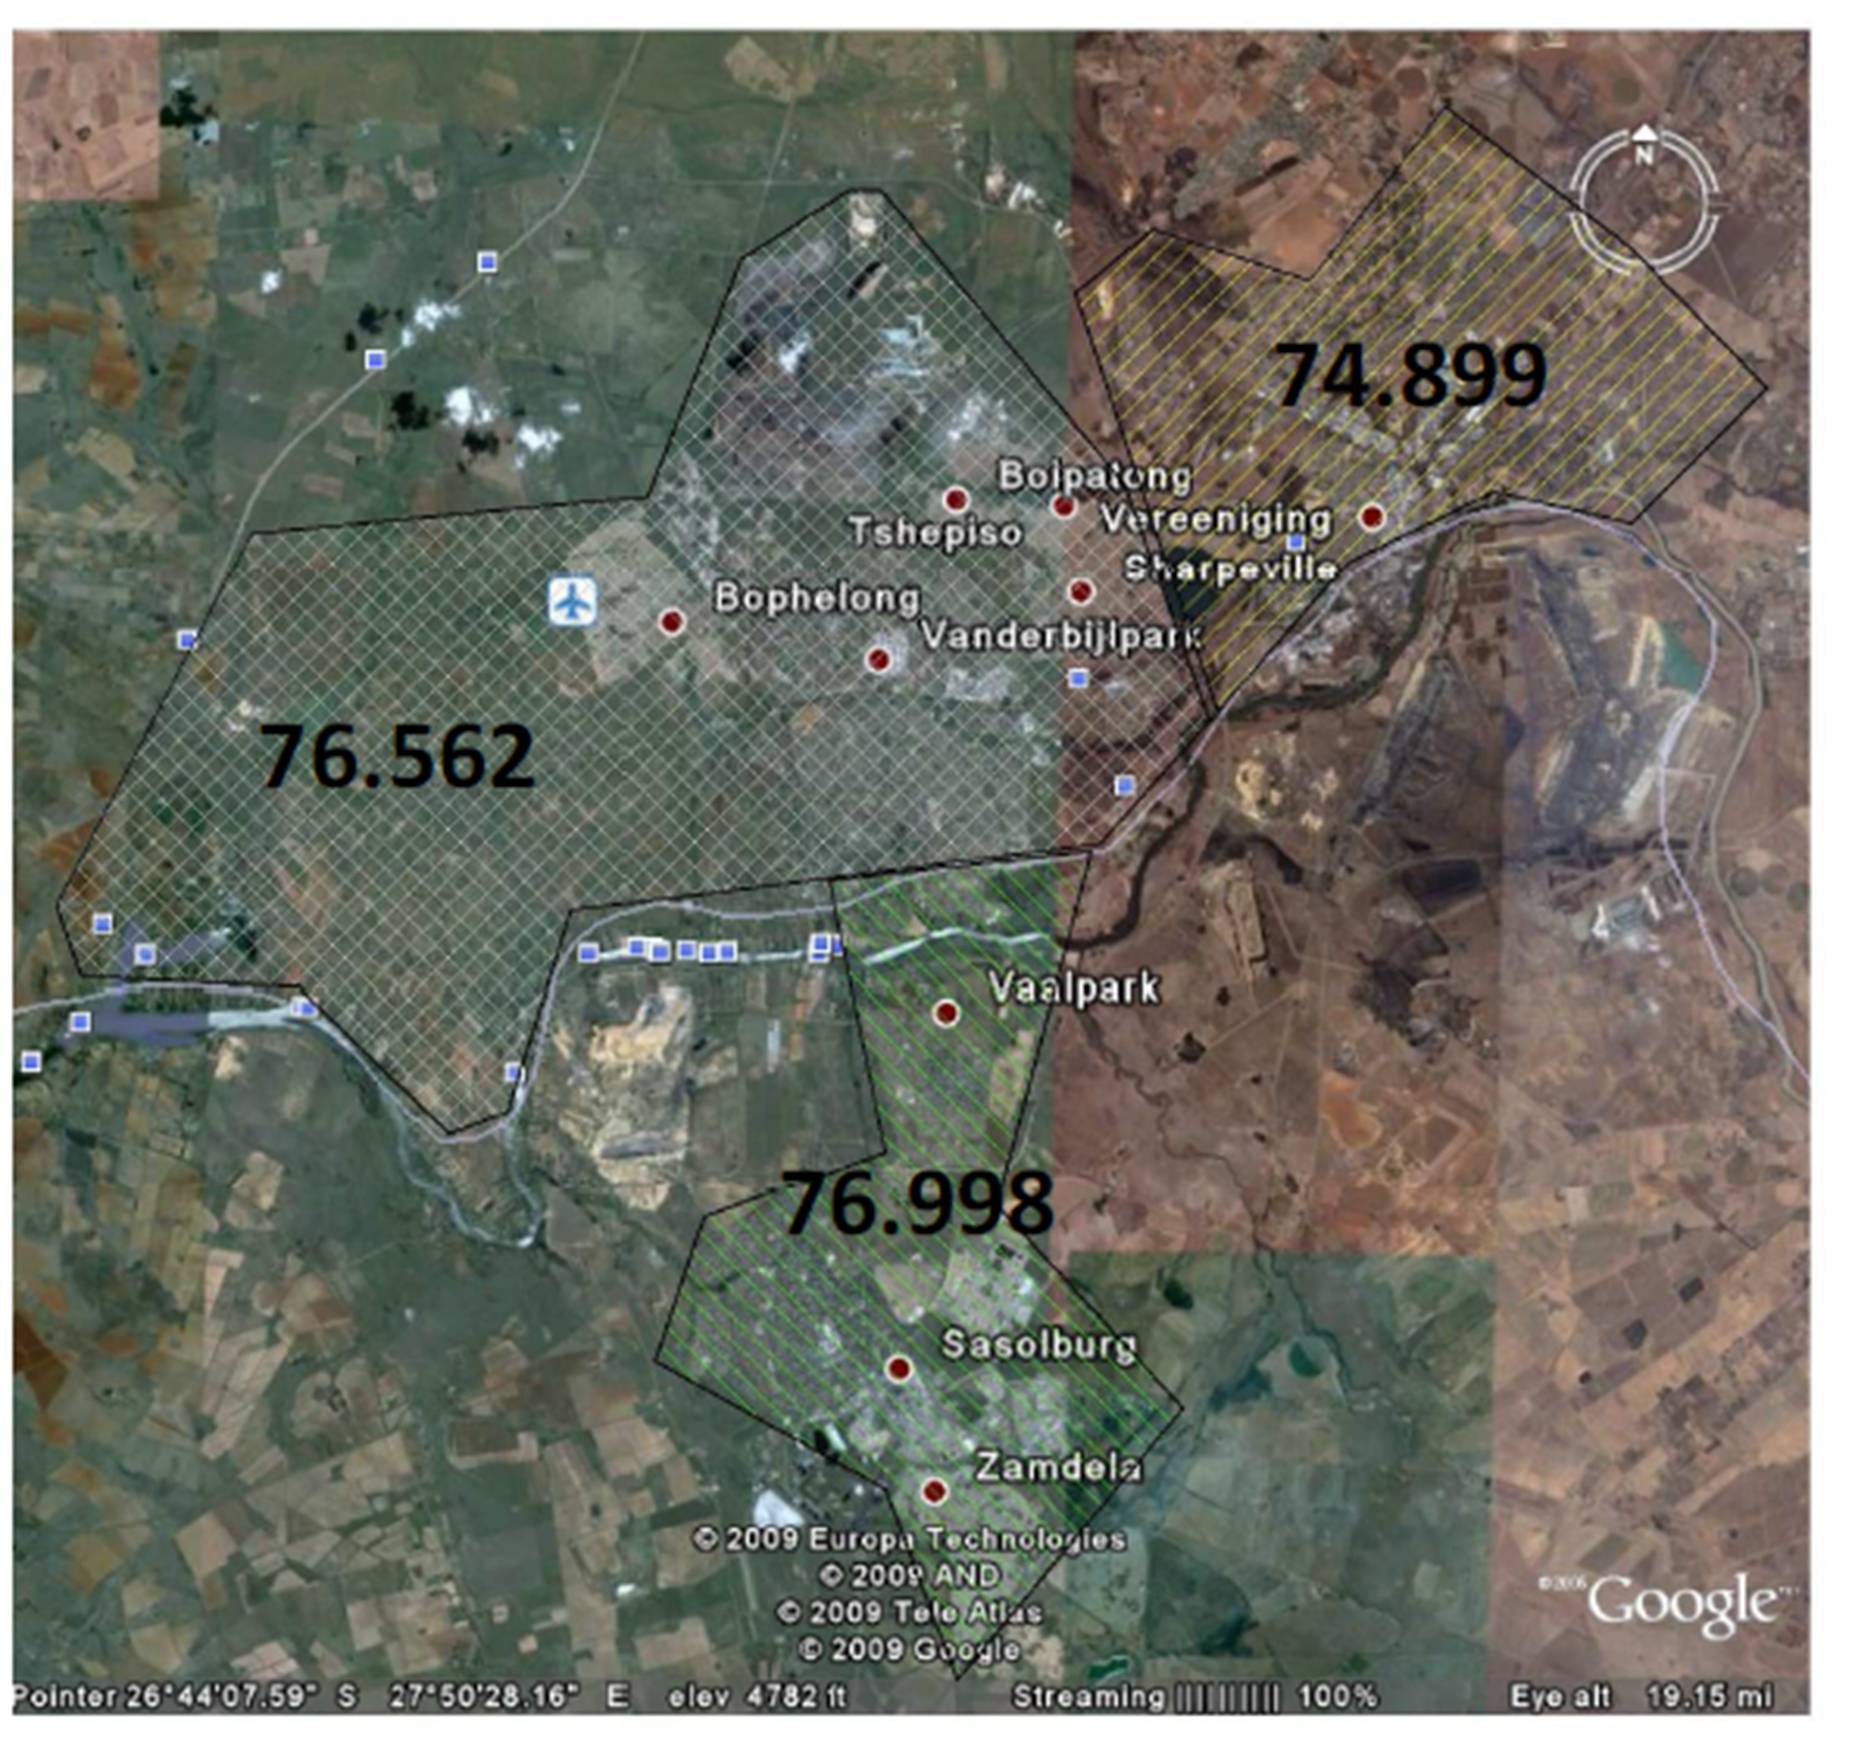
Cullis (2005:8) defines water poverty mapping (WPM) as “the mapping of indicators of water poverty aggregated to a suitable spatial scale”. The purpose of WPM is to identify areas with high levels of water poverty to assist the targeting of water-related policies to ensure the most productive use of resources in an effort to meet the development objectives of the country. The strengths of the WPI, poverty mapping and geographic targeting are combined in WPM (Cullis, 2005). One of the major advantages of WPM is that it provides a visual representation of the WPI. WPM helps to monitor the water poverty situation in an area, and as a result to highlight areas in which resources and efforts should be focused. The water poverty map can also indicate the type of intervention that would be the most appropriate. For example, if the score of the access component was the lowest in a specific area, efforts and resources should be focused on providing more access to water. WPM provides an evaluation and monitoring tool that is much more comprehensive than other water poverty indicators. As a result a great degree of efficiency is achieved in using scarce resources to meet water-related development objectives (Cullis, 2005). Figure 1 contains the WPM that was constructed by Van der Vyver & Jordaan (2012).
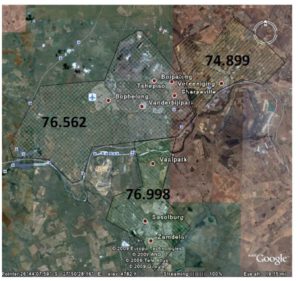
Figure 1: Water poverty map for the demarcated area
(Source: Van der Vyver & Jordaan, 2012)
The colours on the map represent the three towns involved in the study, Sasolburg in green, Vereeniging in yellow and Vanderbijlpark in white. The numbers represent the relevant WPI scores.
Capacity Component Comparison
The capacity component consists of two sub-components, namely educational and income capacity (van der Vyver & Jordaan, 2012). The educational capacity value is calculated as:
EC =
In previous work done by Cullis (2005) for the Eastern Cape Province, it was determined that grade 4 is when learners in South Africa are taught about responsible water usage. The education plan has been unchanged since then, and therefore grade 4 will still be the threshold level for educational capacity.
The income capacity value is calculated as:
IC =
According to the WSDP (the Water Service Development Plan which is available from the Department of Water Affairs), the average person is willing to spend in the region 5% of their disposable income on services. Discussions with a local municipality representative highlighted that a basic suite of services costs approximately R110 per household per month, or R1 320 per household per year. If R1 320 therefore equates to 5% of disposable income, 100% will equate to R26 400, the threshold level to be used for income capacity.
Based on previous work done by Cullis (2002; 2005) the two sub-components used for the capacity component have been assigned equal importance, therefore equal weightings in the South African context. The capacity component value is therefore the average of the two sub-components, and is calculated as:
C =
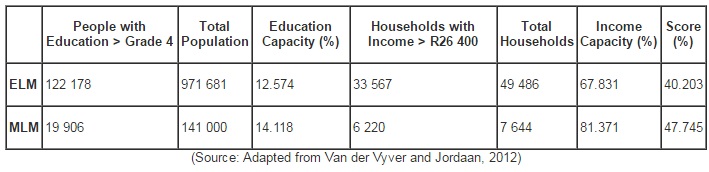
The minimum benchmark level for capacity is 0%, and the maximum level is 100%. The levels have been set at 0 and 100 as capacity expresses the percentage of people with a certain education level and the number of households with a certain income level. Table 2 gives the capacity component scores for the 2001 values. Due to different measurement scales being employed by the 2001 and 2011 Census data, table 2 was created by aggregating the 2001 values from a town scale to a municipal scale. This enables direct comparison and simplifies interpretation.
Table 2: Capacity component scores for 2001 values
In its Integrated Development Plan (IDP) for 2009/2010, the ELM have identified the following constraints with regard to economic growth in the area (ELM, 2010):
1. Population growth has continuously been higher than economic growth, which leads to decreasing living standards
2. The income gap between various population groups is significant, with severe poverty to be found.
3. To maintain investment is becoming increasingly harder, as the area is relatively far from the core of the Gauteng province.
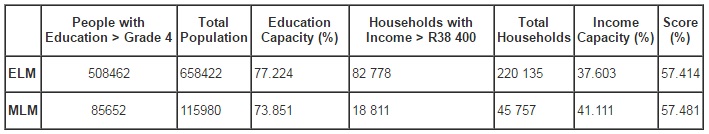
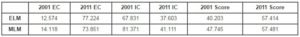
The data for this research was obtained from the Census data from 2011, which was released in 2012 and is accessible from Statistics SA (http://www.statssa.gov.za). Table 3 contains the capacity component scores, updated with the 2011 values obtained from Statistics SA. After consultations with a representative from the local municipality, the threshold level for income capacity was adjusted from R26 400 for the 2001 data, to R38 400 for the 2011 data. This translates to a monthly total of R160 for services, or R1 920 per year. If R1 920 equates to 5% of disposable income, the yearly threshold will equate to R38 400.
Table 3: Capacity component scores for 2011 values

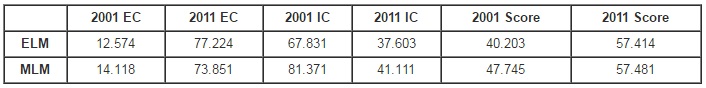
Table 4 provides a summary of the education capacity, income capacity, and component scores in an attempt to simplify comparison.
Table 4 : Direct comparison summary of capacity component scores
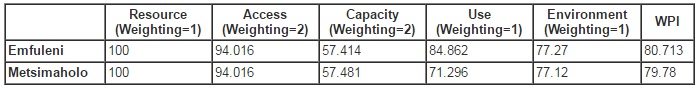
In the study by Van der Vyver & Jordaan (2012), the capacity component was identified as the one most in need of an intervention (see table 1). This is significant, because in the typical South African context the capacity component is assigned a double weighting, highlighting its importance for the country. In that study the education capacity was the lowest contributor to the component score, and as can be seen from table 4, the education capacity has increased tremendously in 2011, an increase of roughly 550%. Even if these values were present in 2001, the capacity component would still have scored the lowest, but the overall WPI could have been improved to roughly eighty. Table 5 contains the aggregated component scores and WPI values from table 1, after updating the capacity component score with 2011 values to illustrate the impact of the improvement.
Table 5: WPI values with updated capacity component
“South Africa has done relatively well, compared to other countries, in ensuring that the key basic policies needed for quality schooling are in place”, Department of Basic Education (DoBE) (2011:15). Further improving the quality of education remains a strategic priority of the Department, and they aim to achieve this by focusing on teachers, text, and time. It was also identified as strategic priorities in the integrated development plans of both the ELM (2010) and the MLM (2012). However, despite these major improvements in the education capacity indicators, the key challenges that have been identified in further improving the system of quality basic education on a national scale include (DoBE, 2011):
• Further improving learner outcomes as they are currently not optimal across all grades.
• Improving the currently insufficient supply of quality support materials to facilitate quality learning.
• Improving the assessments which are currently not up to standard and are not being moderated or benchmarked for quality.
• Decreasing the gap between the requirements of management and the services rendered by support personnel.
In spite of the increase in the education capacity, income capacity showed a decrease of roughly 45% on average (see table 4). Although this might be attributable to a range factors, some possible explanations in the integrated development plan of the ELM (2010) include the low employment level (as shown in figure 4), and a high migration level, amongst others. The MLM (2012) have identified several weaknesses as part of their SWOT analysis, some of which include a serious “brain drain” and economic leakages, amongst others.
So even though major advances have been made in improving the education capacity, it seems to have occurred at the expense of income capacity. The ELM and MLM will therefore have to keep focusing on improving the capacity component score, as even though it is in the high fifties, it will still rank among the lowest scores, if not the lowest.
Conclusion
The WPI and WPM have various advantageous applications for local municipalities, bulk water service providers and government, both local and national. They can assist with water poverty alleviation, improving the accuracy of predictions of future water demand, and for assisting with planning for the future in terms of infrastructure development and maintenance.
This research has shown that in an effort to try and improve the water poverty situation in a region, there can be various other social benefits as well. It has shown that focusing on the lowest scoring component might involve interventions in areas not traditionally linked to water poverty, but that have a positive effect on the area’s WPI as well as education for example, as was the case in this research. The education capacity subcomponent of the capacity component increased significantly from 2001 to 2011, and although the income capacity subcomponent decreased, the capacity and overall WPI scores did improve. Education and more specifically basic education is a national strategic priority, and as highlighted in this research improving education levels can positively impact several other areas as well.
Once the WPI and WPM become more commonplace, practitioners will have to monitor development and interventions on a regular basis to ensure that the decision making process is as relevant as possible.
(adsbygoogle = window.adsbygoogle || []).push({});
References
1. Ahmad, Q. K. 2003. Towards poverty alleviation: the water sector perspectives, Water Resources Development, 19(2), pp. 263-277.
Publisher – Google Scholar
2. Clarke, R. & King, J. 2004. The Atlas of Water. Mapping the world’s most critical resource. Earthscan, 8 – 12 Camden High Street, London, NW1 0JH, United Kingdom.
3. Cullis, J. D. S. 2005. Water poverty mapping: development and introduction using a case study at the local municipal scale for the Eastern Cape. Water Research Commission, TT 250/05, August.
4. Denscombe, M. 2003. The Good Research Guide, 2nd Edition. Open University Press, 325 Chestnut Street, Philadelphia, PA 19106, USA.
5. Department of Basic Education. 2011. Strategic Plan 2011 – 2015.
6. Department of Water Affairs and Forestry. 2008. Integrated Sector Support and Improved Sustainability within Water for Growth and Development. Presentation to the National Water Summit on 17 March 2008.
7. Emfuleni Local Municipality (ELM). 2010. Integrated Development Plan 2009/10.
8. Global Water Partnership. 2000. Towards water security: a framework for action, Stockholm, Global Water Partnership.
9. Hemson, D., Kulindwa, K., Lein, H. & Mascarenhas, A. 2008. Poverty and Water. Explorations of the reciprocal relationship. Zed Books Ltd, 7 Cynthia Street, London, N1 9JF, United Kingdom.
10. Holland, A. S. 2005. The water business. Corporations versus people. Zed Books Ltd, 7 Cynthia Street, London, NI 9JF, United Kingdom.
11. Langford, M. 2005. The United Nations concept of water as a human right: a new paradigm for old problems? Water Resources Development, 21(2), pp. 273 – 282.
Publisher – Google Scholar
12. Lawrence, P., Meigh, J. & Sullivan, C. 2002. The water poverty index: an international comparison. Keel Economics Research Papers, KERP 2002/19, October, 2002.
Google Scholar
13. Melville, S. & Goddard, W. 1996. Research Methodology. Juta & Co Limited, P.O. Box 14373, Kenwyn, 7790.
14. Metsimaholo Local Municipality (MLM). 2012. Integrated Development Plan, 2012/13 – 2016/17.
15. Meyer, W. N. 2007. The economics of water, water for life; sanitation for dignity. Van Schaik Publishers, 1064 Arcadia Street, Hatfield Pretoria.
16. Pallett, J. 1997. Sharing water in Southern Africa. Desert Research Foundation of Namibia, PO Box 20232, Windhoek, Namibia.
Google Scholar
17. Perveen, S. & James, L. A. 2011. Scale invariance of water stress and scarcity indicators: Facilitating cross-scale comparisons of water resources vulnerability. Applied Geography, 31(2011), pp. 321 – 328.
Publisher – Google Scholar
18. Rand Water. 2008. http://www.wisa.org.za/patrons/randwater/index2.html [2 October 2008].
19. Rijsberman, F. R. 2005. Water scarcity: Fact or fiction? Agricultural Water Management, 80(2006), pp. 5 – 22.
Publisher – Google Scholar
20. Schulze, R. E. & Dlamini, D. J. M. 2002. Mesoscale Indicators of Water Poverty in the Thukela Catchment, South Africa, under baseline land cover conditions. Appendix 9.14 to Sullivan, C. A., Meigh, J. R., Fediw, T. S. Derivation and Testing of the Water Poverty Index Phase 1: Final Report. DFID.
21. Sullivan, C. A., Meigh, J. R. & Fediw, T. S. 2002. Derivation and Testing of the Water Poverty Index Phase 1: Final Report. DFID.
Google Scholar
22. Sullivan, C. A, Meigh, J. R. & Lawrence, P. 2005. Application of the Water Poverty Index at different scales: a cautionary tale. Water International, Vol. 31(3), pp. 412 – 426.
23. Sullivan, C. A., Meigh, J. R., Giacomello, A. M., Fediw, T., Lawrence, P., Samad, M., Mlote, S., Hutton, C., Allan, J. A., Schulze, R. E., Dlamini, D. J. M., Cosgrove, W., Delli Priscoli, J., Gleick, P., Smout, I., Cobbing, J., Calow, R., Hunt, C., Hussain, A., Acreman, M. C., King, J., Malomo, S., Tate, E. L., O’Regan, D. P., Milner, S. & Steyl, I. 2003.
The Water Poverty Index: Development and application at the community scale. Natural Resources Forum, 27, pp. 1–11.
Publisher – Google Scholar
24. Swanson, R. A. & Holton, E. F. 3rd. 2005. Research in organizations: Foundations and methods of inquiry. San Francisco, Berrett-Koehler.
Google Scholar
25. Swatuk, L. A. 2010. The State and Water Resources Development through the Lens of History: A South African Case Study. Water Alternatives, Vol. 3(3), pp.521 – 536.
Google Scholar
26. Van der Vyver, C. & Jordaan, D.B. 2012. The application of water poverty mapping in water management. The Journal for Transdisciplinary Research in Southern Africa, 8(1), pp. 95 – 120.
Google Scholar
27. World Water Forum. 2003. Water Poverty Index Yields Surprising Results. 3rd World Water Forum press release.