Introduction
The purpose of this paper was to explore how social networking can contribute to the improvement of cluster’s activity and how it represents one of the key success factors.
A study was conducted to analyse the main performance indicators which derives from the social networking model.
The aim of this research was to identify the most important indicators in establishing and developing the social networking in Transylvanian Furniture Cluster, a newly established Cluster, located in Transylvania-Romania.
Methodology used in this research included survey by on line questionnaire, mathematical models and analytic and graphic social networking analysis of obtained data, through SocNetV software.
Quantitative methods used in the research included input data results of a 34×34 matrix, into the model.
The novelty of this study is in the fact that, for creative industries, in Clusters from Romania, there wasn’t made yet a social networking research which describes the role and the importance of the social capital in this types of organizations.
Theoretical frame: Mathematical model
The operation model of clusters
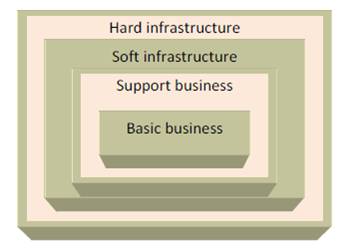
According to Malecki (2002), there can be defined some common points that facilitate the functioning of clusters, whose participants could be divided into:
• Basic business – central, direct business that ensure its income from the direct clients of the cluster;
• Support business – direct or indirect, which support the basic business, including: Raw material suppliers; Suppliers of half-finishes, performs or subassemblies; Suppliers of equipment, installation, spare parts; Suppliers of measurement and control instruments; Service companies; Technical, economical, financial or juridical counselling companies; Prospect and research institutions, universities; Training or professional conversion institutions; Financial, banking services, juridical assistance, marketing, media companies.
In most of the cases, these companies are specialized and are located in the nearby of the cluster centre.
• Soft infrastructure– consisting of schools, universities, other professional trainers, professional associations, developmental agencies, territorial or interregional cooperation Chambers of Commerce, Industry, Agriculture; the quality of this infrastructure contributes to the successful development of the cluster;
• Hard infrastructure– that is, the physical infrastructure of the cluster, consisting of the traffic routes, utility networks, environmental conditions, the existence of an environment protection system in the area, that would ensure recycling or depositing the residues resulting from the production activity of the organization.
Figure 1 presents the dependence degree of the basic business and all the other components of the cluster. In the same time, periodically, in the basic business there can appear products or services from outside the cluster, fact that can be explained either by certain production “peaks” that the components of the support businesses cannot handle in that moment, or by testing actions and drawing of some potential partners. (Radulescu, 2004)
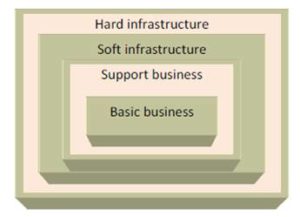
Figure1: The components of clusters. Source: the author
Clusters are based on systemic relations
between the component companies, relations that could be build around some basic or complementary products, processes or technologies, or production processes, requirements of natural resources, the ability, experience of each participant, the existence or opportunity to develop some distribution channels (Radulescu, 2006),(Tantau,2011).
They are able to self-select partners, companies or institutions in the region, thus defining their mission, objectives, resource and relationship building (Iammarino and McCann, 2006).
In this context, the subject of cooperation is to create competitive advantages between partners, as a result of capitalization of their resources.
The relation of cooperation between enterprises increases the chances of obtaining a competitive advantage, in the context of the increasing complexity of the competitive environment interactions thereof (Radulescu, 2006).
Collaborative models for economic clusters
The main forms of cooperation between enterprises are established according to the formof interaction between them: horizontal cooperation, vertical cooperation and cooperation withinthe network.
Horizontal co-operation takes place between entities in the field which have the resources
complementary. For example, cooperation between undertakings for the purchase of materials allows joining forces to increase their purchasing power and gain price reduction.
Another example of cooperative relationships is offered by cooperation between two undertakings whose products are in competition, but who have different strengths. The companies may independently develop products, but can cooperate in order to sell them as well
This form of cooperation appears as a necessity for enterprises in Romania, in
conditions in which most of them are small and medium sized and have lack of distribution channels (Tantau, 2011).
Knowledge and network cluster analysis is a key element to establish strategies that emphasizes capital, communication and valorizes all the intangibles factors that lead to the success of a cluster and generates a consolidation of knowledge and adds new knowledge. Social networking is a factor of change (Iammarino and McCann, 2006).
Thus, cooperation between cluster members has to be reconfigured according to the new context in which they operate. Traditional cooperation between functional areas directed in the sense of increasing economic return, is completed by oriented cooperation in the market scope of struggle with competitors.
The Cluster power lies in establishing new strategic forms of cooperation (Zima and Sabou, 2010).
In cooperation relations in cluster analysis must be issued the following assertions:
• The main actors are the members of the cluster
They are endowed with their own systems of assessment values, which differ from one person to another;
• Relations of cooperation between enterprises in the clusters are not only the intentions shown by isolated individuals within the organization ,so that their implementation should take into account the objectives, strategies, organizational structures and personnel that influence this process;
Links between nodes of each cooperative relationship in the cluster is communication characterized by the quantity and quality of information which ought to be exchanged (Tantau ,2011).
At exploring conditions under which the need for knowledge exchange within a small firms’ cluster generates a structure of links between firms (Iandoli, 2012).
Cluster structure is based on a dense and strong network of relationships among autonomous and heterogeneous actors (that is, firms, and local institutions).
Cluster competitiveness is the result of the co-evolution of the region’s productive organization and of local formal and informal institutions (Eisingerich et al., 2010).
Social network analysis
The social network analysis is used extensively in a wide range of applications and disciplines. Some common network analysis applications include network modeling, network sampling, user attribute and behavior analysis, community-maintained resource support, location-based interaction analysis, social sharing and filtering, recommender systems development, and link prediction and entity resolution. (Borgatti et al.,2013). In the private sector, businesses use social network analysis to support activities such as customer interaction and analysis, marketing, and business intelligence needs.
• Small-world network
According to QK Telesford (2011) Small-world networks, developed by Watts and Strogatz, are a class of networks that are “highly clustered, like regular lattices, yet have small characteristic path lengths, like random graphs.”
These characteristics (Wasserman and Faust, 1994) result in networks with unique properties of regional specialization with efficient and global integration (Telesford et al., 2011), (Giuliani and Pietrobelli, 2014). According to Watts and Strogatz, (1998), a small-world network is ’’a type of mathematical graph in which most nodes are not neighbors of one another, but most nodes can be reached from every other by a small number of hops or steps. Specifically, a small-world network is defined to be a network where the typical distance L between two randomly chosen nodes (the number of steps required) grows proportionally to the logarithm of the number of nodes N in the network, that is: L ∞ log N.’’
A. The Erdős and Rényi G (n, p) model
According to Erdős and Rényi model (1958), one may find a definition of what it means for a property to hold for almost all graphs, when a graph is constructed by connecting nodes randomly. Each edge is included in the graph with probability p independent from every other edge. Equivalently, all graphs with n nodes and M edges have equal probability of:
The parameter p in this model can be thought of as a weighting function; as p increases from 0 to 1, the model tends to include graphs with more edges and less tends to include graphs with fewer edges.
In particular, the case p = 0.5 corresponds to the case where all graphs on n vertices are chosen with equal probability.
One of the property of random graphs is : If n = the number of vertices ∞ , then almost every graph in G (n, 2ln (n)/n) is connected.
It means that : As n ∞ the probability that a graph on n vertices with edge probability 2 ln (n)/n is connected 1
B. The Watts–Strogatz model
A powerful small-world network is presented in the Watts–Strogatz model (1998) ,which is : “a random graph generation model that produces graphs with small-world properties, including short average path lengths and high clustering’’.
The Watts-Strogatz model was designed as a simple model that integrates the first of the two limitations. It fits for clustering and resumes the short average path lengths of the Erdős and Rényi (1958) model.
Note with : N = number of nodes, K= the mean degree and β= a special parameter,
N satisfying and , the model constructs an indirect graph with N nodes and edges. The structure of the model produces a locally clustered network, and the random links significantly reduce the average path lengths. The algorithm introduces about non-lattice edges. Varying β makes it possible to interpolate between a regular lattice (β=0) and a random graph (β =1) approaching the Erdős–Rényi random graph.
Properties of the small-world networks
The three properties of interest are Graph Theory: A. The average path length, B. The clustering coefficient, and the C. Degree distribution .In this paper we shall use the following terminologies and definitions:
A. Average Path Length
Average path length is a concept in network structure. It is defined as the average number of steps along the shortest paths for all possible pairs of network nodes (vertices V).
It is a measure of the efficiency of information or mass transport on a network.
G= unweighted graph; V= the set of vertices; d (v1, v2) = shortest distance between v1 and where v1 , v2 V denote the v2. Assume that d (v1, v2) = 0 if v2 cannot be reached from v1, then, the average path length lG is: , where n, is the number of vertices in G.
B. Clustering coefficient
The Clustering Coefficient of a node measures how close the node and its neighbors are to being a clique. This is used to determine whether a network is a small-world or not. This option calculates and displays the clustering coefficients of all nodes;
A variant of measure clustering coefficient is the global and local. The global version is designed to give an overall indication of the clustering in the network
The global clustering coefficient: The global clustering coefficient is the number of closed triplets (or 3 x triangles) over the total number of triplets (both open and closed). The global clustering coefficient is defined as:
C. Network average clustering coefficient
The overall level of clustering in a network measured by Watts and Strogatz is the average of the local clustering coefficients of all the vertices n ( Opsahl ,2009):
A weighted average where each local clustering score is weighted by = ki (ki – 1) is identical to the global clustering coefficient.
A graph is considered small-world, if its average local clustering coefficient is significantly higher than a random graph constructed on the same vertex set, and if the graph has approximately the same mean-shortest path length as its corresponding random graph.
D. Degree distribution
In the study of graphs and networks, the degree of a node in a network is the number of connections it has to other nodes and the degree distribution is the probability distribution of these degrees over the whole network. (He and Petoukhof, 2011, p.143)
The simplest network model, is the (Bernoulli) random graph, in which each of n nodes is connected (or not) with independent probability p (or 1 − p), has a binomial distribution of degree.
With the notation given by Erdős and Rényi, a graph in G ( n, p) has on average , edges.
, where n is the total number of vertices in the graph.
Since, , as , and this distribution is Poisson for large n and np = const.
• If, then a graph in G(n, p) will almost surely contain isolated vertices, and thus be disconnected.
• If , then a graph in G(n, p) will almost surely be connected.
Study case: Transylvanian Furniture Cluster
Background: Transylvanian Furniture Cluster
Transylvanian Furniture Cluster is an innovative cluster specializes in design, manufacture, marketing and distribution of furniture.
Relationships are established (Fig. 2) between the following actors: manufacturers, design consultants and public institutions, networks that rely on the SMEs and other entities innovative academic research and innovation.
Feedback related to these relationships can be measured using the results, namely the cluster‘s competitiveness.

Figure2: Relationship between TFC members
Source:The authors
Competitiveness in this case is the result of developments in the organization, of the region’s productivity and of regional and local institutions as a result of formal and informal communication and information well applied (Long, 2013).
The cluster’s competitiveness depends on many factors belonging to both of the external environment and internal environment.
Key capabilities are synthesized by generating competitive advantages in the context of internationalization of markets which involves strengthening and maintaining a favorable position in the market.
Knowledge of effective ways through which social capital will be stimulated in the cluster is a prerequisite to ensure the success of business process. Intelligence of networks lies in developing a complex social network that ensures maximum levels performance at Transylvanian Furniture Cluster.
One of the success factors in ensuring competitiveness cluster is social capital.
The importance of the social capital relays on its effectiveness in creating and maintaining a strong social network which shares information among all members inside and outside of the cluster.
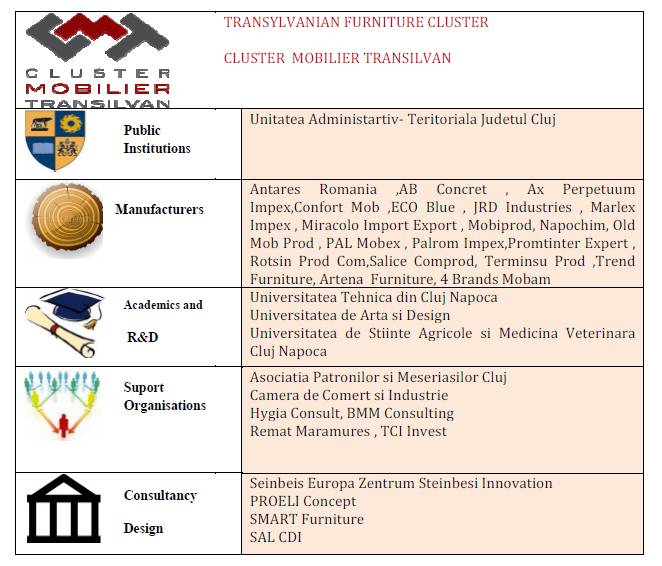
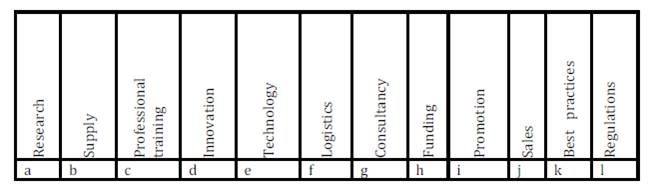
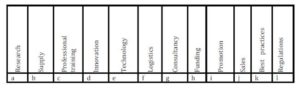
The regional model for Transylvanian Furniture Cluster has the following actors and local networks in respect with the case study, as presented in Table 1.
Table 1: Participant actors to Transylvanian Furniture Cluster
A survey upon the members of the cluster has been performed in order to establish the number and frequency between the members of the cluster
Research Data
A survey was applied on the 34 entities which form the Transylvanian Furniture Cluster. The questionnaire was designed so that it can check the number of links and the frequency of information between the cluster members. It was conducted on-line between September–November 2014
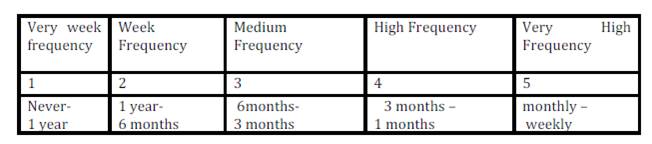
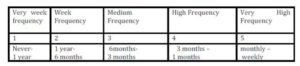
On a Lickert scale of 1 -5 which notes 1 =very week …5=very high, responses was achieved after a 34×34 matrix containing the aggregate scores of response items, which were completed with interviews. Thirty four managers-members of the cluster were interviewed between November–December 2014.
The three levels (1, 2, 3) of scale and the response options are presented in the tables below:
1. Frequency of Link
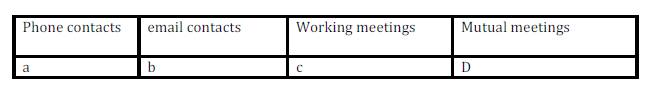
2. Type of Link

3. Scope of business Link
The research is analyzing and presents graphical methods on Transylvanian Furniture Cluster example the parameters effective obtained in the case of the small- worlds networks. In the modeling pattern the high performance parameters will be sought: max of Clustering coefficient, min.
of average path length, max. of degree of distribution.
Performance indicators revealed in the case study
The small-world network theory has been adapted to construct a random graph based on Erdős and Rény model (1958) and improved by Watts and Strogatz (1998
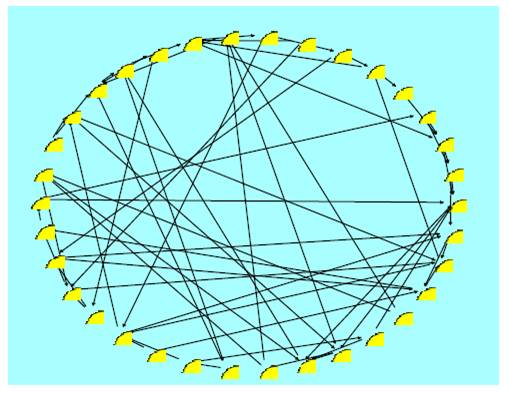
• Centrality
In graph theory and network analysis, centrality refers to indicators which identify the most important vertices within
a graph ( Hanneman and Riddle, 2011). (Fig.3)
Applications include identifying the most important actors in a social network, key infrastructure nodes.
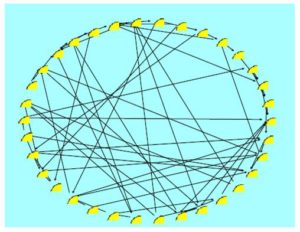
Figure 3: Plot of Small world graph Transylvanian Furniture Cluster
Centrality refers to a group of metrics that aim to quantify the “importance” or “influence” (in a variety of senses) of a particular node (or group) within a network. Centrality include between’s centrality, and degree centrality (Hanneman and Riddle, 2011).
A. Degree centrality
Degree centrality is the number of links incident upon a node. The degree can be interpreted in terms of the immediate risk of a node for catching whatever is flowing through the network (like some information).
B. Betweenness centrality- BC
Betweenness is a centrality measure of a node within a graph and indicates the number of times a node acts as a bridge along the shortest path between two other nodes.
The BC (betweenness centrality) of each actor can be interpreted as a measure of potential control as if how much that actor acts as an intermediary to others.
An actor which lies between many others is assumed to have a higher probability of being able to control information flow in the network.
In essence, BC assumes that communication in a network intervenes along the shortest possible path- the geodesic. Communication along non-geodesic paths between actors is out of it.
Through the analysis of social networking software SocNetV was built cluster networking chart of Transylvanian Furniture Cluster
The initial actors (member of cluster) are N=34 nodes and N*d/2 edges, where d is the mean edge degree. The even number d=4 is the mean edge degree each node will have β=0, 6 a parameter of probability of rewiring.
Results
GRAPH CLUSTERING COEFFICIENT (GCLC)
Range: 0 < GCLC < 1
GCLC = 0, when there are no cliques (i.e. a cyclic tree).
GCLC = 1, when every node and its neighborhood are complete cliques.
Clustering Coefficient Report
Average Clustering Coefficient= 0.0866- it shows a week Clustering Coefficient
Node 6 has the maximum Clustering Coefficient: 0.66
Node 5 has the minimum Clustering Coefficient: 0
All members of the TFC where indexed, number of node in this study corresponds to a member of the TFC.
Previously a clustering methodology (Radulescu,2014) was performed in order to determine the member’s correlation and position within the cluster.
A quantitative approach has been realized in previous works, in order to conclude about:
d = mean edge degree each node will have,
β = parameter of probability of rewiring.
The questionnaire applied to all members of the Cluster, relieved that there is a medium connectivity between members. (some pairs are disconnected).
The betweens centrality shows Max BC’ = 0.199 (node 20)
Min BC’ = 0 (node 3)
BC classes = 29
BC’ sum = 2.77
BC’ Mean = 0.0814
BC’ Variance = 0.00365
Node BC BC’ %BC’
1 83.2 0.0788 7.88
2 202 0.192 19.2
3 0 0 0
4 129 0.122 12.2
5 170 0.161 16.1
6 62.3 0.059 5.9
7 129 0.122 12.2
8 89.9 0.0851 8.51
9 0 0 0
10 124 0.117 11.7
11 59.8 0.0567 5.67
12 97.2 0.092 9.2
13 60.5 0.0573 5.73
14 0 0 0
15 64.3 0.0609 6.09
16 11 0.0104 1.04
17 104 0.098 9.8
18 0 0 0
19 90.7 0.0859 8.59
20 211 0.199 19.9
21 45.3 0.0429 4.29
22 159 0.151 15.1
23 16 0.0152 1.52
24 191 0.181 18.1
25 55.3 0.0524 5.24
26 126 0.12 12
27 0 0 0
28 64.2 0.0608 6.08
29 44 0.0417 4.17
30 99.3 0.0941 9.41
31 75.2 0.0712 7.12
32 136 0.129 12.9
33 11.6 0.011 1.1
34 210 0.198 19.8
GROUP BETWEENESS CENTRALISATION (GBC)
GBC = 0.122-it shows a good group betweens centralization
GBC range: 0 < GBC < 1
GBC = 0, when all the nodes have exactly the same betweenness index.
GBC = 1, when one node falls on all other geodesics between all the remaining (N-1) nodes.
AVERAGE SHORTEST PATH LENGTH
Average shortest path length=4.29394
GROUP DEGREE CENTRALISATION (GDC)
Max DC’ = 0.0606 (node 1)
Min DC’ = 0.0303 (node 17)
DC classes = 34
DC sum = 67
DC’ sum = 2.03
DC’ Mean = 0.0597
DC’ Variance = 2.62e-05
DC range: 0 < C < 33
DC’ range: 0 < C'< 1
GDC range: 0 < GDC < 1
GDC = 0, when all out-degrees are equal (i.e. regular lattice).
GDC = 1, when one node completely dominates or overshadows the other nodes.
Can be improved by optimization connectivity
Conclusions and discussions
The study is an example of applying patterns of Small-world networks in industrial clusters with respect to Transylvanian Furniture Cluster.
In the case of industries in which innovation, design, creation is a key factor for successful market development and maintenance, as the garment industry, footwear, furniture, etc. social relationship between cluster members and outside, will lead to a high speed for diffusion of information, when developing a new product a technology diffusion as an efficient action for testing consumer preferences.
Networking within a cluster is an important factor, for both development and further strengthening of the cluster.
The simulation has to undertake a various number of factors and risks.
The study is based on a social networking model and suggests with respect to the
Transylvanian Furniture Cluster that this is a dynamic model which suffers major changes according to the inputs and turbulence of the environment.
The results of the study regarding the main indicators: Clustering Coefficient and Centrality (Betweeness Centrality) conduct us to some recommendations and indicates the followings:
The Clustering Coefficient of a node quantifies how close the node and its neighbors are to being a clique. This is used to determine whether a network is a small-world or not. This option calculates and displays the clustering coefficients of all nodes
The questionnaire applied to all members of the Cluster, relieved that there is a medium connectivity between members. ( some pairs are disconnected). A higher frequency of changing information between the members of the cluster is needed. We strongly recommend an action plan of meetings scheduled at least twice a month.
The relationship between centrality nodes components can be shown about overall structure of a network. A very centralized network is dominated by very few nodes centrally positioned. If these nodes are removed or affected, the network will quickly fragment into several groups unconnected between them. Nodes located central can be points of weakness. Weak centralized networks better withstand attacks from the outside or accidents and not collapse rapid. In TFC, DC’ Mean = 0.0597. The network is weakly centralized. However a centralized network, considering only the actual members of the cluster in terms of BC, assumes that communication in a network occurs along the shortest possible path.
Betweeness Centrality in Transylvanian Furniture Cluster is weekly reprezented, no significant number of members takes the role of intermediary between others. This shows a negative aspect upon the decisions taken in the cluster. The situation might change a lot when is added or removed a vertex or an edge, BC is very sensitive to network dynamics. The study suggests that social networking is a very important process which can improve the TFC’s competitiveness. Trust and rapid spread of information between members of TFC enhance the exchanges of knowledge, innovation best and practices.
Social networking can become a strong tool to face intensity of competition between enterprises; an efficient way of cooperation between enterprises of the cluster; a path of extension of the cluster and related industries outside; information source of special request of the cluster’s products and services; cluster specific regulations;
The social networking represents the Cluster specific attitude towards the source of economic prosperity and of competitive advantage.
The model can face o lot of changes, due to its flexibility and represents a robust basis in the continuous improvement of the cluster’s competitiveness.
Acknowledgment
Special thanks for all members of the Transylvanian Furniture Cluster, Cluj- Napoca, Romania helping us to complete the survey on clustering analyzes.
(adsbygoogle = window.adsbygoogle || []).push({});
References
1. Borgatti,S., P., Everett, M., G.,Johnson,J.,C.,(2013),’Analyzing Social Networks’, Sage Publications Ltd.
Googlescholar
2. Eisingerich, A. B.; Bell, S.J.; Tracey, P. (2010), ’How Can Clusters Sustain Performance? The Role of Network Strength,Network Openness, and Environmental Uncertainty’. Research Policy. (39), pp., 239–253.
Publisher – Googlescholar
3. Erdős, P., Rényi, A.,(1959), ‘On Random Graphs.I’, Publicationes Mathematicae ,(6),pp.290–297,[Online],[Retrieved February 24.2016],http://www.renyi.hu/~p_erdos/1959-11.pdf.
Googlescholar
4. Giuliani, E., Pietrobelli, C., (2014), ’Social Network Analysis Methodologies for the Evaluation of Cluster Development Programs’, Centre for Innovation, Research and Competence in the Learning Economy, Lund University.
5. Hanneman, R.,A.,Riddle,M.,(2011),’Concepts and Measures for Basic Network Analysis’. The Sage Handbook of Social Network Analysis,SAGE Ltd. pp. 364–367.
Googlescholar
6. He,M.,Petoukhov,S.(2011),‘Mathematics of Bioinformatics: Theory, Methods and Applications’, Willey Publishing ,pp.143-147
Googlescholar
7. Iandoli L,et all, (2012), ’Knowledge exchange processes in Industrial Districts and the emergence of networks’, Central European Journal of Operations Research, 20 (2), pp 231-250.
Publisher – Googlescholar
8. Iammarino, S., McCann, P., (2006), ‘ The structure and evolution of industrial clusters: Transactions, technology and knowledge spillovers’, Research Policy, 35, pp. 1018-1036.
Publisher – Googlescholar
9. Long, D., (2013), ‘Delivering High Performance: The Third Generation Organization’, Grower Ltd.
10. Opsahl, T., (2009),’Clustering in two mode networks’, [Online],[Retrieved December 12, 2016], http://toreopsahl.com/2009/09/11/clustering-in-two-mode-networks.
11. Malecki,E.,J., (2002),’Hard and Soft Networks for Urban Competitiveness’, Urban Studies, 39,(5-6),pp. 929-945.
Published – Googlescholar
12. Rădulescu,C., (2004), ‘Competitivitatea IMM-urilor şi dezvoltarea regională’ ,Editura Risoprint, (ed), Cluj-Napoca
13. Radulescu,C.,Rădulescu,G.,M., (2006),’Guide concerning the cluster association of companies from less favored regions’, Proceedings of International Conference on Business, Management and Economic, İzmir, Turkey,pp.567-579.
14. Telesford,Q.,K.,et all, (2011), ‘The Ubiquity of Small-World Networks’, Brain Connect, Dec 2011; 1(5), pp.367–375.
Publisher – Googlescholar
15. Tanţău,A.,D.,coord., (2011), ‘Ghid de bună practică pentru clustere şi reţele de firme’, Print Group (ed), Bucureşti.
16. Wasserman, S., Faust, K., (1994), ‘Social Networks Analysis: Methods and Applications’. Cambridge University Press (ed).
Googlescholar
17. Watts, D., J., Strogatz, S., (1998),‘Collective dynamics of ‘small-world’ networks’, Nature 393, pp. 440–442.
18. Zima, L., A., Sabou, S., (2010), ‘Quality and the Consumer’, Studia Universitatis “Vasile Goldis” Arad, Seria Stiinte Economice, Issue 3, p. 59.