Introduction
Alterations of bone metabolism are a common long term complication in diabetic patients, including those treated with insulin. Although there is a controversy in the literature regarding the implication of such alterations, it is generally accepted that type 1 diabetes is associated with osteopenia, as stated by Tuominen et al. (1999), and type 2 diabetes is associated with increased bone mineral density, as shown by Barrett-Connor and Kritz-Silverstein (1996) and Stolk et al. (1996). Nevertheless, Auwerx et al. (1998), Muñoz-Torres et al. (1996), and Tuominen et al. (1999), found bone mineral density to decrease, and Wakasugi et al. (1993) reported it remained unchanged.
The impact of type 1 diabetes on bone metabolism involves several mechanisms. As described by Baylink et al. (1993) and Chiarelli et al. (2004), a decrease in local levels of IGF-1 would cause a decrease in bone formation. According to Luet al. (2003), another factor that compromises osteoblast differentiation is the decreased expression of transcription factors involved in its regulation, such us Cbfa1/Runx-2 and Dlx5. In addition, it is well documented that insulin is essential to osteoblast function, as well as to chondrogenesis and collagen synthesis, as reported in the Editorial of Journal Bone; Diabetes and fragility fractures – A burgeoning epidemic? Bone, (2008).
Bouillon (1991) found streptozotocin-induced type 1 diabetic rats to show a decrease in bone remodeling. Goodman and Hori (1984) and Inzerillo and Epstein (2004) also observed a decrease in the number of osteoclasts.
It is well known that insulin treatment reverses, at least in part, the effects of hyperglycemia, so that strict insulin therapy normalizes glycemia levels. A study by Hofbauer et al. (2007) demonstrated the anabolic effect of insulin on bone tissue. Nevertheless, there are bone alterations that manifest even in diabetic patients on strict insulin regimens, and even at an early age, as reported by Guarneri et al. (1993) and Hofbauer et al. (2007).
Little is known about the early response of bone metabolism to hyperglycemia caused by poor compliance with treatment or inadequate control of diabetes. Moreover, there are no studies comparing the early and long term effects of diabetes on endochondral ossification. Our hypothesis was that diabetes-induced bone alterations manifest soon after the onset of the disease, even when they have not been noticed by the patient or have not become clinically evident.
Based on the above, the aim of the present study was to histomorphometrically evaluate the growth cartilage and subchondral bone of male Wistar rat tibia shortly after experimentally inducing type 1 diabetes.
Materials and Methods
Thirty-five male Wistar rats were assigned to one of five groups of 7 rats each.
Group A: Control animals
The animals in the experimental groups were treated according to the following protocols:
Group B: Induction of diabetes; euthanasia at one week.
Group C: Induction of diabetes plus insulin treatment; euthanasia at one week.
Group D: Induction of diabetes; euthanasia at six weeks.
Group E: Induction of diabetes plus insulin treatment; euthanasia at six weeks.
All the animals received rat chow and water “ad libitum”.
At the onset of the experiment, the animals in groups A, D and E were 6 weeks old, and those in groups B and C were 11 weeks old. The average weight at baseline was 115 g in groups A, D, and E and 240 g in groups B and C. All the animals were euthanized at the age of 12 weeks. The average final body weight was 268 g in Group A, 215 g in Group B,255 g in Group C, 180 g in Group D, and 315 g in Group E.
Diabetes was induced by administration of a single intraperitoneal injection of 60 mg/kg of body weight of streptozotocin (STZ) (SIGMA-ALDRICH, Inc., Saint Louis, USA) dissolved in freshly prepared citrate buffer, pH 4.0. The animals in the control group received an equivalent volume of citrate buffer. Twenty-four hours post-injection, blood samples were obtained from all the animals in order to determine blood glucose levels, according to the glucose-oxidase method, using Accu-Chek Sensor Comfort test strips (Roche Ltda. products , Santiago, Chile) in an Accu-Chek Sensor (Roche Diagnostics GMBH, Mannheim, Germany).
All the animals showing blood glucose levels above 250mg/dl were included in the study as diabetic rats. Likewise, control animals were checked to confirm their blood glucose levels were below 120 mg/dl. Glycemia was monitored weekly in non-treated experimental diabetes rats, and every 48 h in the insulin-treated experimental diabetes groups. The body weight of each animal was recorded every 24 h using an Ohaus CS2000 digital weighing scale (Ohaus Corp., N.J., USA).
Two days after inducing diabetes, the animals in experimental groups C and E were initiated on treatment with subcutaneously injected human insulin NPH: recombinant DNA origin (Humulin N, Eli Lilly and Compañía de México, S.A de C.V. Mexico D.F.) 100 IU of Protamina Zinc/ml. The daily insulin dose ranged from 6-20 IU/kg body weight. Subcutaneous administration was performed at the level of the neck fold between 7:00 am and 10:00 am. Treatment requirements were adjusted daily according to periodic quantitative determinations of blood glucose levels and daily follow up of body weight.
All the animals were the same age when euthanized. Euthanasia was performed by intraperitoneal injection of a solution of 150 mg/kg body weight of sodium thiopental (Pentovent, 49 Richmond Laboratories, Buenos Aires, Argentina) and 3 mg/kg body weight of acepromazine maleate (Acedan, Holliday-Scott S.A., Buenos Aires, Argentina).
Immediately following euthanasia, the tibiae were resected, dissected, fixed in formalin buffer (ph 7.0), decalcified in 10% EDTA (ph 7.0) for 30 days, and embedded in paraffin. Longitudinal sections of the proximal end of the paraffin embedded tibiae were obtained and stained with hematoxylin-eosin.
Histomorphometry
The histomorphometric study was performed based on the stereologic principles stated by Weibel (1967), which allow evaluating the three-dimensional microstructure of a histological tissue section based on the analysis of the two-dimensional information observed in the slice. The method by Dalle Carbonare published in the review on Bone Microarchitecture (2005) was used here.
The histological sections were digitally photographed using a Carl Zeiss Axioskop 2 light photomicroscope (Carl Zeiss Mikroskopic, Jena, Germany) equipped with a 5X objective and a Canon Powershot A640 digital camera with a resolution of 10.0 Megapixels and optical zoom of 4X (Canon Inc., China). The histomorphometric study was performed using Pro-Plus 4.0 image analysis software.
Epiphyseal cartilage determinations: The parameters were measured in the 1600 µm area corresponding to the mid-epiphyseal region. Epiphyseal cartilage width was measured at 9 sites 200 μm apart and perpendicularly to the chondro epiphyseal junction (Figure 1). Proliferative cartilage width, hypertrophic cartilage width, and total cartilage width were determined. Values corresponding to each animal were averaged and expressed in μm.
Figure 1: The Lines Show the Sites Where Epiphyseal Cartilage Width was Determined. As Shown in the Figure, Measurements were Performed from the Middle Caudal Region of the Epiphyseal Cartilage
Subchondral bone determinations: Measurements were performed in the subchondral bone tissue in a 5.2 x 106 µm2 area (Figure 2); this was the area considered to define tissue volume (TV), and used to measure all histomorphometric bone parameters.
Figure 2: Areas Where the Histomorphometric Parameters were Measured. Note the Areas are Located in the Middle Region below the Epiphyseal Cartilage
The following parameters were studied:
-Tibial subchondral bone volume (Bone Volume/Tissue Volume-BV/TV: %), defined as the fraction of total volume corresponding to trabecular bone.
-Trabecular area (TA: mm2) Defined as the sum of the areas containing bone trabeculae.
– Bone surface: Defined as the sum of the perimeter of all trabeculae (Bone Surface-BS: mm)
– Trabecular Number (Tb.N: 1/mm)
– Trabecular Thickness (Tb.Th; µm)
– Trabecular Separation (Tb.Sp:µm)
The results were statistically analyzed using one way analysis of variance and Bonferroni’s multiple comparisons test. Statistical significance was set at a value of p< 0.05.
Results
Histomorphometric Determinations of the Epiphyseal Cartilage
Total epiphyseal cartilage width was significantly lower in experimental animals compared to controls. The difference was more marked in late-stage than in early-stage diabetic rats, and was less marked in insulin-treated than in non-insulin treated animals. Proliferative cartilage and hypertrophic cartilage widths were also lower in experimental animals compared to matched controls, but only the differences in proliferative cartilage reached statistical significance (Figure 3).
Figure 3: Total Growth Cartilage Width was Significantly Lower in All the Experimental Groups as Compared to the Control Group; Proliferative Cartilage and Hypertrophic Cartilage Widths were Also Lower in Experimental Animals Compared to Controls, but Only the Differences in Proliferative Cartilage Width Reached Statistical Significance
Histomorphometric Parameters of Bone:
– Tibial subchondral bone volume (BV/TV): Bone volume was lower in all the experimental groups compared to controls; the difference only reached statistical significance in Group D. Bone volume was higher in insulin-treated diabetic rats than in non-treated rats, though the difference only reached statistical significance when comparing Groups D and E (Figure 4).
Figure 4: Tibial Subchondral Bone Volume was Significantly Lower in Diabetic Animals in Group D than in Controls. Bone Volume was Significantly Lower in Group D than in Insulin-Treated Group E, and Did Not Differ Significantly between the Latter and Controls (Group A)
-Trabecular area: The results followed the same pattern as the bone volume results, and are shown in Figure 5.
Figure 5: Trabecular Area was Significantly Smaller in Group D as Compared to Group A (Controls) and Group E, and was Not Significantly Different between the Two Latter Groups
– Number of trabeculae: The results followed a similar pattern to that of trabecular area, as shown in Figure 6.
Figure 6: Trabecular Number was Lower in All Experimental Animals Compared to Controls; the Difference Only Reached Statistical Significance in Group D.
– Trabecular microarchitecture: Although trabecular separation was found to increase in all experimental groups as compared to controls, only the increase in group D was statistically significant compared to the increases observed in the remaining groups. Trabecular Thickness in all the experimental groups was similar to that observed in controls. Both parameters are shown in Figure 7.
Figure 7: No Differences in Trabecular Thickness were Observed among Experimental Groups; Nevertheless, Trabecular Separation was Significantly Greater in Group D Compared to the Other Groups
Histological images are shown in Figure 8.
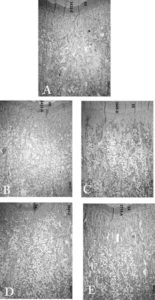
Figure 8: Frontal Sections of the Proximal End of the Tibia. (A): Control; (B): Induction of Diabetes; Euthanasia at One Week; (C): Induction of Diabetes Plus Insulin Treatment; Euthanasia at One Week; (D): Induction of Diabetes; Euthanasia at Six Weeks; (E): Induction of Diabetes Plus Insulin Treatment; Euthanasia at Six Weeks. Growth Cartilage Width was Lower in Diabetic Animals in Groups (B) and (D) than in Controls (A), and was Similar in Groups (C) and (E) and Controls (A). There were Fewer Subchondral Bone Trabeculae in Diabetic Groups (B) and (C); Trabeculae were More Spaced, and Shorter than Control Trabeculae (A). Trabeculae in Insulin-Treated Diabetic Group (E) were Similar to those of Controls (A)
Discussion
The results of the present study showed that tibial subchondral bone volume and epiphyseal cartilage width were significantly lower in short term and long term diabetic rats than in control rats. In both cases insulin treatment prevented these alterations, and values were similar to controls.
The experimental model used here to study early diabetes-related events has been validated by several authors, including Olubadewo and Spitzer (2003) who indeed used it to study immunologic alterations, and Wald et al. (1998), who used it to study cholinergic neurotransmission. It was used in the present work to study early diabetes-related changes in a long bone, before systemic compensatory mechanisms that tend to normalize the metabolic alteration are triggered. According to Villarino et al. (2010), the model in alveolar bone is also useful to analyze responses to occasional transient hyperglycemia that can occur in diabetic patients when control of diabetes is inadequate or compliance with treatment is poor. This is the first study to demonstrate the occurrence of microstructural alterations in the epiphyseal cartilage and bone in rats shortly after the diabetic induction, and that rapid administration of insulin prevents the decrease in bone volume, suggesting its preventive effect against the aforementioned alterations.
The late changes observed in bone in non-treated animals in the present study are similar to those reported by Hamada et al. (2007). The latter authors observed a decrease in static and dynamic parameters of bone activity and in bone volume, which reversed with insulin therapy. Our results are also in keeping with those of Thrailkil et al. (2005), who reported a significant decrease in bone formation in chronic diabetic mice, which also reversed with insulin therapy. Clinical and experimental studies conducted by Bouillon (1991) and Thrailkill et al. (2005) demonstrated decreased osteoblast function in diabetes. Duarte et al. (2005) studied biochemical, histomorphometrical and densitometric alterations in diabetic rats up to 120 days after the induction of diabetes, and concluded that osteopenia ensues is related to the duration of the illness.
As stated by Vestergaard (2007), Janghorbani et al. (2007) and Miao et al. (2005), it is known that type 1 diabetic patients are at a 6 or 7-fold higher risk of hip fracture than the non-diabetic population. Our experimental studies on trabecular microarchitecture at the level of subchondral bone, involving evaluation of trabecular number, width, and separation, showed that all the parameters studied here were lower in diabetic animals, except for trabecular thickness, which remained unchanged. The alterations in bone microarchitecture explain the increased risk of long bone fracture in diabetic patients.
Although Strotmeyer et al. (2006) and Mastrandrea et al. (2008) observed decreased BMD (Bone Mineral Density) in patients with type 1 diabetes and suggested that the decrease may partly explain the increased fracture risk, according to Vestergaard (2007) it would not be the only causal factor involved in diabetes-related skeletal fragility. As explained by Armas et al. (2011), measurements of bone quality, such as variations in bone remodeling rates and defects in bone microarchitecture like those shown in the present study, may provide a better explanation for the observed increase in fracture risk.
The structural alterations observed in long bones in untreated long term diabetic rats are the consequence of early changes in the growth cartilage that manifest as a decrease in cartilage width, which in turn leads to alterations in bone microarchitecture. This finding is due to a decrease in trabecular number and an increase in trabecular separation, despite trabecular thickness remaining unchanged. It is therefore essential to highlight the importance of early detection and prompt treatment of the disease, particularly in the pediatric population.
Conclusions
The alterations in bone metabolism manifest in long bones very early in the course of diabetes. It would seem advisable to analyze bone response as soon as possible once the disease has been diagnosed, in order to initiate treatments aimed at preventing major alterations in bone architecture.
Acknowledgements
This study was funded by Grant UBACYT 20020100100196. The authors especially thank histotechnician Mariela Lacave for her assistance.
The study was approved by the Ethics Committee of the School of Dentistry, University of Buenos Aires (Nº FOUBA. UBACYT 2011-2014-3), and was performed in keeping with the National Institutes of Health Guidelines for the Care and Use of Laboratory Animals (NIH publication 85-123 Rev. 2010).
References
Armas, L. A. G., Akhter, M. P., Drincic, A. & Recker, R. R. (2012). “Trabecular Bone Histomorphometry in Humans with Type 1 Diabetes Mellitus,” Bone, 50 (1) 91-96.
Publisher – Google Scholar
Auwerx, J., Dequeker, J., Bouillon, R., Geusens, P. & Nijs, J. (1988), “Mineral Metabolism and Bone Mass at Peripheral and Axial Skeleton in Diabetes Mellitus,” Diabetes, 37 (1) 8-12.
Publisher – Google Scholar
Barrett-Connor, E. & Kritz-Silverstein, D. (1996). “Does Hyperinsulinemia Preserve Bone?,” Diabetes Care, 19 (12) 1388—1392.
Publisher – Google Scholar
Baylink, D. J., Finkelman, R. D. & Mohan, S. (1993). “Growth Factors to Stimulate Bone Formation,” Journal of Bone and Mineral Research, 8(S 2) 565—572.
Publisher – Google Scholar
Bouillon, R. (1991). “Diabetic Bone Disease,” Calcified Tissue International, 49 (3) 155-160.
Publisher – Google Scholar
Chiarelli, F., Giannini, C. & Mohn, A. (2004). “Growth, Growth Factors and Diabetes,” European Journal of Endocrinology, 151 (3) 109-117.
Publisher – Google Scholar
Dalle Carbonare, L., Valenti, M. T., Bertoldo, F., Zanatta, M., Zenari, S., Realdi, G., Lo Cascio, V. & Giannini, S. (2005). “Bone Microarchitecture Evaluated by Histomorphometry,” Micron, 36;(7-8) 609-616.
Publisher – Google Scholar
Ding, K. H., Wang, Z. Z., Hamrick, M. W., Deng, Z. B., Zhou, L., Kang, B., Yan, S. L., She, J. X., Stern, D. M., Isales, C. M. & Mi, Q. S. (2006). “Disordered Osteoclast Formation in RAGE-Deficient Mouse Establishes an Essential Role for RAGE in Diabetes Related Bone Loss,” Biochemical and Biophysical Research Communications, 340 (4) 1091-1097.
Publisher – Google Scholar
Duarte, V. M. G., Ramos, A. M. O., Rezende, L. A., Macedo, U. B., Brandão-Neto, J., Almeida, M. G. & Rezende, A. A. (2005). “Osteopenia: A Bone Disorder Associated with Diabetes Mellitus,” Jounal of Bone and Mineral Metabolism, 23 (1) 58-68.
Publisher – Google Scholar
Epstein, S. & Leroith, D. (2008). “Diabetes and Fragility Fractures – A Burgeoning Epidemic?,” Bone, 43 (1) 3-6.
Publisher – Google Scholar
Goodman, W. G. & Hori, M. T. (1984). “Diminished Bone Formation in Experimental Diabetes. Relationship to Osteoid Maturation and Mineralization,” Diabetes, 33 (9) 825—831.
Publisher – Google Scholar
Guarneri, M. P., Weber, G., Gallia, P. & Chiumello, G. (1993). “Effect of Insulin Treatment on Osteocalcin Levels in Diabetic Children and Adolescents,” Journal of Endocrinologycal Investigation, 17 (7) 505-509.
Publisher – Google Scholar
Hamada, Y., Kitazawa, S., Kitazawa, R., Fujii, H., Kasuga, M. & Fukagawa, M. (2007). “Histomorphometric Analysis of Diabetic Osteopenia in Streptozotocin-Induced Diabetic Mice: A Possible Role of Oxidative Stress,” Bone, 40 (5) 1408-1414.
Publisher – Google Scholar
Hofbauer, L. C., Brueck, C. C., Singh, S. K. & Dobnig, H. (2007). “Osteoporosis in Patients with Diabetes Mellitus,”Journal of Bone and Mineral Research, 22 (9) 1317-1328.
Publisher – Google Scholar
Inzerillo, A. M. & Epstein, S. (2004). “Osteoporosis and Diabetes Mellitus,” Reviews in Endocrine and Metabolic Disorders, 5 (3) 261—268.
Publisher – Google Scholar
Janghorbani, M., Van Dam, R. M., Willett, W. C. & Hu, F. B. (2007). “Systematic Review of Type 1 and Type 2 Diabetes Mellitus and Risk of Fracture,” American Journal of Epidemiology, 166 (5) 495-505.
Publisher – Google Scholar
Lu, H., Kraut, D., Gerstenfeld, L. C. & Graves, D. T. (2003). “Diabetes Interferes with the Bone Formation by Affecting the Expression of Transcription Factors that Regulate Osteoblast Differentiation,” Endocrinology, 144 (1) 346-352.
Publisher – Google Scholar
Mastrandrea, L. D., Wactawski-Wende, J., Donahue, R. P., Hovey, K. M., Clark, A. & Quattrin, T. (2008). “Young Women with Type 1 Diabetes Have Lower Bone Mineral Density that Persists over Time,” Diabetes Care, 31 (9) 1729-1735.
Publisher – Google Scholar
Miaio, J., Brismar, K., Nyrén, O., Ugarph-Morawski, A. & Ye, W. (2005). “Elevated Hip Fracture Risk in Type 1 Diabetic Patients: A Population-Based Cohort Study in Sweden,” Diabetes Care, 28 (12) 2850-2855.
Publisher – Google Scholar
Munoz-Torres, M., Jódar, E., Escobar-Jiménez, F., Lopez-Ibarra, P. J. & Luna, J. D. (1996). “Bone Mineral Density Measured by Dual X-Ray Absorptiometry in Spanish Patients with Insulin-Dependent Diabetes Mellitus,” Calcified Tissue International, 58 (5) 316—319.
Publisher – Google Scholar
Olubadewo, J. O. & Spitzer, J. A. (2003). “Immune Response Modulation in Acutely Ethanol-Intoxicated, Acutely Diabetic Male and Female Rats,” Alcohol, 31 (3) 137-147.
Publisher – Google Scholar
Schwartz, A. V. (2003). “Diabetes Mellitus: Does It Affect Bone?,” Calcied Tissue International, 73 (6) 515-519.
Publisher – Google Scholar
Stolk, R. P., Van Daele, P. L. A., Pols, H. A. P., Burger, H., Hofman, A., Birkenhäger, J. C., Lamberts, S. W. & Grobbee, D. E. (1996). “Hyperinsulinemia and Bone Mineral Density in an Elderly Population: The Rotterdam Study,”Bone, 18 (6) 545—549.
Publisher – Google Scholar
Strotmeyer, E. S., Cauley, J. A., Orchard, T. J., Steenkiste, A. R. & Dorman, J. S. (2006). “Middle-Aged Premenopausal Women with Type 1 Diabetes Have Lower Bone Mineral Density and Calcaneal Quantitative Ultrasound than Nondiabetic Women,” Diabetes Care, 29 (2) 306-311.
Publisher – Google Scholar
Thrailkill, K. M., Liu, L., Wahl, E. C., Bunn, R. C., Perrien, D. S., Cockrell, G. E., Skinner, R. A., Hogue, W. R., Carver, A. A., Fowlkes, J. L., Aronson, J. & Lumpkin, C. K. Jr. (2005). “Bone Formation Is Impaired in a Model of Type 1 Diabetes,” Diabetes, 54 (10) 2875-2881.
Publisher – Google Scholar
Tuominen, J. T., Impivaara, O., Puukka, P. & Rönnemaa, T. (2009). “Bone Mineral Density in Patients with Type 1 and Type 2 Diabetes,” Diabetes Care, 22 (7) 1196-1200.
Publisher – Google Scholar
Vestergaard, P. (2007). “Discrepancies in Bone Mineral Density and Fracture Risk in Patients with Type 1 and Type 2 Diabetes – A Meta-Analysis,” Osteoporosis International, 18 (4) 427-444.
Publisher – Google Scholar
Villarino, M. E., Lewicki, M. & Ubios, A. M. (2011). “Bone Response to Orthodontic Forces in Diabetic Wistar Rats,”American Journal of Orthodontic and Dentofacial Orthopaedics, 139 (4) 76-82.
Publisher – Google Scholar
Vogt, M. T., Cauley, J. A., Kuller, L. H. & Nevitt, M. C. (1997). “Bone Mineral Density and Blood Flow to the Lower Extremities: The Study of Osteoporotic Fractures,” Jornal of Bone and Mineral Research, 12 (2) 283—289.
Publisher – Google Scholar
Wakasugi, M., Wakao, R., Tawata, M., Gan, N., Koizumi, K. & Onaya, T. (1993). “Bone Mineral Density by Dual Energy X-Ray Absorptiometry in Patients with Non-Insulin-Dependent Diabetes Mellitus,” Bone, 14 (1) 29—33.
Publisher – Google Scholar
Wald, M. R., Borda, E. S. & Sterin-Borda, L. (1998). “Participation of Nitric Oxide and Cyclic GMP in the Supersensitivity on Acute Diabetic Rat Myocardium by Cholinergic Stimuli,” Biochemic Pharmacology, 55 (12) 1991-1999.
Publisher – Google Scholar
Weibel, E. R. & Elias, H. (1967). ‘Quantitative Methods in Morphology,’ Springer Verlag, Berlin-Heidelberg- New York.
Google Scholar