Introduction
Store price image is an important variable in retailing. Retailers deliver several price-focused messages with a unique aim: conveying an attractive price image for consumers (Chezy et al., 2008). However, few studies focus on store price image in its entirety. While the Tunisian retailing business is evolving in a very competitive atmosphere, different sales formats are channelled and two competition levels can be distinguished; an intra-type competition which opposes two stores using the same sales format and inter-type competition which practises different retailing formats. Thus, studying price image in all these domains is a very interesting endeavour (Hamilton and Chemev, 2010).
Indeed, the emergence of new retailing sales formats and methods induced changes in purchasing habits and generated new behaviors and demands from consumers. Thus, the price strategies practised by retailers have diversified because of an intense competitive environment. Facing this diversified offer, retailers evaluate and select those which allow them to score a real advantage, i.e. offering the best price. This state of affairs highlights the need to study price image from consumers’ perspective. This concept allows apprehending the general perception of price beyond simply knowing objective prices.
Price image which refers to expensiveness notion is a complex concept. Expensiveness is not evaluated in the same way by all consumers and for all sales formats (Hamilton and Chemev, 2010). The measures proposed in the literature are mostly unidimensional and do not consider the richness of the concept. Consequently, the construction of a price image measurement instrument adapted to our context is the first objective of this study. This study aims as well at comparing between price image perception of two sales formats.
Review of the Literature
Defining Price Image
Like the concept of image in its broadest sense, price image has similar characteristics. Its specificity lies in highlighting the variable price in the consumers’ process of perceiving a store. It relates to the global expensiveness of a store and is founded on the notion of average price. Retailers use the term “price image” as a synonym to “price positioning” (Zielke, 2006). The concept is even confused with notions like price perception, price knowledge and average price (Ladwein, 1995), objective price (Simester, 1995), amount of cash paid (Buyukkurt and Buyukkurt, 1986) and price level (Desai and Talukdar, 2003).
Moreover, the few proposed approaches to this concept do not define it in a uniform fashion. They differ in terms of research discipline and analysis object. Indeed, most research disciplines either focus on the product or the product range (Ladwein, 1995).
Price image is then often defined in terms of its measurement (e.g. cash paid) or in terms of a given research discipline. Furthermore, several authors define price image as an attitude towards proposed prices. However, Zeilke (2006) distinguishes between image and attitude. According to this author, image is a profound notion. Price image is “the set of feelings and beliefs which are stored in memory. By means of this set the customer may derive a global evaluation of prices” (Zeilke, 2006).
Coutelle (1998) defines price image in terms of its characteristics. Indeed, if price image is often considered one dimension of image, it may be studied as a separate concept in its own (Gijsbrecht, 1993 ; Coutelle, 2000). Price image is presented as a global concept (Oxenfeldt, 1974-1975; Dichter, 1985; Zimmer and Golden, 1988), as a price level (Petroshius and Monroe, 1987, Desai and Talukdar, 2003) and relative in its nature (Buyukkurt and Buyukkurt, 1986 ; McGoldrick and Marks, 1987).
After reviewing the literature on price image, Coutelle (1998) retains a definition of price image according to which “price image is a global representation of a relative level of store prices”. This definition seems the most thorough since it highlights price image characteristics”. This definition allows us to distinguish this notion from other close notions.
Price Image Dimensions
Store image is considered by most authors as a multidimensional concept (kunkel and Berry, 1968 ; Lindquist, 1974-1975 ; Keaveney and Hunt, 1992). The concept dimensions mainly relate to store attributes: price, quality, service,… etc. Price image concept seems more restrictive than image concept. Yet, price is not determined in the same way by consumers and suggests its multidimensional nature.
The review of the literature on this concept mainly refers to the notion of store expensiveness. Many elements characterize this expensiveness notion (Buykkurt and Buyukkurt, 1986; Mc Goldrick and Marks, 1987; Cox and Cox, 1990, Coutelle, 1998; Hamilton and Chemev, 2010).
This arithmetic is difficult to do by consumers who misremember prices following a frequent change in prices. Thus, many elements prevent consumers from calculating an expensiveness index which proves that they tend to use other elements to evaluate prices, i.e. price image.
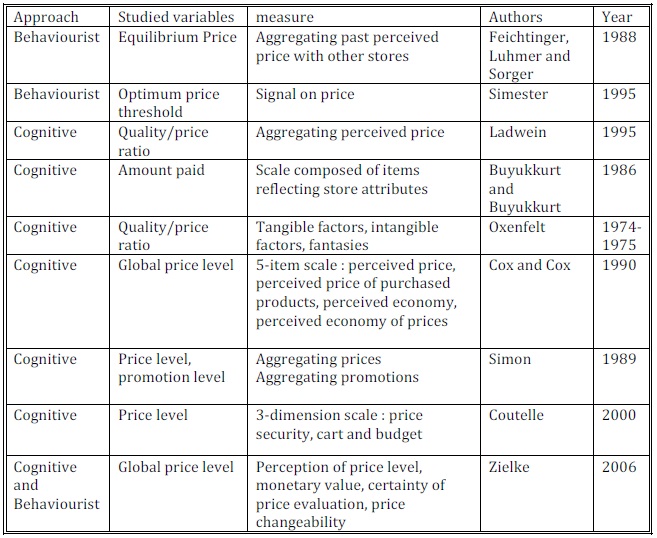
In the literature, price image is measured by price through the quality/price ratio as well as by product cart purchased by consumers (Coutelle, 2000). Table 1 summarizes store price image dimensions proposed in the literature.
Table 1: Price Image Dimensions Proposed in the Literature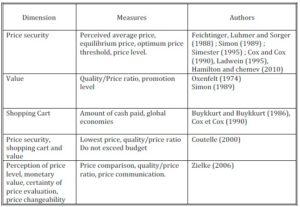
Measures of Price Image
Measures may be distinguished according to the following theories: behaviourism and cognitivism. Indeed, these two theories have different approaches of characterizing individuals’ responses to stimuli. Consumers, when they form a price image, are conditioned by these stimuli and their responses vary according to the intervention or non-intervention of their internal psychological processes (Dubois, 1994, p86).
Behaviourist measures of price image: Behaviourist approach to learning presumes a direct stimulus/response relationship. It does not consider internal psychological processes which relate stimulus to response, but rather it measures strength of association between both of them. Behaviourist price image measures model store attributes or marketing policy and relates them to price image. These measures try to determine an optimum price image threshold. In the short-run, prices affect purchased quantities in the store and in the long-run they influence price image which in turn influences store visits (Feichtinger, Luhmer and Sorger, 1988).
The equation paradigm which relates communication and profit advances that an optimum threshold of price image varies
according to price information available to consumers. Indeed, if consumers can compare prices, it is necessary to have prices below the other stores average. In the opposite case where consumers are unable to compare prices, a signal on the price or several products is enough to indicate that the store has reached an optimum threshold of price image (Simester, 1995).
The stimuli (price reductions or signals on products) allow for determining in function of information available to consumers the optimum price image threshold. Consequently, the response depends uniquely on stimuli variation and degree of information available to consumers, yet it does not recall their cognitive reasoning.
Only one dimension is retained to measure price image; it is price level called price equilibrium (Feichtinger, Luhmer and Sorger, 1988) or else optimum threshold (Simester, 1995).
These specifications are not empirically validated on consumers. Store attributes are fixed and they do not translate the real price image conditions.
Cognitive measurement of price image: This approach involves personal evaluation in measuring price image. We can distinguish two schools of thoughts under this approach: The first relates to price: the obtained measures are the perceived average price and global price level (Ladwein 1995, Cox and Cox, 1990). According to proponents of this theory, the consumer evaluates price image by making a global judgement uniquely using price-related elements.
The second considers store attributes other than price and measures price image in terms of these attributes (Oxenfelt, 1974; Buyukkurt and Buyukkurt, 1986).
Table.2 summarizes the studies focusing on price image measurement.
Table 2: Results on Price Image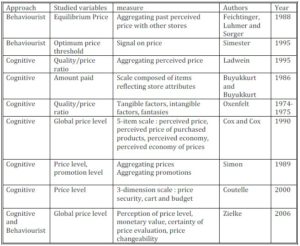
Table.2 shows that most studies are concerned with price image money dimension (global price level, promotion, amount paid) while neglecting the non-monetary dimension of price image (quality, offer value, price security). Exceptions are the studies of Coutelle (2000) and Zielke (2006) who considered these two aspects of price image.
Critiques of Existing Scales
Most studies are often unidimensional (Feichtinger et al 1988 ; Ladwein, 1995 ; Simester, 1995). Even if reliability and validity of the scales are empirically validated by Buykkurt and Buykkurt (1986); Feichtinger et al (1988) ; Simon (1989) ; Cox and Cox (1990) ; Simester (1995) and Coutelle (2000), these scales are unidimensional and adapted to specific cultural contexts.
However, Desmet (2005) used two dimensions of price image « low price » and « good deal » with an alpha coefficient equal to 0,65 for the first dimension and 0,71 for the second. These two dimensions reproduce only the monetary aspect of price image. There is another study which verified the multidimensionality of price image (Coutelle, 2000)1 and used both monetary and non-monetary dimensions. However, this study was conducted on a virtual store selling food.
1 A recent study by Zielke (2006) considered price image multidimensional and identified five dimensions of price image.
Research Methodology
The choice of products to study store price image must meet the following characteristics:
- First, the to be-selected products must be marketed in both specialised and non-specialised stores
- Then, we must choose products with the advantage of satisfying the functional, symbolic and diversified needs of consumers (Whan Park et al. 1989)
Several product categories respond to these criteria:
- fashion items (clothes, lingerie, accessories …)
We retained perfumes and cosmetics for this study. Data was collected in two stores; a specialised store and a non-specialised store selling uniquely cosmetic products and perfumes.
« FATALES » was selected as a specialised store category. It is a chain store with many outlets across Tunisia. Moreover, it is well known and frequently visited by Tunisians. It has been decided with the manager to conduct the final stage of the study at the El Manar outlet; a most frequently visited outlet. Thus, 252 questionnaires were collected.
The second survey was conducted in Geant hypermarket. The choice of this hypermarket is justified on the following grounds:
It is a frequently-visited hypermarket.
It sells different varieties of cosmetic products of many brands and at different prices.
The survey was conducted at the cosmetic products and perfumes section during a month and a half. In total, a number of 315 questionnaires was collected.
Store Price Image Measurement Scale
The Exploratory Study
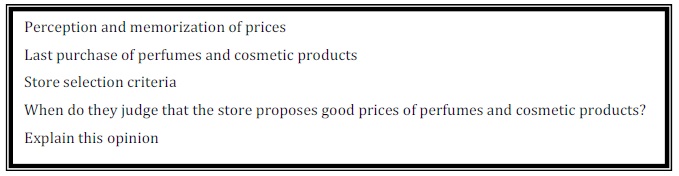
In order to generate a first pool of items, we conducted a series of 12 semi-directed interviews. Homogeneous population was opted for to increase external validity. The 12 interviews helped us reach a threshold of theoretical plausibility. The interviews were recorded, transcribed and processed in terms of a content analysis.
The main objective is to identify consumers’ opinions concerning price global levels proposed by the store. Specifically, we sought to determine the elements that consumers consider while forming opinions on prices and on the way they define price image. To ensure a better representation of the targeted audience, we varied our population according to their socio-demographic characteristics. The elements taken into consideration while selecting our sample are gender, age, income and socio-professional situation.
The content of our interviews during this exploratory phase mainly contain the themes presented in the following figure:
Box 1: Interview Content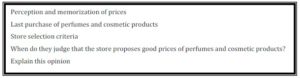
The experts used a 5-point scale to evaluate wording quality and redundancy of the items. The items which met the following criteria are retained:
None of the experts judged the item as less or not at all adapted to price image measurement.
None of the experts judged the item as poorly-worded (in the case of the two redundant items, only the item which was positively judged by experts is retained).
Results of the Exploratory Study
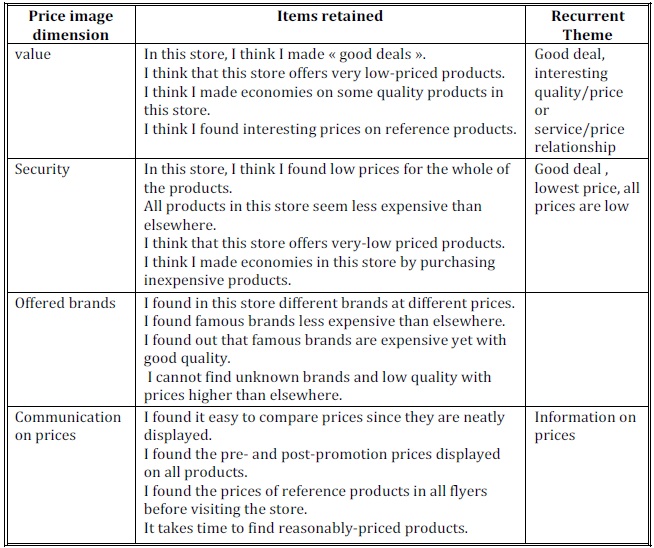
Price image is a multidimensional concept. Accordingly, price has two main roles: a positive role related to price/quality relationship and a negative role for the sacrifice it needed. The results are reported in the following table.
Table 3: Definition of Store Price Image Given by Tunisian Consumers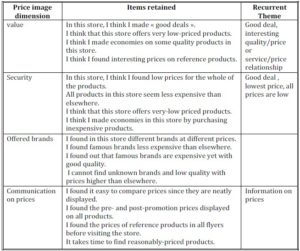
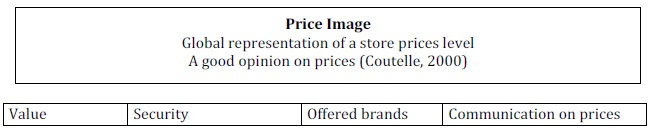
Figure.1 highlights the dimensions retained by the exploratory study
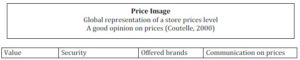
Figure 1: Price Image Dimensions Generated by the Exploratory Study
The “security price” dimension retained from the exploratory phase states that price image is uniquely founded on products prices. The number of purchased products is not taken by this dimension (except for the study of Coutelle, 2000). All considered prices should have a homogeneous level inferior to that of stores in a way to assure consumers. Moreover, “security price” image and “communication price” image have been proven to be important store selection criteria (Zielke, 2006). The second dimension “value” considers products prices in relation to quality. This means that consumers do not seek low prices, rather a good quality/price ratio. The dimension “offered brands” relates to product range. In this regard, Jallais et al (1994) point out that perceived range level influences store price image formation. According to Cox and Cox (1990) and Guillermo and Schleicher (2006), a store with many unknown brands creates a low price image.
The dimension “price communication” relates to easily available information on price to compare between store and competitors prices. The combination of these dimensions allows for assessing perceived store global expensiveness; hence the store price image. Determining the fundamental dimension of price image formation allows retailers adapt their marketing policy in a way to coordinate price image as perceived by consumers and price image wanted by retailers.
Constructing a Store Price Image Measurement Scale
In the following, we will develop a measurement scale of store price image specific to our context.
Methodology
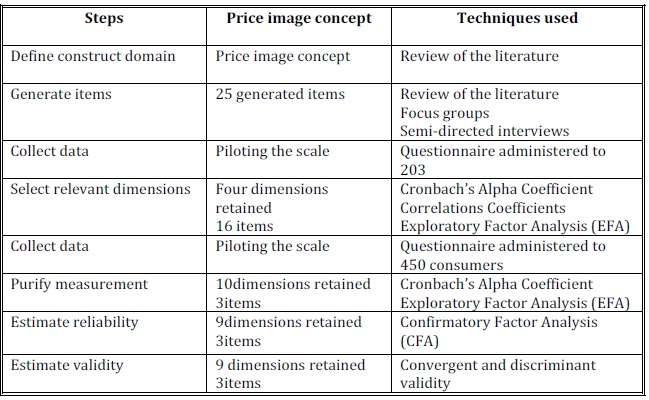
The framework used to construct our measurement scale is that of Churchill (1979). This model summarizes the needed steps to construct a measurement scale. These steps follow the different data analysis procedures to be done. Using Churchill’s paradigm, we try to construct scales in as an iterative and accurate manner as possible. Our aim is to elaborate measurement instruments which “tend towards obtaining a perfect measure of the studied phenomenon or the real value” (Igalens and Roussel, 1988).
Churchill’s procedure has been successively enriched by new methods (Gerbing and Anderson, 1988).
Table 4: Developing Store Price Image Scale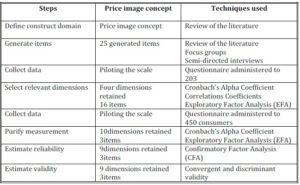
Developing a price image measurement scale involves however preliminary choices of scale structure.
Items Generation
The exploratory study generated 25 items classified according to the five dimensions identified to measure price image.
The aim of the exploratory study is to generate the highest number of possible items. Developing a scale on a large number of items yields to a good internal reliability (Bearden et al., 1993). These items are identified through the review of the literature according to which the multidimensionality of price image concept includes themes like price level, low prices, economies, cash paid and quality/price ratio. Involving experts helped reach a preliminary qualitative purification. The semi-directed interviews deepened the meaning of the generated items and eliminated those irrelevant.
Generating items was subject to a preliminary purification round by involving experts. This phase is a common step which precedes quantitative data collection (Bearden et al, 1993). The experts in pricing and retailing cosmetics expressed their opinions on the quality of items reformulation in relation to the literature.
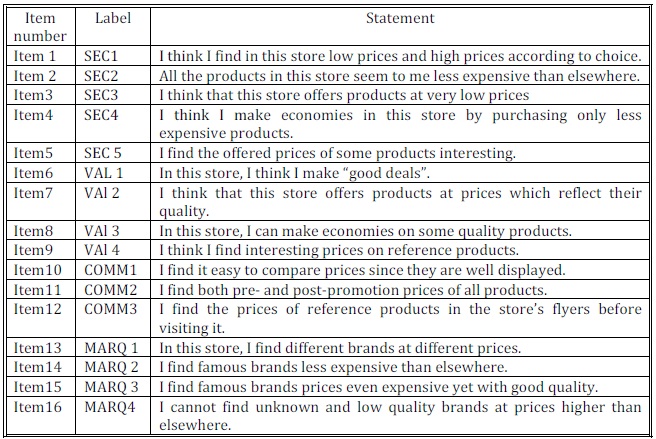
The list of items is then reduced to 16 items before proceeding to the purification round.
Table5: Items Generated through the Literature and the Exploratory Study
The items reformulation reflects consumers discourse when they define a cosmetics and perfumes store with a good price image. The items meet the aspects of the construct price image.
This qualitative construction of the scale will be then purified. The retained structure will be then confirmed.
Constructing the measurement scale needs a qualitative data collection phase in order to proceed to data analysis. This data analysis phase aims at testing the scale’s factorial structure, reliability and validity. To this end, two data collection rounds have been conducted. The first aims at eliminating some items and check price image dimensions suggested by the consumers during the exploratory phase. The second helps purifying the measurement scale by estimating its reliability and validity.
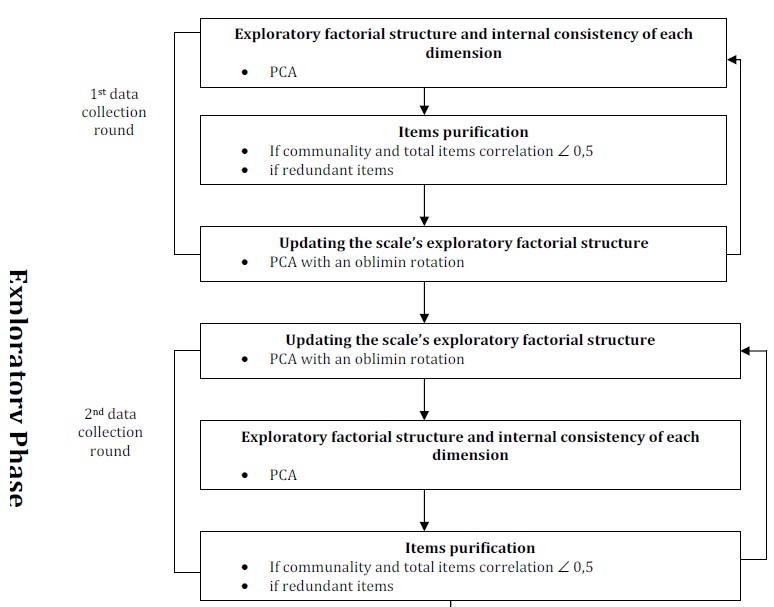
Scale’s Purification
Factor analysis is a technique commonly used to purify measurement scales. The factor analysis conducted on our scale is Principal Component Analysis (PCA) which maximises
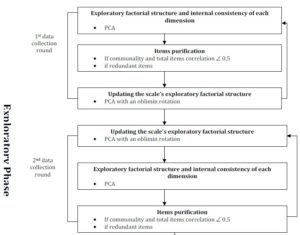
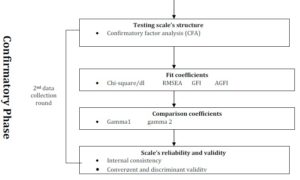 Figure 2 : Main Steps in Constructing the Scale
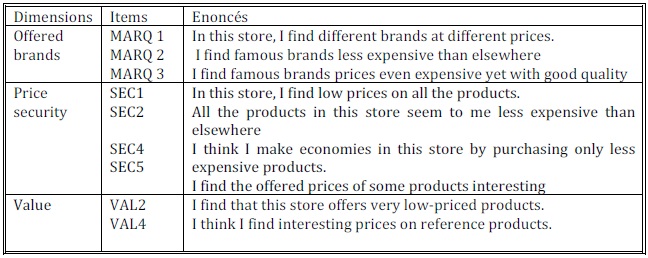
The following table summarises price image.
Table 6: Price Image Measurement Scale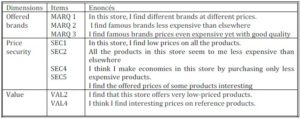
Comparing Perception of Price Image of Two Sales Formats
This is about comparing expensiveness level of two sales formats and mainly knowing the most important dimension which determines the price image of each sales format.
Computing mean differences through running a t-test has given the following results:
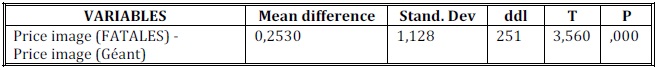
Table 7: Mean Differences of Global Expensiveness Level of the Two Sales Formats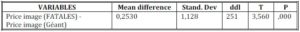
The test is significant as probability p is less than 5%. Moreover, the mean difference is positive which means that “FATALES” expensiveness is higher than “Gèant”.
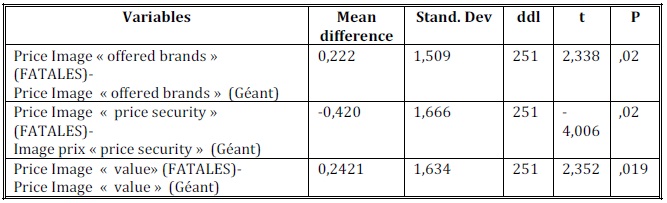
Computing the mean difference helped test the difference between price image dimensions of “FATALES” and “Gèant”. Table 9 reports these findings.
Table 8: Mean Differences of Global Expensiveness Level of the Two Sales Formats
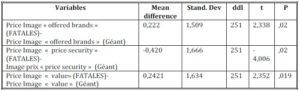
The t-tests are significant, suggesting that there is a difference between perceptions of price image dimensions of a specialized store and a non-specialized store.
Conclusion: Discussion of the Results, Iimplications, Limitations and Future Research
- Price security dimension: a consumer who forms a “good” price image of a luxury-selling store seeks to find the lowest possible prices. Then, the consumer tends to compare the very low-priced products regardless of quality and brand. The consumer does not seek promotions on some products, rather he/she hopes to find low prices on all the products.
- Offered brands dimension: consumers do not uniquely relate to products prices, however, they tend to link the most known brands to determine whether a store is expensive or not.
- Value dimension: a good price image may be represented by quality/price ratio, i.e. by products value. Consumers do not uniquely relate to products prices, they tend to rely on quality to determine whether a store is expensive or not.
- Price communication: it relates to available and easy- to- get information on prices to compare the presented prices of the store with those of competitors.
This paper is an update on previous research on the concept of price image. While this concept is not new, it was the focus of a number of studies within the Anglo-Saxon and French contexts. One clear definition, though, was proposed for this concept, which considers that “price image is a global representation of the relative level of prices of a store” (Coutelle, 2000).
Moreover, our qualitative study along the literature on price image reinforces taking expensiveness into account while defining price image and highlights the four dimensions of price image. This shows that a store’s perceived expensiveness depends not only on price but also on its non-monetary price; i.e. information research, offer value.
The main contribution of this study is the approaches it adopts. While most previous studies opted for a classic approach and focused on studying the influence of one factor or one facet of price image, this study opted for an integrative approach.
The qualitative study helped go beyond the notion of perceived expensiveness which often characterized price image notion and led to the creation and validation of a measurement instrument with clearly identified dimensions. Indeed, the measures identified do not consider the totality of this concept, allowing for distinguishing monetary price image (price security) and its non-monetary facet (price communication, value, offered brands) (Djlassi and Fernandi, 2002). Thus, introducing non-monetary costs helped enrich studying price.
Other observations which helped apprehend the differences between sales formats are of an order. Indeed, our quantitative results point to the differences distinguishing consumers of each sales format.
This study confirms that non-specialized store price image is evaluated more positively than that of specialized stores (Ladwein, 2003).
The mean difference test indicates that “FATALES” expensiveness is higher than that of “Gèant”. The difference between “FATALES” “price security” dimension and that of “Gèant” is as expected. However, the difference for the other two dimensions is contrary to what we expected; which leads us to conclude that the “offered brands” and “value” dimensions of non-specialized stores are better perceived than those of specialized stores and the “price security” dimension of specialized stores is better perceived than that of non-specialized stores. This may be explained by the fact that price image has a monetary dimension and two non-monetary dimensions consistent with studies which elaborated the notion price (Coutelle, 2000; Alvarez and vàzquez casielles, 2008 ; Zielke, 2010). This distinction helped clarify that price image formation for specialized stores is based on non-monetary dimensions, i.e. the “value” and “offered brands” dimensions. However, the monetary dimension, “price security”, mostly contributes to price image formation.
Enlarging the price image concept by postulating three dimensions helps store managers know which dimension appeals to their targets. Then, relying on that/those dimension(s), the manager can adapt the pricing policies in particular and the marketing policies in general to make the store price image fit consumers’ expectations. Consequently, this leads to satisfaction, endorsement and commitment. A case in point is if price security dimension is the dominant, the marketer should diminish price average.
Furthermore, the scale created may be adapted to luxury-selling stores. Managers of such stores should pay attention to the “offered brands” dimension. Indeed, price image literature insists that this notion is not a unidimensional and objective one (Zielke, 2010). Yet, evaluating price image expensiveness is not about studying low prices. Thus, decision-makers may act and involve other elements than price to improve price image. Still, price image different dimensions may serve as a tool for retailers to position themselves in terms of price.
Choosing the sales format is a strategic decision for retailers. Store price image is a means to choosing this format. This choice may either harm or value a brand’s price image as attitudes towards the store are interdependent (Huvé- Nabec ; 2004).
This study focuses on store price image of cosmetics and perfumes and on a hypermarket. However, price image is an interesting asset, mainly for hotels, restaurants and supermarkets. It is then useful to conduct further studies in view to explain more price image formation in these contexts. Likewise, it is very plausible to extend this type of studies to service contexts (banks, insurance …) and other stores like drugstores and thalasso compounds.
It is also feasible to conduct a similar study on the web context so as to determine the influence of atmosphere on price image formation in web surfers’ memory. Indeed, the behavioural differences between consumers in a “brick and mortar” context but there may be a plenty of virtual contexts where further investigation is encouraged. Moreover, this study may be applied to other product categories (shoes, furniture, food, ….).
(adsbygoogle = window.adsbygoogle || []).push({});
References
Alvarez, B. A. & Casielles, R. V. (2007). ‘Consumer Evaluation of Sales Promotion: The Effect on Brand Choice,’ European Journal of Marketing, Vol. 39 Nos 1/2, pp. 54-70.
Bearden, W. O., Netemeyer R. G. & M. F. Mobley (1993). Handbook of Marketing Scales, London, Sage Publications.
Buyukkurt, B. K. & Buyukkurt, M. D. (1986). ‘Perceived Correlates and Store Price Image,’ Advances in Consumer Research, Advances in Consumer Research, 13,42-47
Chezy, O., Raghubir, P., Brosh, G., Monroe, K. B. & Heiman, A. (2008). “Memory-Based Store Price Judgments: The Role of Knowledgeand Shopping Experience,” Journal of Retailing 84 (4) 414–423
Publisher – Google Scholar
Coutelle, P. (1998). “Vers une Conceptualisation de L’image Prix : Revue de la Littérature et Enquête Exploratoire,” Cahier de recherche de l’UPRES-IGT IAE de Tours, n°9872.
Publisher – Google Scholar
Coutelle, P. (2000). ‘L’image Prix des Points de Vente et des Enseignes : Approche Conceptuelle et Proposition d’une Opérationnalisation,’ Cahier de Recherche de l’IGT, IAE de Tours, pp. 117-130.
Cox, A. D. & Cox, D. (1990). ‘Competing on Price : The Role of Retail Price Advertissements in Shopping Store Price Image,’ Journal of Retailing, 66, 428- 445.
Google Scholar
Desai, K. K. & Talukdar, D. (2003). “Relationship between Product Groups’ Price Perceptions, Shopper’s Basket Size, and Grecery Store’s Overall Store Price Image,” Psychology and marketing, Oct, 20, 10.
Publisher – Google Scholar – British Library Direct
Dichter, E. (1985). “What’s in an Image?,” Journal of Consumer Marketing, 2, 1, pp. 75-81.
Publisher – Google Scholar
Djlassi, S. & Ferrandi, J. M. (2002). “Un Premier Test du Rôle de la Perception du Temps et des Valeurs en Matière de Comportement d’achat par Catalogue,” Actes des 16èmes Journées des IAE, Paris.
Publisher – Google Scholar
Dubois, B. (1994). “ Typologie de Consommateurs ou de Situations de Consummation,” Décisions Marketing, 2, Mai-Août, 85-87.
Publisher – Google Scholar
Feichtinger, G., Luhmer, A. & Sorger, G. (1988). “Optimal Price and Advertising Policy for a Convenience Goods Retailer,” Marketing Science, 7, 2, Spring, 187-199.
Publisher – Google Scholar
Fornell, C. & Larcker, D. F. (1981). “Evaluating Structural Equation Models with Unobservable Variables and Measurement Error,” Journal of Marketing Research, 27 (February), pp. 39–50.
Publisher – Google Scholar
Gerbing, D. W. & Anderson, J. C. (1988). “An Updated Paradigm for Scale Development Incorporating Unidimensionality and its Assessment,” Journal of Marketing Research, 25, p. 186-192.
Publisher – Google Scholar
Grawitz, M. (1990). Méthodes des Sciences Sociales, Paris, Dalloz.
Hamilton, R. & Chemev, A. (2010). “The Impact of Product Line Extensions and Consumer Goals on the Formation Price Image,” Marketing Research Chicago Feb Vol 47 N°1 pg 51.
Publisher
Huvé-Nabec, L. (2004). “ L’extension du Circuit de Distribution Sélectif d’une Marque : Quelles Répercussions sur l’image de la Marque et sur celle de l’enseigne?,” Décisions Marketing, 35, Juillet-Septembre, pp. 49-60.
Publisher – Google Scholar
Igalens, J. & Roussel, P. (1998). ‘Méthodes de Recherche en Gestion des Ressources Humaines,’ Economica, Paris.
Google Scholar
Jallais, J., Orsoni, J. & Fady, A. (1994). ‘Le Marketing dans le Commerce de Detail,’ Vuibert, Paris
Keaveney, S. M. & Hunt, K. A. (1992). “Conceptualization and Operationalization of Retail StoreImage : A Case of Middle-Level Theories,” Journal of The Academy of Marketing Science, 22, 2, 165-175.
Publisher – Google Scholar
Kunkel, J. H. & Berry, L. L. (1968). “A Behavioral Conception of Retail Image,” Journal of marketing, 32, october 21-27
Publisher – Google Scholar
Ladwein, R. (1995). “ L’image-prix de la Gamme de Produits : Jugement du Prix Moyen et Mémorisation des Prix,” Congrès de L’Association Française du Marketing
Publisher – Google Scholar
Lindquist, J. (1974-1975). ‘Meaning of Image,’ Journal of Retailing, 50, Winter, 29-38.
Petroshius, S. M. & Monroe, K. B. (1987), “Effect of Product-Line Pricing Characteristics on Product Evaluations,” Journal of Consumer Research, 13, march, 511-519.
Publisher – Google Scholar
Simester, D. (1995). “Signalling Price Image Using Advertised Prices,” Marketing Science, 14, 2, 166-188.
Publisher – Google Scholar – British Library Direct
Simon, H. (1989). ‘Pricing Management,’ North, Holland, Amesterdam
Zielke, S. (2006). ‘Measurment of Retailers Price Image with a Multiple Item Scale,’ The International Review of Retail Distribution and Consumer Research. London Jul vol 16 N°3 pg297
Zielke, S. (2008). “Exploring Asymmetric Effects in the Formation of Retail Price Satisfaction,” Journal of Retailing and Consumer Services, 15, 335-347
Publisher – Google Scholar
Zielke, S. (2010). “How Price Image Dimensions Influence Shopping Intentions for Different Store Formats,” European Journal of Marketing. Bradford. Vol. 44, N° 6; pg. 748
Publisher – Google Scholar
Zimmer, M. R. & Golden, L. L. (1988). “Impressions of Retail Stores : A Content Analysis of Consumer Images,” Journal of Retailing, 64, 3, pp. 265-291.
Publisher – Google Scholar
Zollinger, M. (1993). “Le Concept de Prix de Référence dans le Comportement du Consommateur : d’une Revue de la Littérature à l’élaboration d’un Modèle Prix de Référence-acceptabilité,” Recherche et Applications en Marketing, 8, 2, 61-77.
Publisher – Google Scholar