Introduction
Introduction Objectives
The aim of this paper is to analyze innovation, structural changes, links and functions in an innovation system or cluster dynamics under globalization. Then, from the evolution of the innovation system of Spanish industry of ceramic tile and new situation of global competition, this paper focuses on a conceptual framework based on the governance of the global value chain. Finally, we analyze empirically the sector innovation system of wall and floor tiles in Spain using qualitative and quantitative methods.
This paper is organized as follows: first, we analyze the origin and evolution of the tile ceramic innovation system and its development sector competitive. Second, we analyze the reasons that have contributed to its development, and the influence that various economic agents have had. Third, we propose a model for analyzing the functions of these agents from a perspective of the value chain model and its governance, based on the sector economic data. Finally, it draws conclusions and proposes a new research framework.
Context of Innovation System
In principle, innovation systems can be defined as “geographic concentrations of interconnected companies and institutions in a particular or multiple industry sectors” (Porter, 1998, pp.71). In the past two decades, the phenomenon of innovation system has attracted the attention and aroused the interest of researchers, and experts from different scientific communities’ members as the New Economic Geography, The Regional Sciences, GREMI group, Economic Policy and many others. All publications mentioned above have discussed the advantages or external effects of innovation systems which have also been analyzed in several empirical studies (Cooke et al 1997).
In addition, companies can not limit its knowledge management to that available knowledge which has been internally acquired. Rather, local resources, such as R&D centers, educational institutions or industry associations seem to be critical agents which will be complementary to its own resources, and will act as agents of economic development. Consequently, competitive advantage lays both locally as well as internally to the company (Camagni, 2008).
Additionally, one of the central factors in the context of the innovation system will be the formation of dynamic and complex networks which can be available to businesses which are located locally. This willprovide a crucial organizational context. For instance, the presence of a local R&D center may be considered a static resource until the surrounding firms would interact with each other as well as with the center and utilize that resource. Then, it will become a dynamic resource. Consequently, authors such as Johanisson et al. (2002) established a framework that characterized the variety of linkages in the innovation system in different levels: first-order (when the relationships are limited to firms), second order (when firms’ relationships are related with economic and social institutions) and third-order embebedness (when firms have a closer but indirect relationship through social and economic institutions). All these are based on the dimensions of economic (of systemic character) and social embebedness (having a critical character). External links between innovation systems and other non localized agents in the same field may also contribute to improve the system.
The Spanish Tile Ceramic Innovation System
Innovation Systems and Innovation
Since the influential publication of Schumpeter (1911), innovation has been associated with industry competitiveness and, in turn, an influential publication by Patel and Pavitt (1994) has described the links between macroeconomic forces and technical change. Later, Freeman (1974, 1996) analyzed the effect of technological innovation on business growth. Many authors have examined the relationship between competitiveness and technological change.
Traditionally, from its very beginning, Technological Innovation has been a key factor in the development of the tile ceramic industry global leadership held by Italy and Spain. Furthermore, this (leadership) was based in the case of both countries on the absorption of innovations generated by Italian machinery industry (Albors, 2002, 2006). It has also been accompanied by an intense interaction between the producers of tile pigments and glazes, and tile equipment manufacturers which has caused a vast improvement in productivity, quality and competitiveness. Thus, several authors have emphasized that it is due to the innovation success as a result of inter- organizational collaboration among various agents in the Spanish and Italian clusters (Hervas et al, 2008).
The Spanish industry of ceramic tile, which was developed in the early eighties of last century , experienced a tremendous growth in the next decade due to several factors: the availability of natural gas in the area of Castellón, the development of the industry enameled or glazed (facilitated by the new technological discontinuity turned- single firing process), a strong domestic demand from the construction sector , the transfer of technology from Italian machinery industry , augmented by the entry of Spain into the European Union (Albors, 2002). Thus was formed, as in Italy, a model in which suppliers of machinery and technological innovation led enamels according to Pavitt’s taxonomy (1984). In this context, it should be noted that the largest companies are leading, in most cases, the incorporation of standards, procedures and technologies.
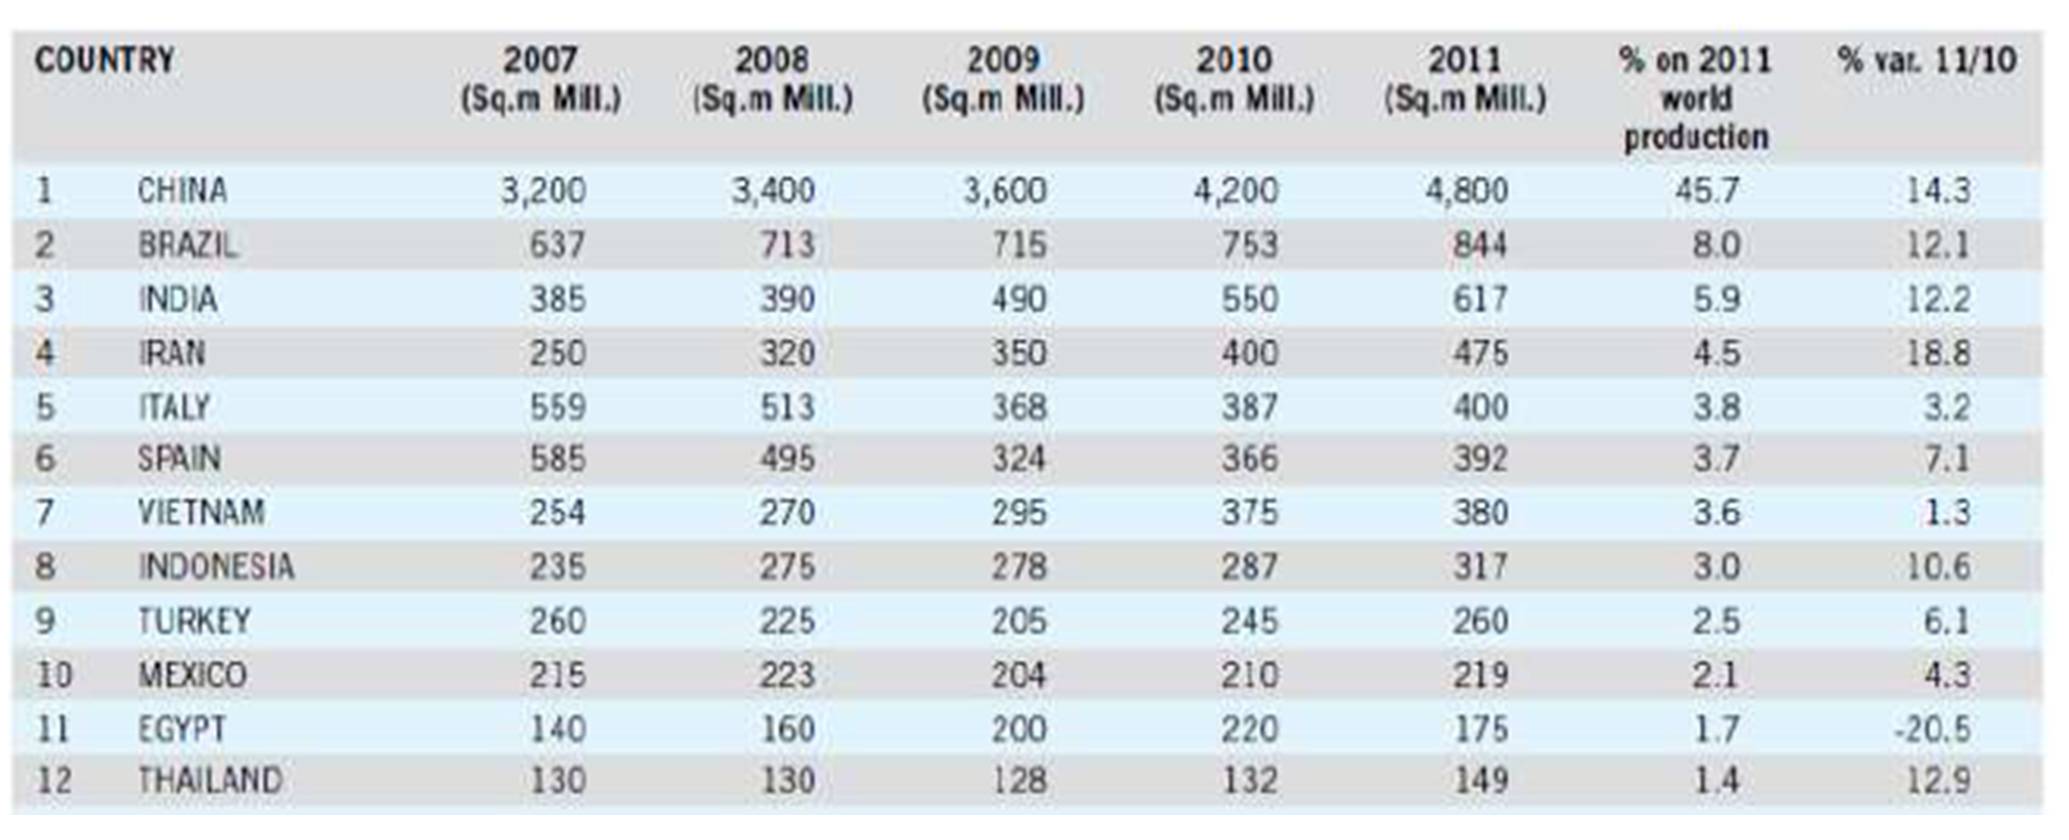
Table 1: Top Tile Ceramic manufacturing Countries, 2007-11 (Infotile, 2012)
Moreover, the Spanish tile ceramic industry competes, especially in the medium or low market segment. Since the price is a competitive factor in this segment, the innovation process has been crucial to facilitate the adoption of technologies that reduce the production’s costs (Albors and Hervas, 2009).
This paradigm based on technological innovation, adding to the effect of the innovation system of the Italian and Spanish tile ceramic clusters, has facilitated the dissemination of these innovations in the industry. It has also contributed to an increase in productivity of 68% from 1990 to 2007 along with a significant growth of domestic and international sales (ASCER) . However, in recent years, there have been radical changes in the global distribution of production. A new market situation has emerged, and new competitors have proliferated around the world that has access to the technology that differentiated European tile ceramic products. As shown in Table 1, the annual growth rates of production of wall and floor tiles from Italy and Spain have stagnated, while in other countries such as China, Thailand, Vietnam, India, Indonesia, Egypt, Poland, etc production has experienced tremendous growth.
Characteristics of the Spanish Tile Ceramic Innovation System
In Addition to being one of the world’s leading producers and leading industry of tile ceramics in Europe (measured in square meters), Spain has been also one of the largest per capita consumers of tile ceramics, as it reached the 8.1 m2 per capita in 1999 . The tile ceramic cluster located in an area of 35 km2 provided about 38,000 direct manufacturing jobs, and more than 280 firms from different auxiliary; industries were related to the production of tile ceramic: tile ceramic manufacturers, glaze, pigment and clay producers, suppliers of machinery for ceramic, transport businesses, distributors, etc. (ASCER). In addition, different public R&D and educational centers offer special courses on production of wall and floor tiles thus, contributing to knowledge build up in the cluster.
Overall, the innovation system is quite complete from the institutional point of view and possesses sufficient public and private sustain to provide adequate support to the tile ceramic value chain. Moreover, the cluster of Castellón integrates smaller firms (73% with less than 100 employees) and which are less vertically integrated, and that need more local resources due to the lack of their own and have to rely on external valuable services or contributions (such as design or marketing). As a result, networks are less structured and more informal (Hervas et al, 2008).
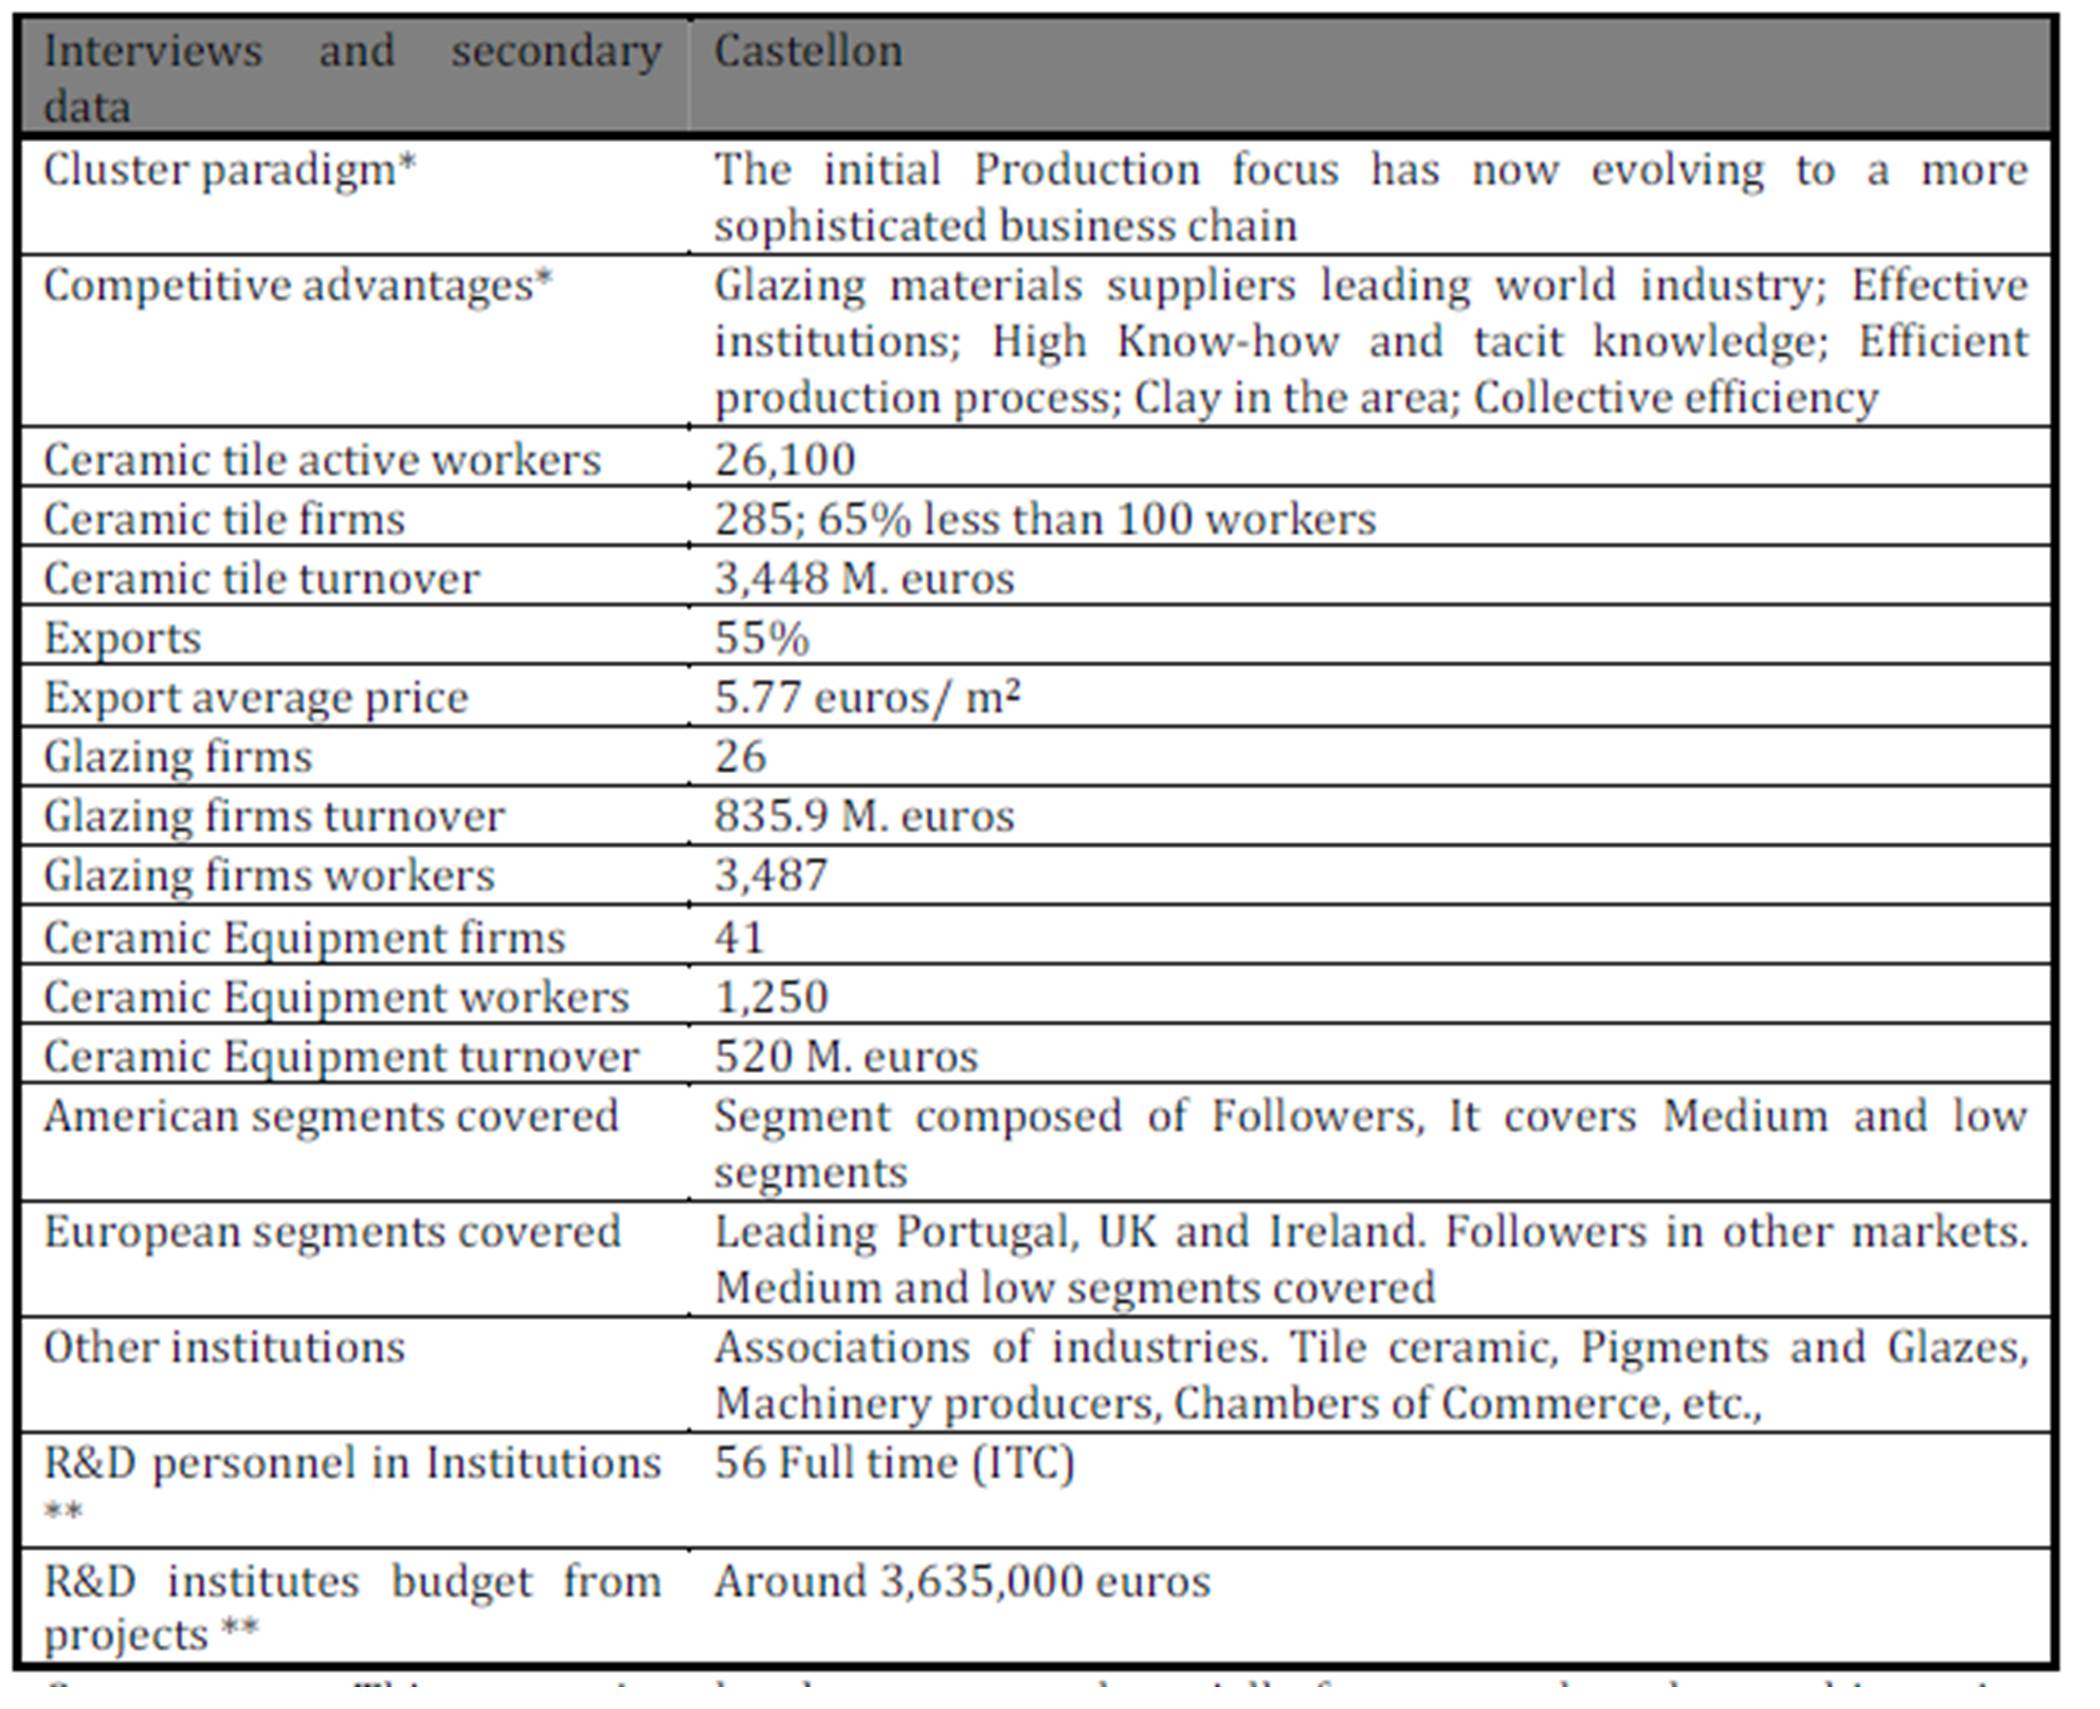
On the other hand, the real strength of Castellón innovation system is its systemic behavior which has led to an innovation diffusion model which would be very difficult to replicate in a different context. Engineers and technicians from the tile ceramic producing firms are in permanent contact with technicians and chemists from pigment and glazing firms. Simultaneously, tile ceramic firms employ chemical engineers educated in the tile ceramic local university, or who have been trained in the ITC (a local Research Technology Center specialized in tile ceramics). Consequently, it has been created a dynamic flow of knowledge within the innovation system supported by a strong informal relationship. For this reason, the glazing industry is the main signatory of contracts with the ITC, and this subsector has developed a strong R&D competence, transferring its knowledge through their interrelationships and links with tile ceramic firms. In parallel, these links are reinforced by the support of ITC to tile ceramic producers and the employment of technicians with experience in the different cluster industries. All this involve a smooth flow of knowledge, tacit and explicit, which is based on the use of a common language, industry culture, common understanding and personal informal relationships by local workers which implicitly are seeking the same goals (Albors, 2000; 2002; Albors-Garrigós and Hervas-Oliver, 2006). Table 2 resumes the tile ceramic cluster profile during 2004 at its peak.
Table 2: Spanish tile cluster profile
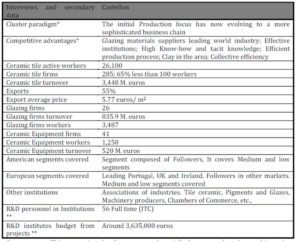
Own sources: This comparison has been extracted partially from secondary data and interviews, mainly referred to 2004, especially from ASCER and ASSOPIASTRELLE (2003), as well as interviews carried out.
All the figures are referred to the meso-level, i.e. the cluster. * based on Meyer-Stamer et al. (2001);
** Data approximated, obtained from ITC interviews.
However, a successful process of technological innovation requires from all involved actors, technology and organizational competences, in order that information can be managed properly for the acquisition of knowledge about the customer final needs and perceptions, as well as managing adequately the potential contributions of customers for innovation in products and services. In the case of the Spanish ceramic tile, ceramic industry, although the inter organizational competences of the before mentioned actors (equipment manufacturers, glaze, pigment and enamel producers and tile manufacturers) have been universally recognized, it could be observed certain disarticulation on the side of the agents belonging to the final value chain steps such as distributors, retailers and fitters. This can affect the development of a market innovation focus, and those agents which have direct contact with the final customers (Albors-Garrigos and Hervas-Oliver, 2006).
The value chain approach
Theoretical Approach
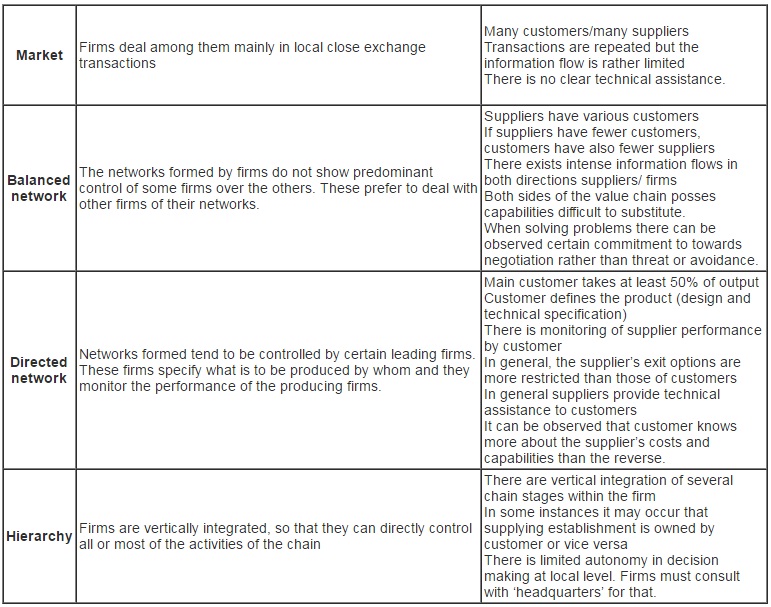
The analysis of an industry from the perspective of value chains directs us to the study of the existing dimensions in these chains defined by Mc Cormick and Schmitz (2001): flow or structure of inputs and outputs, geographic extension and Governance. To begin, Governance determines the control that the various actors can exert on the activities that take place in it. Actors and agents in a value chain control directly their own activities and, themselves, are controlled directly or indirectly by other actors. In a value chain, this pattern of control is referred to as Governance. Humphrey and Schmitz (2004) point out four basic patterns: market, balanced network, directed network and hierarchy (See table 3).
Table 3: Types of Governance in the value chain (Adapted from Humprey, Schmitz, 2004 and Mc Cormick, Schmitz, 2001)
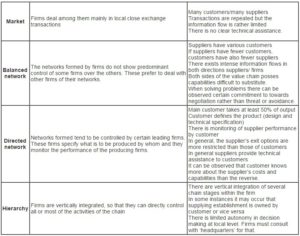
The ceramic tile industry presents examples of all of them. Our objective is to typify the existing relationship between four actors pertaining to this value chain: tile manufacturers, glaze and pigment producers, equipment and machinery manufacturers, and distributors; in order to determine their degree of influence and competitiveness in the industry.
Some authors (Schmitz, 2000; Gereffi, 1999; Kaplinsky and Morris, 2001) have recently developed a conceptual framework, and published some empirical studies of governance from the value chain point of view. From their point of view, it is possible to recognize, based on the concepts of governance (Gereffi, 1999), not only which are the actors who achieved the best performances in a certain sector or chain, but also to determine which of these have greater relevance in the decisions that affect this industry. Based on this, and taking into consideration the antecedents of the Spanish ceramic tile industry, it seems that the decision making has been managed, until now, from the production sub sector, headed by the producers of glazes and pigments as well as the equipment manufacturers (Albors, 2002).
Agents and Actors in the Value Chain
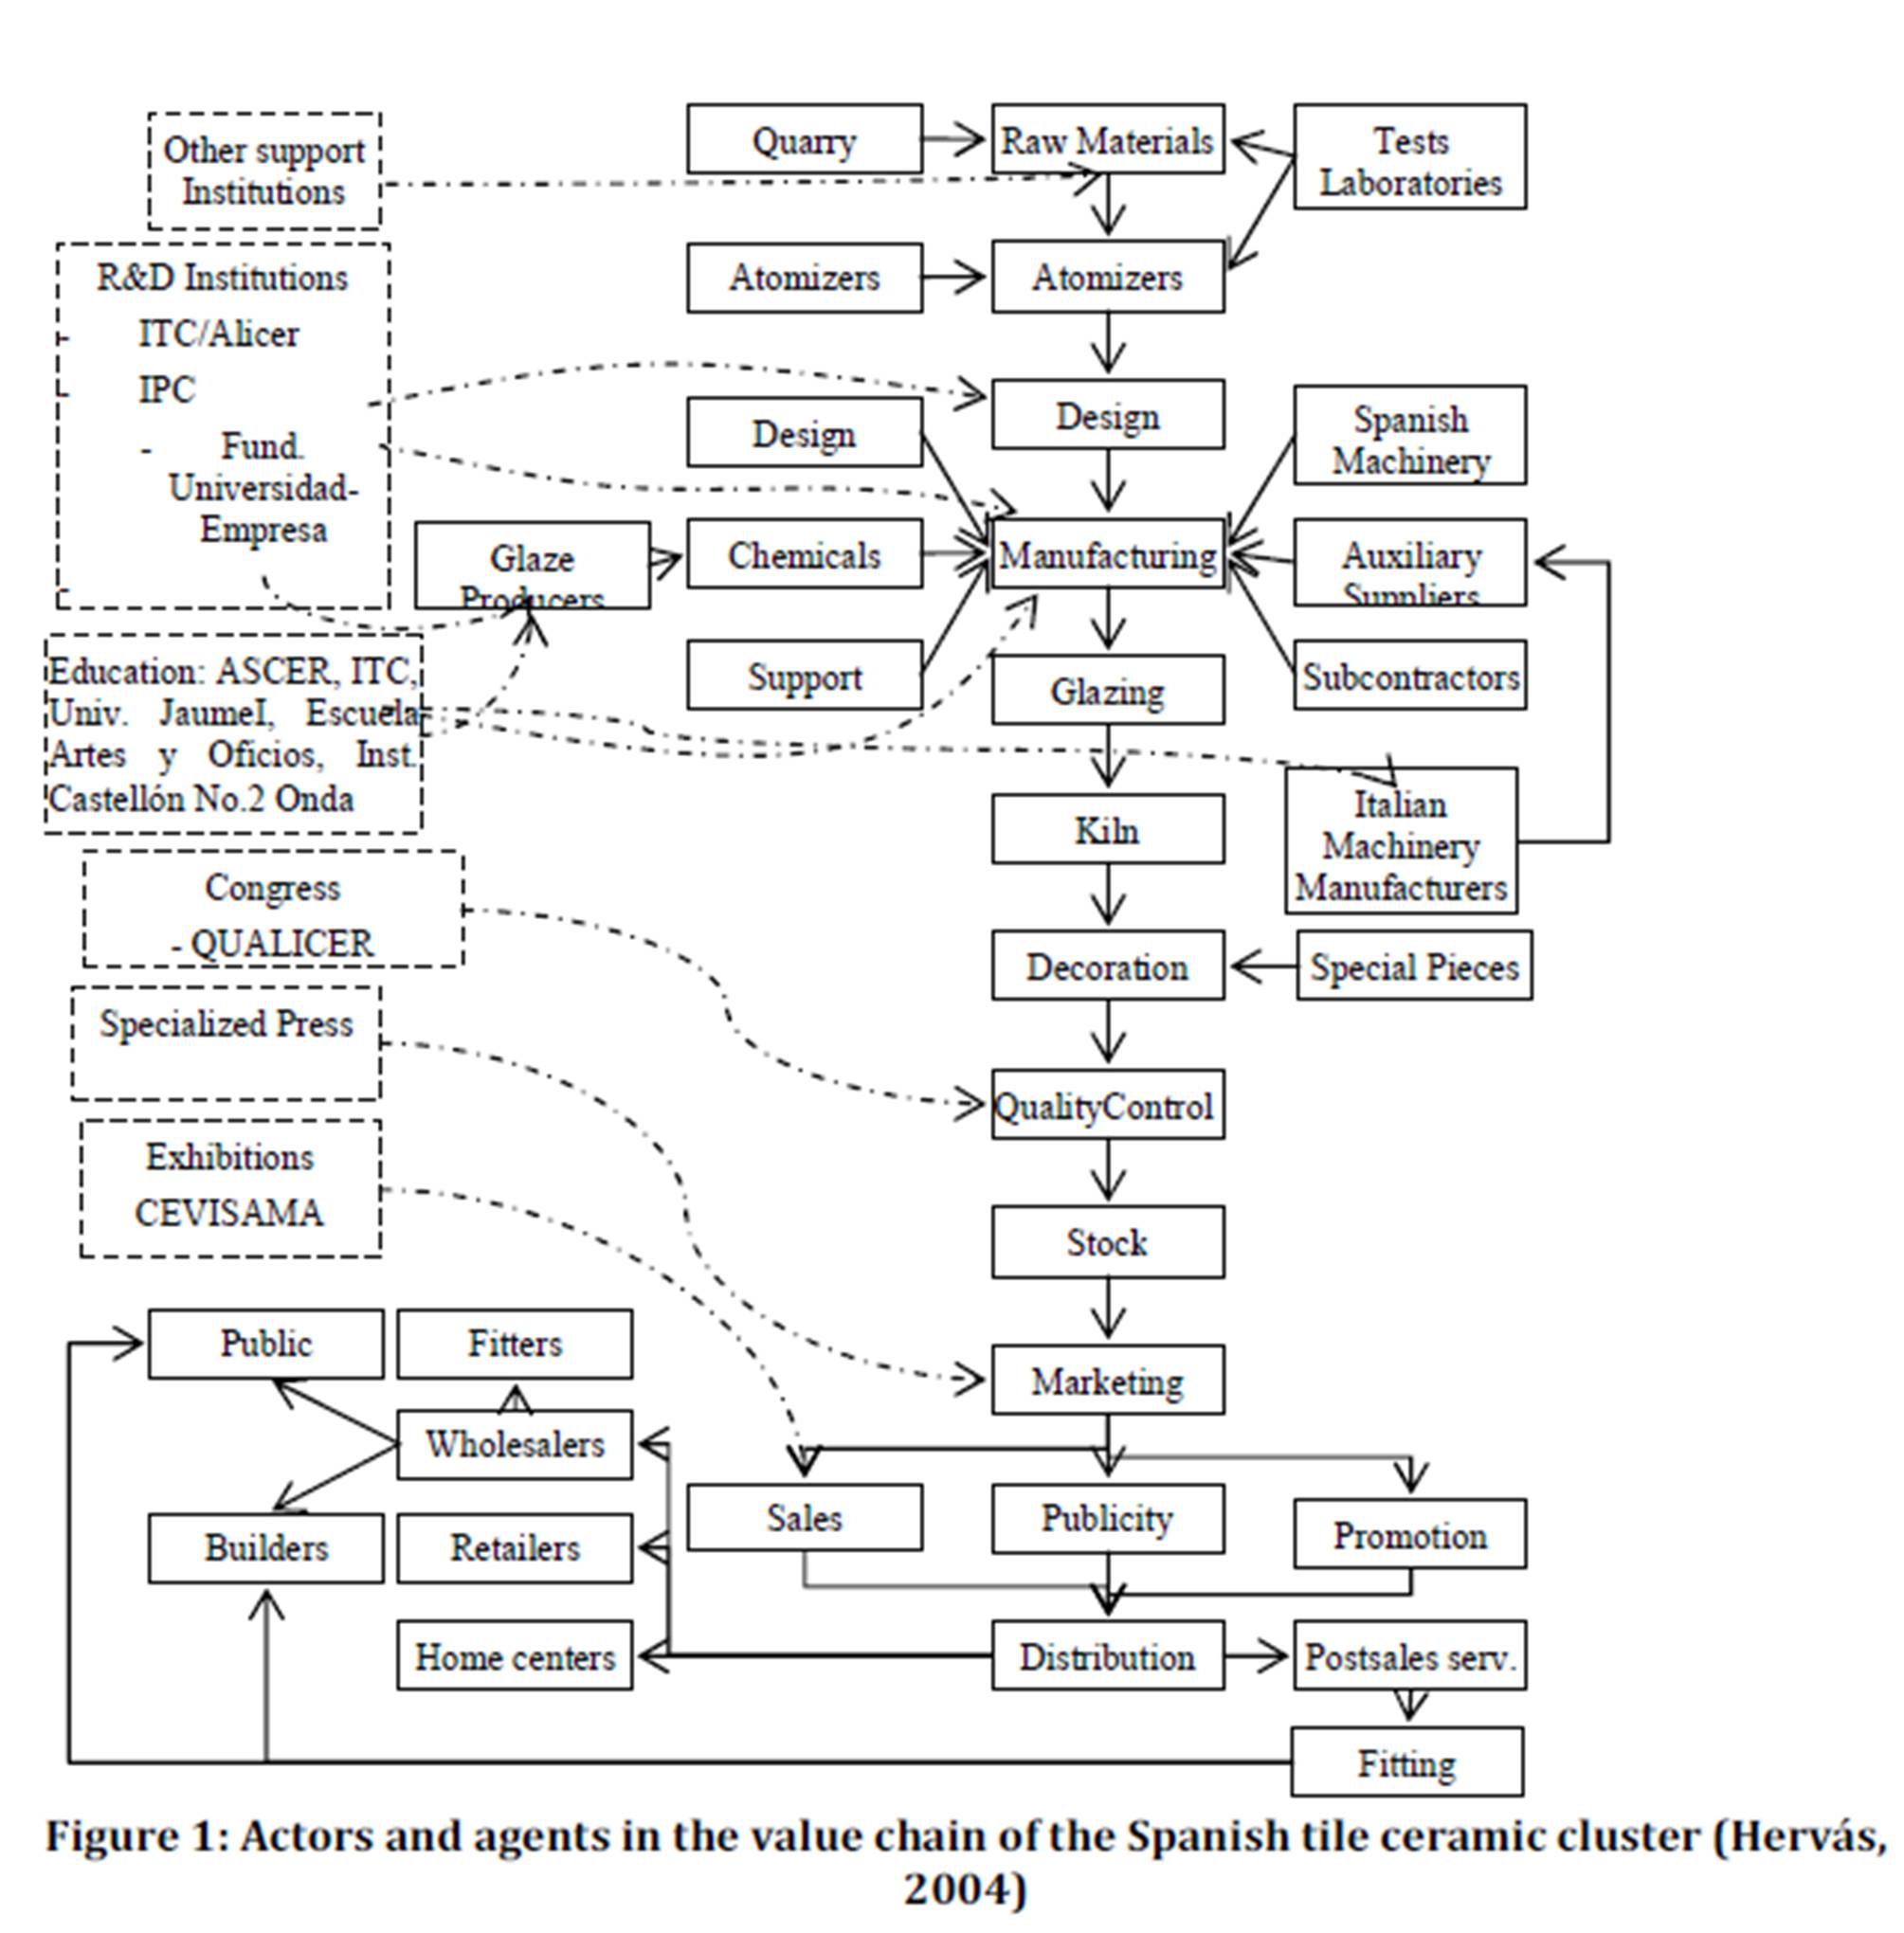
In our considered value chain (tile ceramics), it is necessary to consider the complete range of activities required by the tile ceramic product (and service) from its conception. This could be shown, by analyzing the different production phases (including a combination of physical transformations as well as the incorporation of services of several agents), as well as the delivery of product and services to the final consumers (Kaplisnky and Readman, 2001).
This is represented in figure 1.
Thus, we can identify the Spanish tile ceramic cluster value chain composed by the following agents: limestone producers and atomizers, Italian and Spanish equipment manufacturers, frit and glazes producers, public support institutions, private support associations, education centers, distributors, logistic and auxiliary firms, congresses and exhibitions, and other agents such as fitters, etc
Governance Measurement Indicators
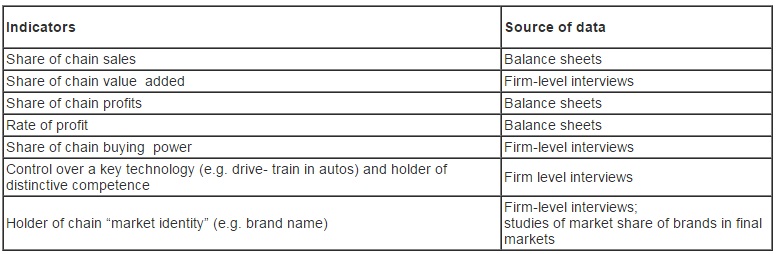
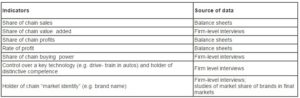
Following Kaplinsky and Morris (2001) the extension of the governance power of the chain can be related in a complex form, with the relative size of an individual organization within the chain. This size would be measured in relation to the alternatives listed in table 3, which includes qualitative and quantitative indicators. Therefore, the agents, who would show the best performance in terms of these indicators, would be those having a higher governance power within the value chain. However, as it can be observed, most of these indicators are qualitative, and this fact increases the difficulties to find the adequate information in order to quantify the governance level in a given chain. Moreover, those indicators of quantitative nature derive from accountancy measurement, and although they are most utilized, are subjected to opportunistic manipulation, and their values are calculated normally with tax criteria as Hervas et al (2008) have pointed out.
Table 4: Indicators of Governance in the Value Chain (Kaplinsky, Morris, 2001)
Governance Relationships between the Analyzed Actors
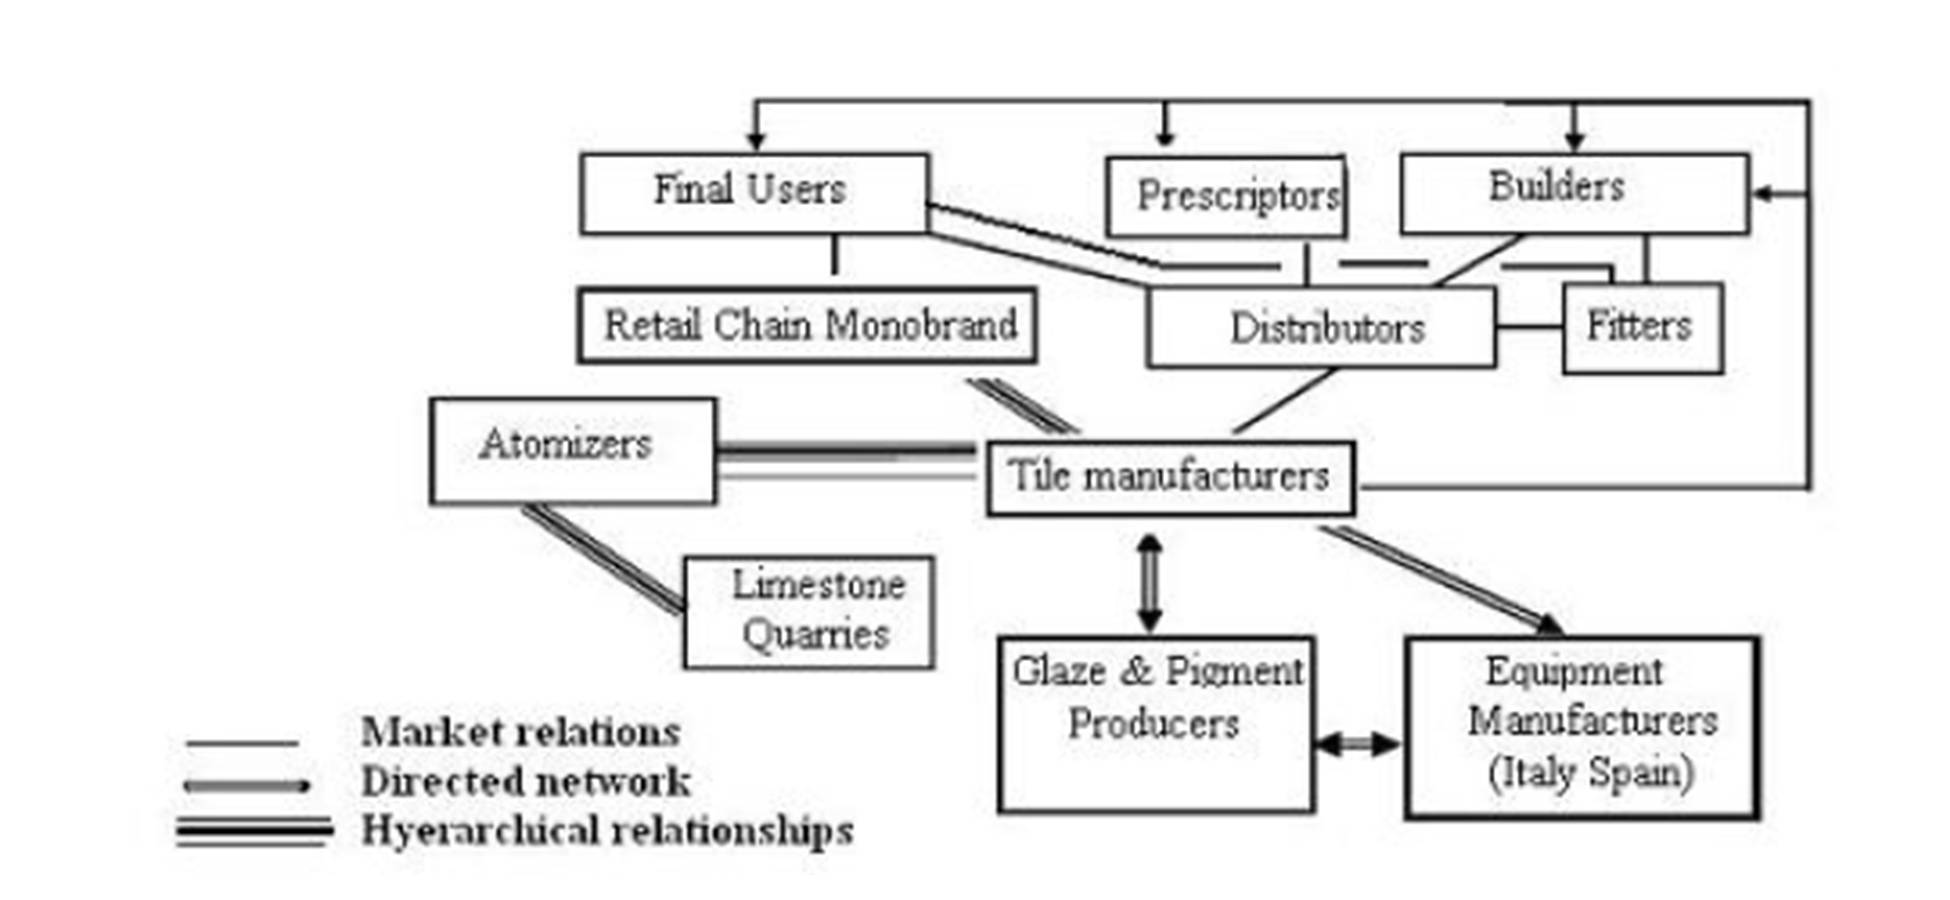
In order to initiate our analysis we will employ at first instance, those indicators of qualitative nature pointed out in table 3. In a general approach, based on the interviews and surveys of the field study (Albors, and Hervas 2006), the most representative characteristics of the power relations of the chain have been outlined in figure 3. To begin, the analysis will commence in the inferior part of the chain where the relationships between manufacturers and atomizer firms are represented. These firms (26) are owned by groups of tile manufacturers whose relationship is that of hierarchic type. The relationships between the glaze and pigment producers (28) with the tile manufacturers (226) adjust, under our perspective, to a balanced network given the fact that each manufacturer works with various glaze suppliers. Hence, there exists an intense information flow between both, due to the cooperation activities in both directions. These activities include the supply of design and product development as well as general technology transfer.
Also, the manufacturers of equipment constitute a balanced network with the tile manufacturers and the enamel producers, collaborating with the latter in order to adapt their applications to the machinery. In the Spanish case, the tile manufacturers are related with the Italian ones, as well as with the Spanish equipment manufacturers (some of them related with the Italian firms). In this sense, the interaction between these two sectors is remarkable and it has contributed to develop a series of innovations, which have conduced to the leadership of the European tile industry. Even though, all these innovations generated in the Spanish or Italian industries have been disseminated worldwide.

Figure 2: Governance Relationships between the Actors of the Ceramic Tile Industry.
In relation to the commercialization phases of tile products in the Spanish industry, it has been observed clearly how the relations are of the market type in the majority of cases. However, there is an exception where retail stores of some manufacturers (4-5), which represent a vertical integration, have interchanges which are governed by hierarchic relationships. This sub sector is experiencing actual changes with a new association being started and new marketing alternatives gaining momentum. These market relations are formed in such a way, since most of the producers and distributors have an ample range of clients (or suppliers). The information flows are restricted to the transaction operations, leaving aside aspects related to the contribution of each actor to the improvement of the activities and competitiveness of their counterpart.
In the case of the tile fitters, the same interaction pattern has been noted market relations, where the prevailing condition is the price of services, without having observed any other patterns of interaction that would allow a relevant influence in the process .
Quantitative Approach: Empirical Study
Methodology
With the purpose of contrasting the results outlined in the governance map presented in figure 2, and following the indicators proposed by Kaplinsky and Morris (2001) summarized in table 4, we intend to compare the performances of five actors with the following: tile manufacturers, pigment and glaze producers, Spanish and Italian equipment manufacturers, and finally, Spanish distributors. For this purpose, we will at first employ indicators of performance of quantitative nature related to the distribution of profits and rents to the inner side of the chain, and the extend of those utilized in this sense by Hervás et al (2008) in a previous study (see table 5).
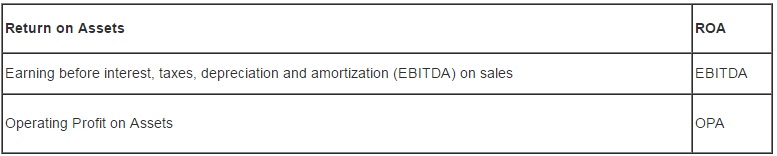
Table 5: Analysed ratios

In order to select the firms in each individual sector, we have employed the database of manufacturers provided by the different industry associations from the tile sector: ASCER for the case of the tile manufacturers, ACIMAC for the Italian equipment manufacturers, ANFFEC for the glaze and pigment producers, as well as ASEBEC for the Spanish equipment manufacturers. However, in the case of the distribution firms of ceramic tiles, there is not yet an available database, which would provide centralized and complete information about its population. Therefore, it was necessary to resort to the industrial activity codes (CNAE) and later verify their activity by telephone . These lists were contrasted in order to obtain the necessary data to construct the indicators. Moreover, two economic data bases were utilised, SABI for the Spanish firms and AMADEUS for the Italian equipment manufacturers. Thus, the indicators were drawn for temporary series from 1995 to 2006 for the majority, except for the Italian manufacturers for which, data were only available from 1998.
Analysis of Results
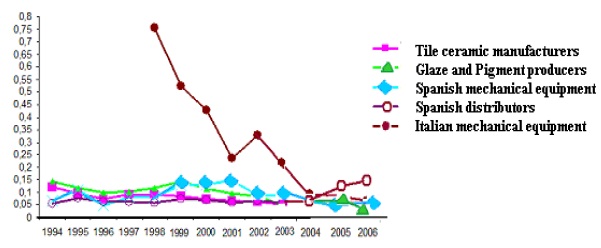
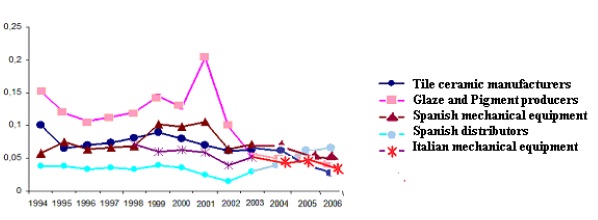
The representation of the means of Return on Assets (ROA), Operating profit on Assets (OPA), and Earnings before interest, taxes, depreciation and amortization on sales (EBITDA) for the analyzed sectors can be observed in the following figures: 3,4, and 5. Additionally, a multivariate analysis has been applied to verify that there are significant differences in the analyzed variables means. These differences are significant for p<0,05 for the majority of the reviewed years. In addition, if we further apply procedures to analyze each variable per a year and sector, it can be pointed out again that such significant per a year differences persist. However, due to the paper extension limitation, it is not possible to include all the tables for each variable.
Figure 3: Return on Assets (ROA)
The three indicators emphasize the performance of the glaze and pigment producers that have experienced performances higher than other sectors in previous years, which means above the average of the other sectors. However, a reduction tendency can be observed in the last years. This can be related with the sales reduction in the last three years (ASCER) and an increasing competition from other countries. Another cause could be the recent increase in the production of porcelain tile (ASCER), a segment in which the manufacturers of Italian equipment posses a dominant role due to a technology reasons . Moreover, this presents a contrast with the decrease in the production of conventional tile (that which is not of porcelain origin), which represents a typology where the enamel producers exert a greater influence (Meyer-Stamer et al, 2004) .
Alternatively, although the temporary series limits the data to 1998, the Italian equipment manufacturers report stable return on assets ratios during the last years. However, this indicator is sensibly lower than that observed in Spanish equipment manufacturers, closely related to the Italian, but benefiting from lower investments in R&D and production equipment. According to Albors (2000) the Spanish sector should be catalogued as auxiliary carrying out technical support, repair and maintenance services, and manufacturing spares and pieces of intense consumption such as screens, moulds, etc. As a result, this added to the lower labor results in the higher returns for the Spanish firms. The sub sector of Spanish equipment manufacturers has made, in the last three years, a relevant cooperative effort. This fact can explain its exports increase which, according to ASCER (2007), has experienced an accumulated growth during 1998-2004 of more than 400%. It must be considered, as well, that several Italian firms have delegations located in the Spanish cluster from where it serves export markets worldwide.
The case of the tile manufacturers presents a similar situation to that of the enamel producers. After several years of maintained growth, a decreasing tendency is observed due to an increase in the competition, especially in countries with emerging industries, distinctive of a supply and not of demand market as it has occurred in previous years.
Finally, the distributors of tile ceramics, a sub sector of which there are not available previous studies, show stable return levels throughout the analyzed period. Although, with some variations, its economic indicators show a more stable growth comparable to other influential sub sectors in the industry such as enamels, and Italian equipment.
From these results we could draw innovative conclusions in terms of the analysis of governance levels in the industry value chain. On the one hand, it has been corroborated throughout financial and accountancy indicators that the sub sectors of enamel and equipment production present the best performance levels in the tile industry. However, there is a tendency to decrease their rent in the chain in favour of the distribution sub sector which shows a sustained performance with a slight positive tendency to grow.

Figure 4: Operating Profit on Assets (OPA)
Figure 5: EBITDA on Sales
Finally, we have considered an alternative indicator of qualitative nature proposed by Kaplinsky and Morris (2001) as explained in table 3: the control over key technologies define the distinctive competence of a chain. The analysis of this indicator confirms that the influence of these sub sectors (enamels and equipment) in the industry is due to its strong capacity of technology innovation. This fact, enhanced by the strong cooperation with the tile manufacturers, has allowed the reinforcement of the industry, as a leading decision driver.
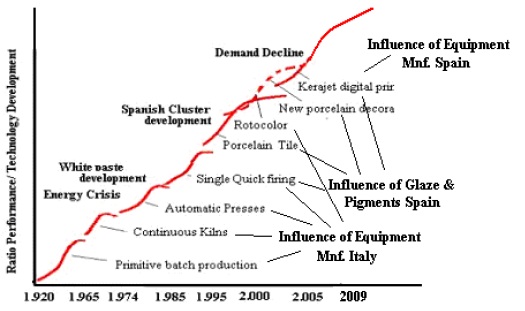
Figure 6: Curves Showing the Technology Discontinuity for the Tile Ceramic Industry. (Albors, 2002).
Figure 6 illustrates the evolution of the key technologies, which have contributed substantially to the process productivity and to the radical product improvements; it shows as well the influencing agent. Thus, we have followed the paradigm of the S curves proposed by Foster (1986), it has been based on the information provided by field interviews and industry references (Albors, 2013).
It can be observed how the development of continuous kilns, single firing processes, porcelain stoneware and gravure printing (Rotocolor) has transformed the tile decoration process. The new systems of porcelain decoration (double layer moulds, etc.) have escorted the tile industry development, and were basically led by the equipment and later followed by the enamels sub sector.
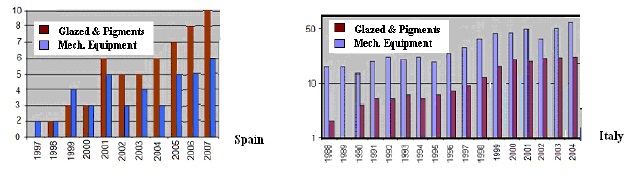
Figure 7: Published Patents in the Tile Ceramic Industry, Spain and Italy.
(Source: Authors and Masci, 2000)
Another perspective and subsequent approach has been offered by the analysis of patents drawn from the European Patent Office . It compares the patents published in Italy from 1988-2004 as illustrated in figure 7.
In order to compare, the authors have added the patents perspective from Spain during a later period, 1997-2007. However, the lower patenting culture of Spanish industry has to be taken into account here. The results are useful in our case, since both clusters follow the similar technology paradigms. It can be observed how the technological development reflected in the patents of the equipment sector, leads to the evolution followed by the patents of producers of enamels and tiles related to the product and processes.
In spite of the actual existing consensus on the relevance of equipment and enamels sub sectors, and though these industries continue to consider the technology innovation as a key success factor, their performance is appreciated in conjunction with the decreasing tendency of the tile manufacturers. The same situation can be applied to the auxiliary sector of Spanish equipment, in spite of the fact that they have upgraded their chain role by profiting from their increasing services to the Spanish tile manufacturers. On the other hand, the distributors sub sector, which until now have not represented a relevant agent role within the value interchanges inside the chain, present a greater stability in their levels of returns, margins, and operation profits.
The previous reflection let us conclude that, in order to improve the performance of the value chain agents from the point of view their value contributions as well as its governance, it will be required relevant changes at the firm strategic level will. Furthermore, though technology innovation emerges as a critical element within any industry, value interchanges must be promoted with other types of agents, such as distributors and retailers which will provide a clearer vision of the customer point of view and its requirements. Concluding, it is necessary to transform market relationships maintained in the final phases of the value chain towards alternative cooperative relationships. In terms of our governance approach, value chain must migrate towards balanced networks, which will propitiate a flow of continuous and valuable information for the adjustment of the products design, their production and distribution processes in order to conform with the perspectives, expectations and requirements of the final customers.
Conclusions
We have concluded that in the case of Spanish tile, ceramic industry technology innovation must be considered a competitive success factor particularly, in the case of the equipment and glazes, enamels and pigments subsectors. This since at it has been shown; these subsectors have differentiated their performance throughout the last years when comparing it with other sub sectors. Nevertheless, in view of the new empirical evidences which have been discussed in the present article, it is evident that it will be necessary to match the efforts in innovation with an applied firm cooperative strategy with those agents that belong to the commercialization phases of the tile ceramic industry. In this direction we have analyzed the industry, not solely from the point of view of clusters and relationships, but also with an analysis of qualitative nature from the point of view of value chain governance. Consequently, we have utilized an analysis of financial and accountant performance indicators, applied to five of the actors which belong to the tile ceramic industry. Therefore, we have developed an integrated methodology that allows the analysis of any industry or sector from the perspective of the existing different relationships between agents and actors, and their valuable contribution to the industry or sector in general. Nevertheless, more information will be required to broaden the conclusions in a specific form for each actor and especially in the case of the final phases of the value chain, where there are few published studies available among the various distribution modes.
(adsbygoogle = window.adsbygoogle || []).push({});
References
1. Albors-Garrigos, J., Hervas-Oliver, J.L., (2013), Disruptive Technology in Mature Industries: Its Contribution to Industry Sustainability, PICMET Proceedings, San Jose, Ca.
2. Albors, J., (2000), Study and diagnosis on the industry of machinery for the ceramic tile industry, Técnica Cerámica, Anuario, Barcelona.
3. Albors, J. (2002), Networking and technology transfer in the Spanish ceramic tiles cluster: its role in the sector competitiveness, The Journal of Technology Transfer 27 (3), 263-273
Publisher – Google Scholar
4. Albors-Garrigos, J., Hervas-Oliver, J.L., (2006), The European tile ceramic industry in the XXI century. Challenges of the present decade. Bol. Soc. Esp. Cer. Vidrio, 45,1, 13-21.
5. Albors-Garrigos, J., Hervas-Oliver, J.L., (2009), Adoption of Contingent Technology Production Strategies in Mature Industries: An Empirical Study, IBIMA Conference Proceedings, Marraketch.
6. Camagni, R. (2008), Towards a Concept of Territorial Capital, Published in: R. Capello, R. Camagni, B. Chizzolini, U. Fratesi, Modelling regional scenarios for the enlarged Europe, Springer, Berlin.
Google Scholar
7. Cooke, P., Gomez-Uranga. M., Etxebarria, G. (1997), Regional innovation systems: Institutional and organisational dimensions, Research Policy, 26, 4-5, pp. 475–491
Google Scholar
8. Foster, R., (1986), Innovation. The attackers advantage, Mckinsey, N.Y.
9. Freeman, C. (1974), The economics of industrial Innovation, pp. 197-198, Penguin Books, Ltd.
10. Freeman, C. (1996), Innovation and growth, en Dogson, M., Rothwell, R., eds. The Handbook of industrial Innovation, Edward Elgar, Cheltenham.
11. Gereffi, G. (1999), A commodity chains framework for analysing global industries, in Institute of Development Studies, 1999, Background Notes for Workshop on Spreading the Gains from Globalisation, www.ids.ac.uk/ids/global/conf/wkscf.html
Google Scholar
12. Johannisson, B., Ramírez-Pasillas, M. and Karlsson, G. (2002): “The institucional embeddedness of local inter-firm networks: a leverage for business creation”, Entrepreneurship and Regional Development, 14, 297-315
Publisher – Google Scholar
13. Hervas-Oliver, J.L., Albors-Garigos, J., Dalmau Porta, J.I. (2008), External ties and the reduction of knowledge asymmetries among clusters within global value chains: the case of the ceramic tile district of Castellon, European Planning Studies 16, 4,PP. pp. 507-520
Google Scholar
14. Humphrey, J. y Schmitz, H (2004): ”Governance in global value chains”, in Schmitz, H. ed. “Local Enterprises in the Global Economy”, Edward Elgar Publ., 95-109.
15. Kaplinsky, R.; Morris, M.A (2001), Handbook for value chain research. Institute of Development Studies; University of Sussex.
Google Scholar
16. Kaplinsky, R., and Readman, J., 2001, ‘Integrating SMEs in Global Value Chains: Towards Partnership for Development’, Vienna, UNIDO
17. McCormick, D.,;Schmitz, H. (2001) Manual for Value Chain on Homeworkers in the Garment Industry.
Google Scholar
18. Meyer-Stamer, J., Maggi, C. and Seibel, S. (2001), ‘Improving upon Nature. Creating Competitive Advantage in Ceramic Tile Clusters in Italy, Spain, and Brazil’, INEF Report 54, Duisburg: Institut
Google Scholar
19. für Entwicklung und FriedenPatel, P.; Pavitt, K., (1994), “The nature and economic importance of National Innovation System”, Science and Technology Industry Review, No. 14.
20. Pavitt, K. (1984): Sectoral patterns of technical change: towards a taxonomy and a theory, Research Policy, 13, pp. 343-373.
Publisher – Google Scholar
21. Porter, M.E. (1998), “Clusters and the New Economics of Competition”, Harvard Business Review, November-December.
Google Scholar
22. Schumpeter, J., (1911). The Theory of Economic Development: An inquiry into profits, capital, credit, interest and the business cycle, 1934 translation, Cambridge, Mass: Harvard University Press
Google Scholar
23. Schmitz, H (2000), Global Competition and Local Cooperation: Success and Failure in the Sinos Valley, Brazil, World Development Special Issue on Industrial. Clusters in Developing Countries, Vol. 27, No. 9, pp. 1627-1650.