On the Charge Carrier Time-of-Flight Mobility and the Ordering Effects in the Microcrystalline PEDOT/PSS Complex: a Morphology-Based Simulation Study

Toomas Kaevand1, Jaan Kalda2 and Ülo Lille3

1Department of Material Science, Tallinn University of Technology, Ehitajate tee 5, 19086 Tallinn, Estonia

2Institut of Cybernetics, Tallinn University of Technology, Akadeemia tee 21, 12618 Tallinn, Estonia

3Faculty of Science: Department of Chemistry, Tallinn University of Technology, Akadeemia tee 15, 12618 Tallinn, Estonia

Academic Editor: Farid K. El-Tantawy

Cite this Article as:

Toomas Kaevand, Jaan Kalda and Ülo Lille (2013), "On the charge carrier time-of-flight mobility and the ordering effects in the microcrystalline PEDOT/PSS complex: a morphology-based simulation study," International Journal of Renewable Energy and Biofuels, Vol. 2013 (2013), Article ID 181762, DOI: 10.5171/2013.181762

Copyright © 2013. Toomas Kaevand, Jaan Kalda and Ülo Lille. Distributed under Creative Commons CC-BY 3.0

Abstract

A morphology-based method for an estimation of TOF mobility values in prototypic conjugated polymer PEDOT/PSS complex has been developed. The performed research demonstrates that the DDFT-based PEDOT density fields present the real morphology of the complex under study. The developed method enables to estimate the charge carrier mobility values in the PEDOT/PSS complex in the range of PSS/PEDOT mass ratios 1.4-20.0 reflecting anisotropy, PEDOT concentration and ordering effects.

Keywords: TOF mobility, simulation, PEDOT-PSS, morphology

Introduction

Charge carrier mobility is an essential complex parameter of the conjugated polymers widely used in photovoltaic devices. The mobility related to the macroscopic transport of electrons or holes (termed further as mobility) is experimentally determined mainly by time-of-flight (TOF) experiments in the direct electric field (Bredas et al., 2004, Coropceanu et al., 2007, Grell, 2005, Laquai et al., 2007). The distinction between hole and electron transport relies not on the actual values of charge mobility, but on the ease of charge injection from electrodes used in various devices, i.e. this distinction is device-dependent. The present report is devoted to the direct probe of charge mobility and therefore this distinction is not essential.

The mobility calculations are typically performed using various simulations; the most popular method is  (a) the Gaussian disorder model solved by Monte Carlo (MC) simulations, and its variations (Bässler, 1993, Arkhipov et al., 2002); (b) recently developed charge transfer rate calculation methods which are based on the Marcus theory, combined with real or simulated morphological models (Chatten et al., 2007),(Athanasopoulos et al., 2007).

Poly(3,4-ethylenedioxythiophene) (abbreviated as PEDOT, in what follows referred to as T) forms a complex with counter ionic polystyrene sulfuric acid (PSS, below denoted by S) is a prototypic conjugate polymer (referred to as pristine) (Kirchmeyer and Reuter, 2005, Kim and Bredas, 2008, Groenendaal et al., 2000). It is prepared for the S/T mass ratios (RS/T) ranging from 1.4 to 20, and can be represented as consisting of T grains (domains) in the insulating S matrix (Smith et al., 2006, de Kok et al., 2004). The best studied compositions are those with RS/T values equal to 2.5 and 6; a pancake-like morphological model is generally accepted (Kemerink et al., 2004, Nardes et al., 2007). The macroscopic electrical conductivity is strongly anisotropic and its values in films based on the T-S-solvents compositions reach ca 1000 S/cm, which corresponds to the mobility values around 1 cm2/Vs (Ionescu-Zanetti et al., 2004, Jönsson et al., 2003).

The conductivity mechanism at the room temperature is a variable-range (VRH) hopping between the localized electronic states located in the T-rich domains of size 25x25x6 nm (Nardes et al., 2008). According to the recent studies, the conductivity is limited by the intrinsic disorder within the conducting T-rich regions (Sangeeth et al., 2009). Furthermore, it has been experimentally shown that the grains consist of individual tangles with diameter of about 5nm (Lang et al., 2009).

The calculations reported here are based on the morphology deduced from the meso-scale dynamic density functional theory (DDFT) simulations of the T-S-pristine complex summarized in (Kaevand et al., 2011); c.f. citations therein. The disorder/order relationship is presented by the model developed in this report which uses transport units in the form of rods, the volume of which is ca 3 orders of magnitude smaller than the grains used in (Nardes et al., 2008).  The aim of the this study is an estimation of: (1) the charge carrier TOF mobility values in the best-studied T-S systems, (2) the mobility (and its anisotropy) as a function of  the S/T ratio, (3) the effect of the reduction of the intrinsic disorder.

The obtained results will hopefully show the intimate details of the electrical conductivity and the full conformity of our research of the T-S systems in the range of RS/T   values between 1.4 and 20 (Kaevand et al., 2011).

Methodology

The Initial Morphology

The charge transfer takes place on an arrangement of T beads (rods) with a length of ca 3 nm and a diameter of 0.5nm (with a total volume of 2.3 nm3) consisting of 12 T monomers as derived from a coarse-graining of the molecular structure of the complex (Kaevand et al., 2011). Note that these oligomers are rigid rod molecules due to the electron-releasing effects of the ethylenedioxy groups and self-rigidification resulting from intramolecular interactions (Turbiez et al., 2003). These rods in the form of regular 3-nm-long cylinders are located and oriented randomly (see below) in a 32x32x32 cubic lattice (i.e. 323 cells with the volume of each 17.03 nm3, grid spacing a = 2.573nm), see Figure 1. The position randomness is introduced by the density fields, with the density varying from zero to one; the fields have been generated in a mesoscale simulation study. In this way, the density fields of T beads, i.e. x, y, z coordinates of all the 323cells, are transformed into a significantly higher number of single bead coordinates (2 endpoints for each rod). An additional parameter is introduced: the closest distance rij between the surfaces of the beads. A cell with the maximum density contains up to 8 beads. The torsional disorder of rods is neglected.

181762-fig-1
 
Figure 1: (a) Cubic lattice with transport units; (b) definition of the closest distance rij between the surfaces of the rods.

The microstructure of the films obtained after accommodation of rods is characterized by two-particle radial distribution functions g2(r12) which have been calculated as described in (Torquato, 2002). It makes it possible to distinguish the fully random location of rods, short and long range order in the system.

The VRH takes place between these transport units. Positive charges on the T beads and PSS as charge-compensating counter-ion are at this stage not included. Under these conditions the Ohmic transport is modeled (see below). The morphology given above leads to specific features of the presented model, including the absence of electrostatic interactions and polarization effects (as discussed in the next sections).

Calculation of Charge Transfer Parameters and the Transfer Rate

In quantum-chemical calculations we used Gaussian 09 software. The HF theory level is used as given in the 6-31G(d). This choice is justified by validating the calculations of oligothiophene radical cations at HF level with higher level hybrid DFT (BH and HLYP) calculations (Geskin et al., 2003).

Further we use the designation nT (n is the number of ethylenedioxy-thiophene rings, supplemented by +1, +2 in the case of charged T systems).

The charge transfer integrals (Vij) and the reorganization energy have been calculated by the “energy splitting in dimer”-approach as described in (Deng and Goddard, 2004). It is essential to note that the results obtained by this method are affected by the polarization effects (Valeev et al., 2006). Fortunately, these effects are negligible in the studied systems (see below).  A pair of dimers 2T (indexed with i and j) is located in the 3-d coordinate system at proper distances from each other (Figure 2). These distances are estimated using  the data on the PEDOT/PSS crystalline structure given in (Aasmundtveit et al., 1999),(Kim and Bredas, 2008) (and cit therein). This is the molecular scale. Relative to the substrate surface, the axis X and Y are in-plane and Z out-of-plane direction. This is the macroscopic, thin film scale in which the TOF signals are experimentally measured. So the Figure 2 represents the molecular and the macroscopic scale. Physically, the anisotropy of the film is introduced by the film preparation procedure as described in (Smith et al., 2006), (de Kok et al., 2004, Kemerink et al., 2004, Nardes et al., 2007)

 
181762-fig-2
 Figure 2: Dimers orientations relative to the coordinate axis. XY designates the substrate plane. ΔX is taken as the distance between the planes of the thiophene rings.
 
For the transfer of a charge carrier along each axis, from the dimer i to the dimer j, the integral Vij is calculated as 1/2(EHOMO — EHOMO-1), where EHOMO and EHOMO-1 are the energies of the frontier orbitals HOMO and HOMO-1 in the interacting dimer pair. The VX value of 6.3E-21 J (ΔX= 0.3 nm) compares reasonably well with the theoretical estimate equal to 1.6E-21 J for oligothiophenes. Note that VX for pristine PEDOT crystal is about E-20 J (Kim and Bredas, 2008). The values VY and VZ are calculated to be 4.6E-20 and 3.3E-22 J, respectively (ΔY- and ΔZ- values are 0.2 and 0.4 nm, respectively). The ratio of VX/VZ compares well with that of calculated by (Chatten et al., 2007) for poly-3-hexylthiophene.

The intra-molecular reorganization energy (λ), comprising the differences in energies of the neutral and ionized states of an acceptor and donor molecule was calculated for 2T(+1) to be equal to 1.3781E-19 J. At the same time, the ionization potential value of 5.59 for 4T(+1) eV was obtained. The latter matches well with the experimental value 5.6-5.9 eV (Wang and Park, 2009). Most importantly, the condition λ ˃ Vij  is fulfilled, hence, the charge transfer takes place in the non-adiabatic regime and the hopping approximation is valid (Nelson et al., 2009). The ca twice lower value of λ obtained in (Hutchison et al., 2005) is probably caused by the use of different quantum chemical calculation methods. It should be mentioned that the research of (Dkhissi et al., 2003) points to the difference in the calculation results of the PEDOT electronic structure, obtained via (a) the density functional  and (b) the Hartree-Fock methods, i.e. DFT leads to the charge delocalization which results in the reduction of λ. Quite interestingly, such phenomenon is not observed in non-substituted oligothiophenes (Geskin et al., 2003).

These parameters have been used to calculate the charge transfer rate based on the non-adiabatic Marcus-Hush theory:

Γij = 2 Ï€/ħ V2ij 1/(4Ï€ λkBT) -1/2exp – (eΔrijF—λ)2 /4λkBT,     (1),

Where e, Δrij and F are the electron charge, the distance between the charge carriers and the strength of the electric field, kB is Boltzmann’s constant and T temperature, respectively (here all parameters are in SI units).

Note that the quantity e∆ijF in the eq.(1) represents the free energy difference between the initial and final site. It means that the electrostatic interactions and polarization effects are neglected (Athanasopoulos et al., 2007).  This is a reasonable presumption because the charge carriers are rigid T rods of the same geometry (see last paragraph of section 2.1). Taken together, these two circumstances lead to a negligible energetic disorder in our systems. This is in accordance with the origin of this disorder in organic conducting systems (Baumeier et al., 2010). Moreover, in this report the authors focus on the effect of the changes in the morphology alone. 

Vij values vary with the separation r between the T beads proportionally to exp(-rij/r0) , where  the wave function decay length r0 = 0.26 nm (grid spacing is a/10, the value typically used  in quantum-chemical calculations of conjugated polymers (Tanase et al., 2003)) .

The Macroscopic Charge Transport Modeling

The charge transport is modeled by the MC method used in (Athanasopoulos et al., 2007). For the determination of the charge carrier mobility, 40-400 individual charge carriers are inserted at a the edge, parallel to the electrodes as in the TOF experiment (XY plane of the calculation cube), the biasing voltage 4-400 V (Z direction) is applied and transit times (ttr) of all individual carriers across that plane (i.e. the sum of values τ = -ln(X)/Γij), where X is random number between 1 and zero), are registered. This procedure is repeated second and third time after turning the cube by 90 degrees and thus calculating the ttr values across the XZ and YZ planes, as well (Y and X directions respectively). The averaged ttr values for each three directions are calculated as an averaged sum of τ. All calculations are performed by our own algorithm; cutoff values of 5 nm are used. According to (Pasveer et al., 2005), the maximum hopping distance is estimated as (3a)1/2, equal to 2.778 nm.

The mobility μ is calculated as μ = ν/F = d/Fttr = d2/Vttr, where ν is the speed of the charge, d is the thickness of the film, F is the electric field induced by the applied voltage V, and F = V/d, usually 104-106 V/cm (Coropceanu et al., 2007). Biasing voltage 4 V is mainly used; layer thickness 82.3 nm leads to the electric field strength 5.18 105 V/cm.

Low charge carrier density (see below) and absence of permanent dipoles in the systems results in ohmic regime as shown in (Grell, 2005, Zhuo et al., 2008).

The results from the simulation underwent a rough comparison by the use of the concentration/conductivity method μ = ϭ/ne where ϭ, n and e designate the experimental electrical conductivity, charge carrier density and electron charge, respectively (Karl, 2003).

All calculations were carried out for the temperature equal to 300 K; periodic boundary conditions were used.

Results and Discussion
 
The transformation of the density fields of the T beads to the respective particle-based data shows the correct transformation: (correlation of Nb vs cT, R2 = 0.99, where cT designates the volume fraction of T beads as calculated in (Kaevand et al., 2011)).

The radial distribution functions g(r) of the obtained materials shows clearly for the whole interval of studied systems the presence of a short-range order, i.e. the microcrystalline structures are formed (Figure 3). This is not surprising because rod volume is only ca 3.7 times higher than that of pristine PEDOT crystal (Kim and Bredas, 2008). Note that the number of EDOT units is 12 and 4 respectively. This result is in agreement with these of the physical experiments (Aasmundtveit et al., 1999), (Ionescu-Zanetti et al., 2004).

181762-fig-3
Figure 3: Radial distribution function g2(r12) of the systems 1 (a), 2 (b), 7 (c)  and crystal-like (d), the number density N/V values are 0.22, 0.16, 0.056 and 0.4 respectively

TOF signals in the Figure 4 indicate the presence of a fast normal transport. It reflects the nature of our experiment: (1) single charge-carriers are inserted; thus, any initial spreading is avoided, and (2) the thin film thickness is ca two orders of magnitude less than that of usually used in the TOF signal measurements (82 nm vs. ca 12 μ). In thicker films, an anomalous charge carrier transport takes often place, i.e. the tail of the TOF signal is lengthened to few orders of magnitude) (Tyutnev et al., 2008). As discussed below the out-of-plane transport (Z-direction) shows more dispersive character.

181762-fig-4
 
Figure 4: TOF signals in the system 2 in the directions Z, X and Y (horizontal axis shows the transit time, and vertical one — the number of electrons).
 
Calculated time-of-flight values are relatively large, in general higher than 0.1 ns, leading to the reasonable in-plane mobility values (Table 1, directions Y and X). Values for the basic systems 2 and 4 agree satisfactorily with the results obtained by the concentration/experimental conductivity data in spite of very different carrier density values. Specifically, in the system 2 (global conductivity σ = 0.4 S/cm, S/T 2.5, specific density 1.45 g/cm3  and the doping level 0.25), n = 4.4520 cm-3. It compares well with the data in (Zhuo et al., 2008) (3.020, doping level 0.3, mass ratio 3.85). 

Table 1: Transport properties for X-Y- and Z-directions
181762-tab-1
1) The conductivity values given by Kaevand et al., (2011) are used.
2) The number density N/V in all directions is ca 0.4.

The out-of-plane mobility values (Z-direction) are ca 6-7 orders of magnitude lower than the others (experimentally ca 4-5 orders lower (Ionescu-Zanetti et al., 2004, Nardes et al., 2007), see below.

In the sequence of systems from 1 to 7, the time-of-flight systematically increases, and mobility values systematically decrease by ca 3-7 orders of magnitude. This is in accordance with the results of physical experiments, and with general theoretical considerations (Bässler, 1993). This is a remarkable outcome because in our model, energetic disorder (diagonal one in the Bassler formalism) is negligible (see section 2.2). It seems that this agreement points to the decisive role of packing effects (effects of the off-diagonal or positional disorder, see below).  Note that in the X direction, for the sequence of systems 3-7, these parameters change in a somewhat lesser extent, and for the mobility, a higher than expected trend is observed. It is explained by the presence of special morphological features in these systems, of the coaxial cylinders as shown in (Kaevand et al., 2011). Such cylinders can be interpreted as predecessors (i.e. the states before shrinkage) of PEDOT nanofibers, which have been obtained recently (Laforgue and Robitaille, 2010).

An increase of the S/T ratio leads to extraordinary high values of the out-of-plane flight times and to a low mobility. This phenomenon takes place not only due to the low VZ value (see section 2.2). Indeed, although an increase of it by ca one order of magnitude results in an increase of the respective mobility by ca 3 orders, this effect does not account for the remaining mismatch by 3 orders of magnitude, as compared to the in-plane mobility (these supplementary data are available upon request). Apparently the out-of-plane mobility is suppressed due to the morphological reasons, i.e. simulation results are in accordance with the pancake-like model.

The increase of the S/T ratio in the studied systems results in an increase of the the average hopping distance árhñ along the carrier trajectories by ca one order of magnitude (from ca 0.1 to 1 nm). Similar increase of the mean spacing Nb-1/3 in the domains of the T rods is observed (which correlates well with the values of árhñ in all directions, R2˃0.98). Apparently, the carrier moves along the optimal path in these domains. It is essential that the trajectories in the out-of-plane direction are much longer in comparison to those of in-plane orientations: the average number of the hops along the trajectories in Z-direction is ca one order of magnitude higher than in the case of X-, Y-directions (data available upon request).

The charge carrier mobility field dependence is not studied in detail in this report and will be the object of the future research. Our preliminary results  show in the range of ca 5 x 10⁵  – 5 x 10⁶ V/cm the negative field dependence (Fig. 5) which is characteristic of materials where the degree of energetic disorder is small in comparison to the positional disorder as stated in  (Tuladhar et al., 2009). As shown above our systems belong to this type of materials.

181762-fig-5
 
 Figure 5: Poole-Frenkel plot, mobility values for system 2 calculated in shown directions (X, Y, Z)
 
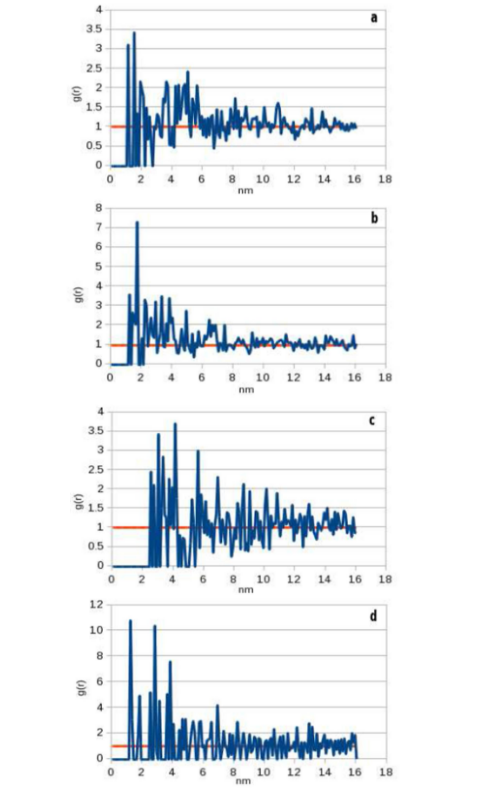
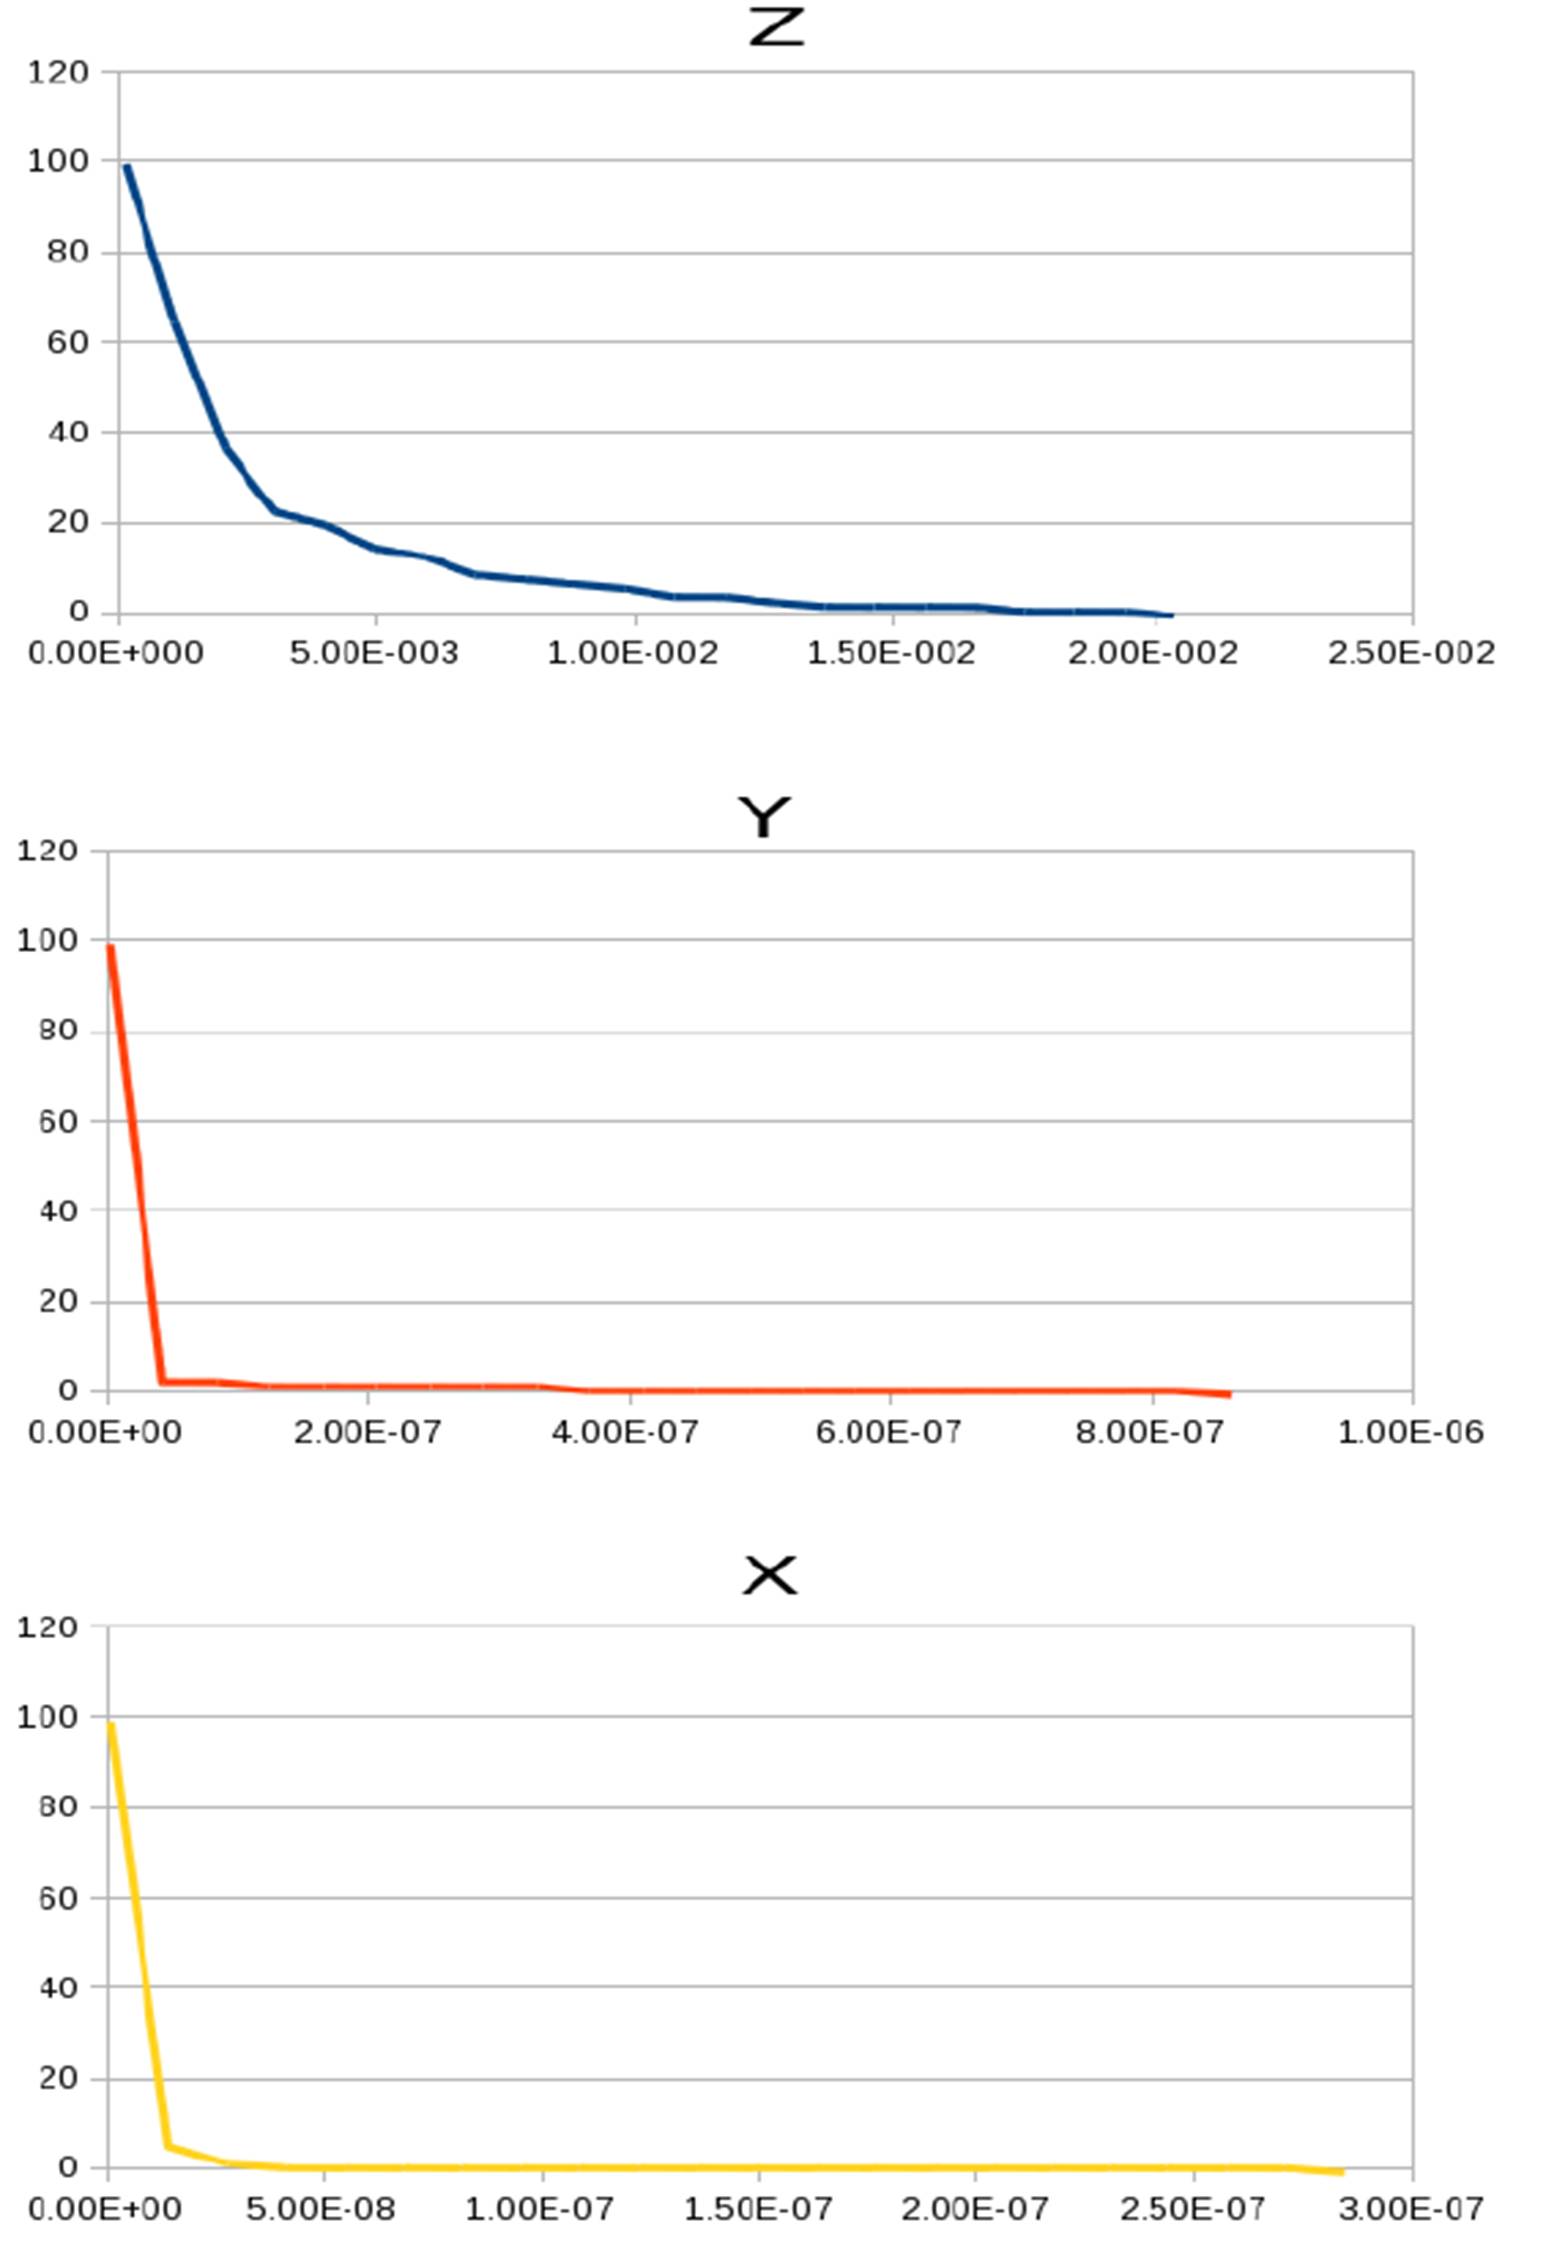
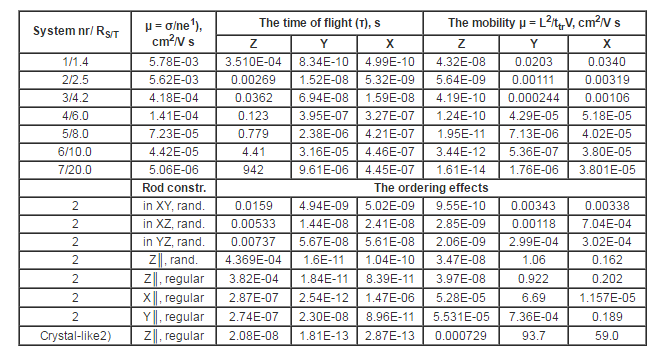
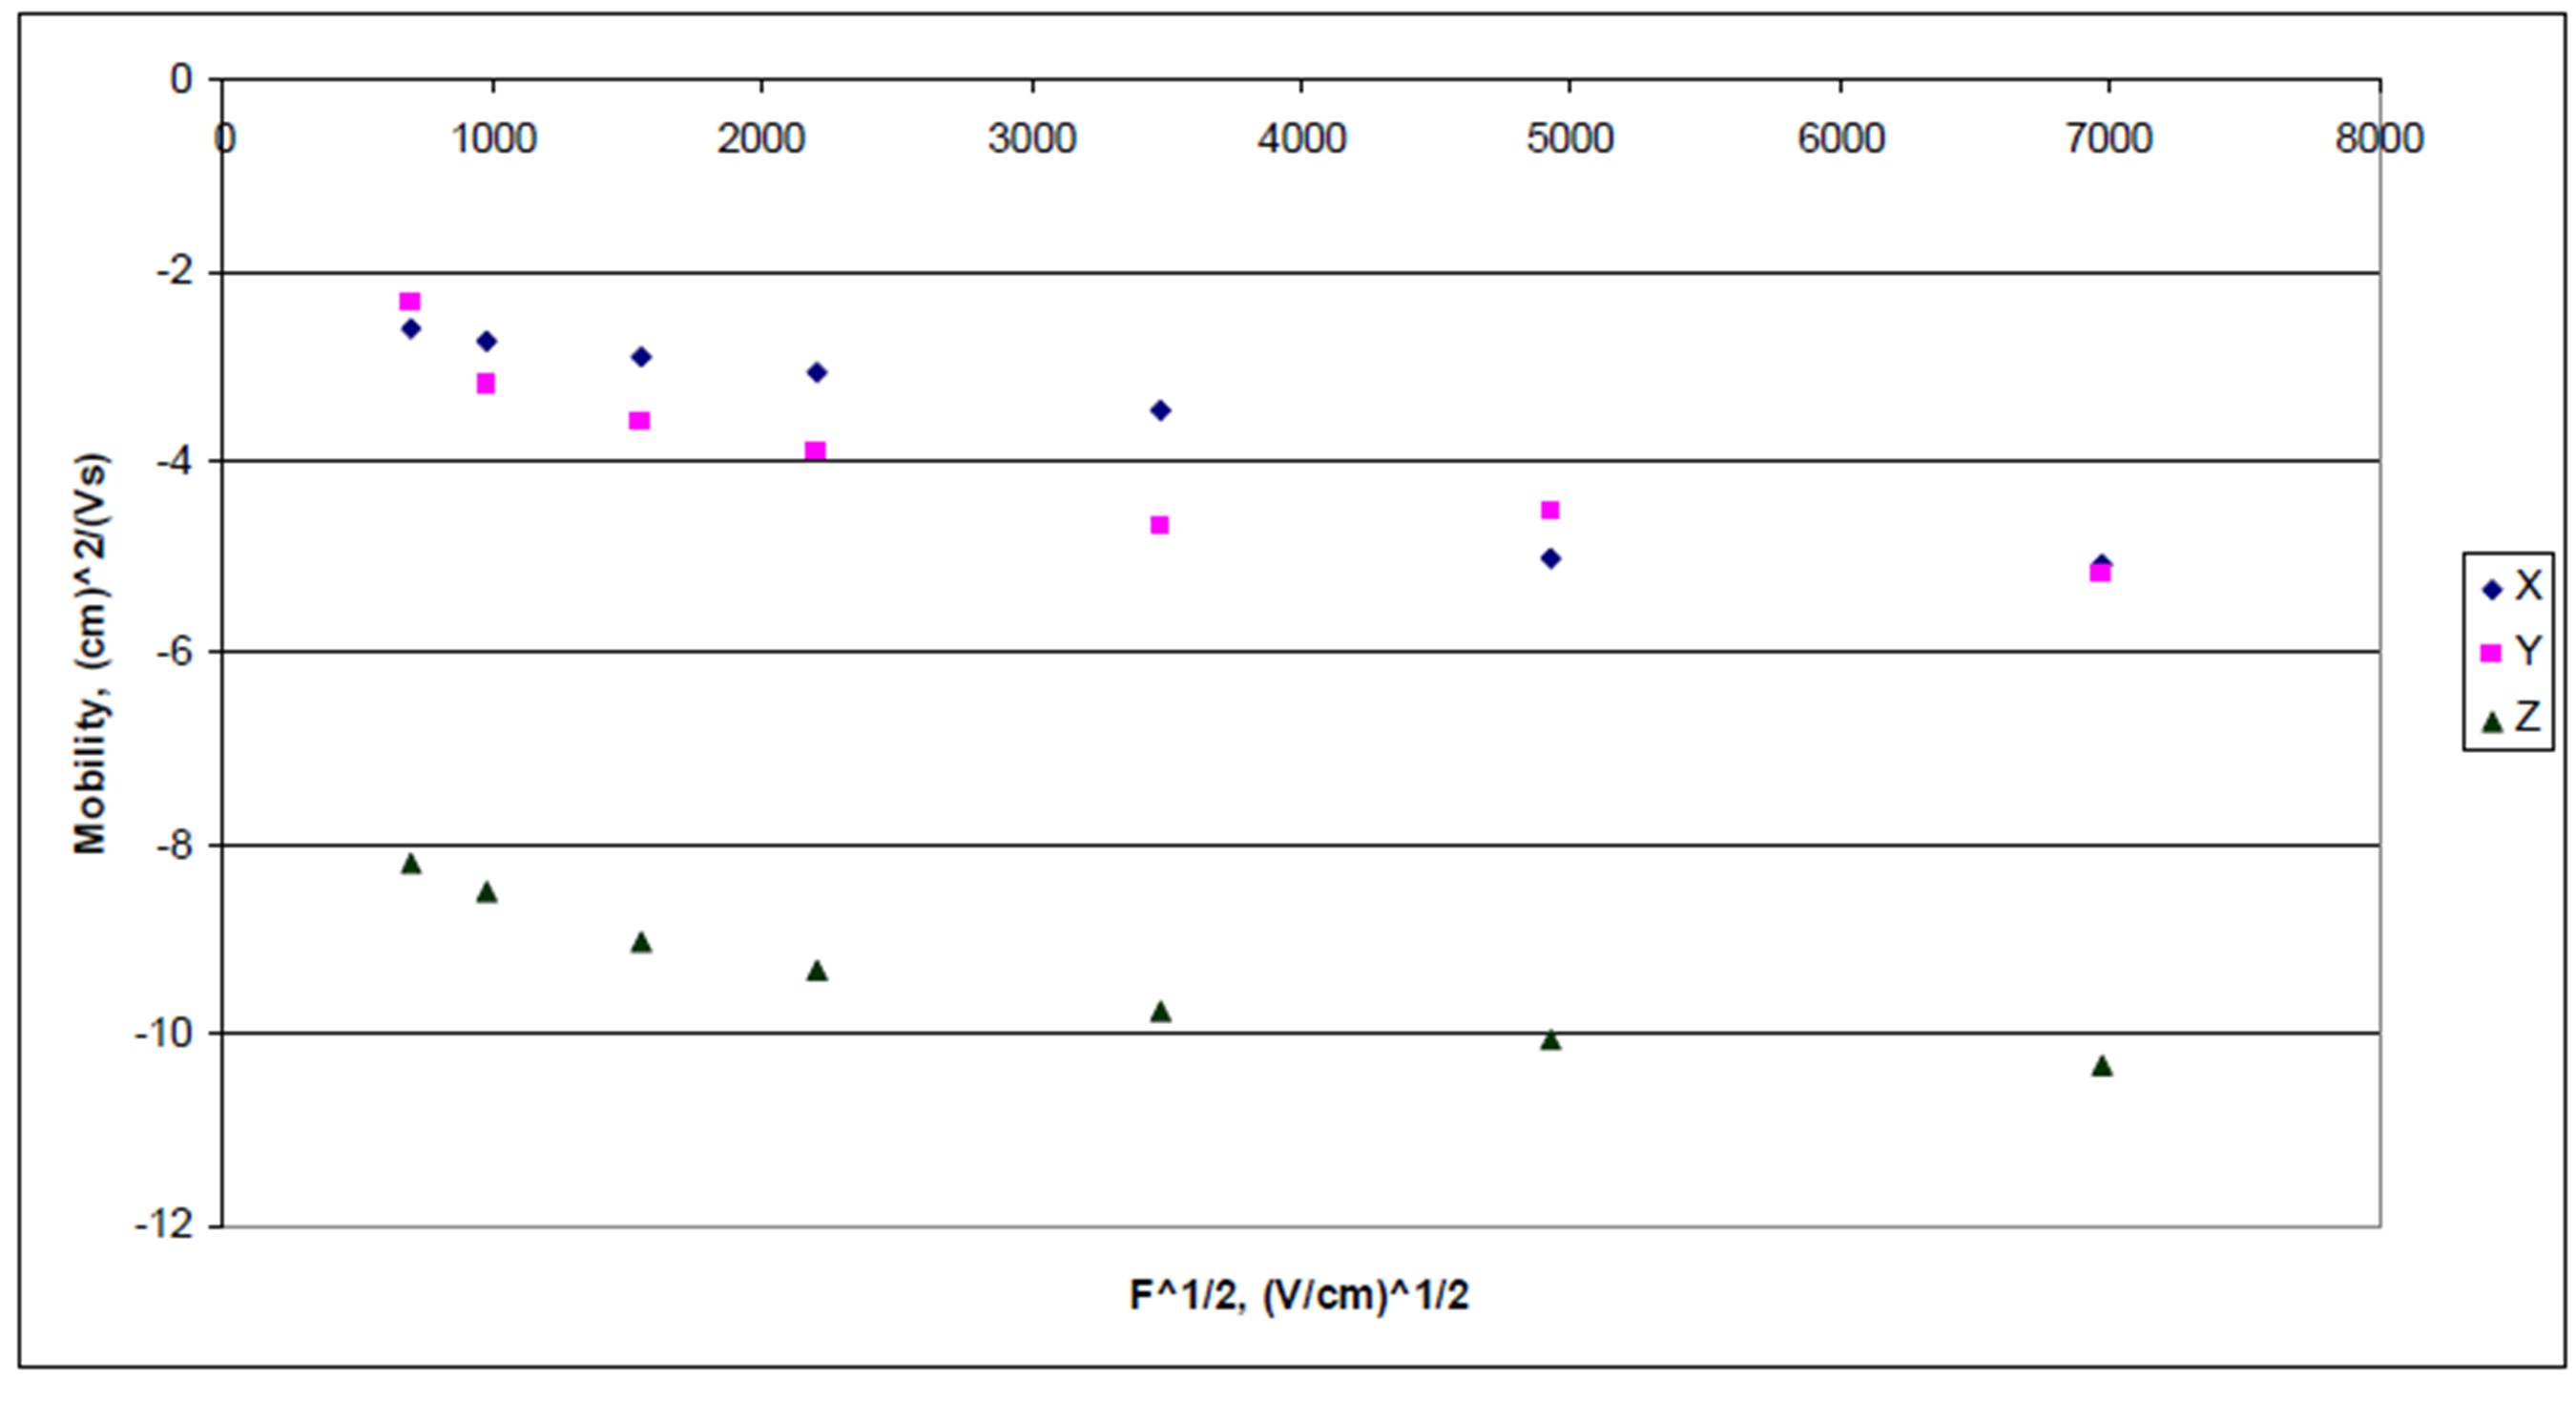
Introduction of the constraint “rods in XY plane” does not change essentially the mobility. This reflects the substrate surface effect used in generation of the initial morphology (Kaevand et al., 2011). On the contrary, constraining rods in other planes mostly decrease the carrier mobility. Parallel to the Z-axis orientation of the rods results in the increase of the ordered region: compare how the radial distribution functions in Figure 3(b) and 3(d) are accompanied by the increase of the charge carrier in-plane mobility by ca 2-3 orders, resulting in the mobility values of ca 1 cm2/Vs, particularly in the Y-direction. Constraining the rods parallel to the X and Y directions increases the mobility in the direction perpendicular to these axes. Hence, the carrier hopping between the parallel rods is dominating. This is in accordance with the data of the physical experiment, i.e. in the highly conducting region of size ca 10×10 nm, mobility value ca 2 cm2/Vs (diode configuration, F = 106 V/cm) has been observed (Ionescu-Zanetti et al., 2004) and with the basic nature of the TOF mobility being controlled by interchain hopping (Laquai et al., 2007). 

It is noteworthy that the 2-d lamella structure in polythiophenes (obtained on the HMDS-treated substrate to enable better self-organization) and the measured in field-effect transistor structure gives μ value up to 0.1 cm2/Vs (Sirringhaus et al., 1999).

In the crystal-like system, in which the number of rods has been increased by a factor of 2.4, the mobility increases ca by five orders of magnitude. In this system, the in-plane conductivity equals to that of metallic copper. This is a hypothetical structure with high number density value (N/V=0.39) and can be realized by introducing a low molecular mass counter-ion (only 1/6 of the cubic box is free for that purpose). Note that in the systems 1 to 7, the N/V values decrease from 0.2 to 0.05.

The mobility of charge carriers in an ordered crystalline material is determined by the bandwidth of the conduction band and experimentally determined by the time-resolved microwave conductivity measurements, leading to the detection of the intrachain mobility values in the ladder-type poly(p-phenylenes) of up to 30 cm2/Vs (Prins et al., 2006). Unfortunately, the analysis of the intra-chain mobility is outside of the possibilities of the approach presented here.

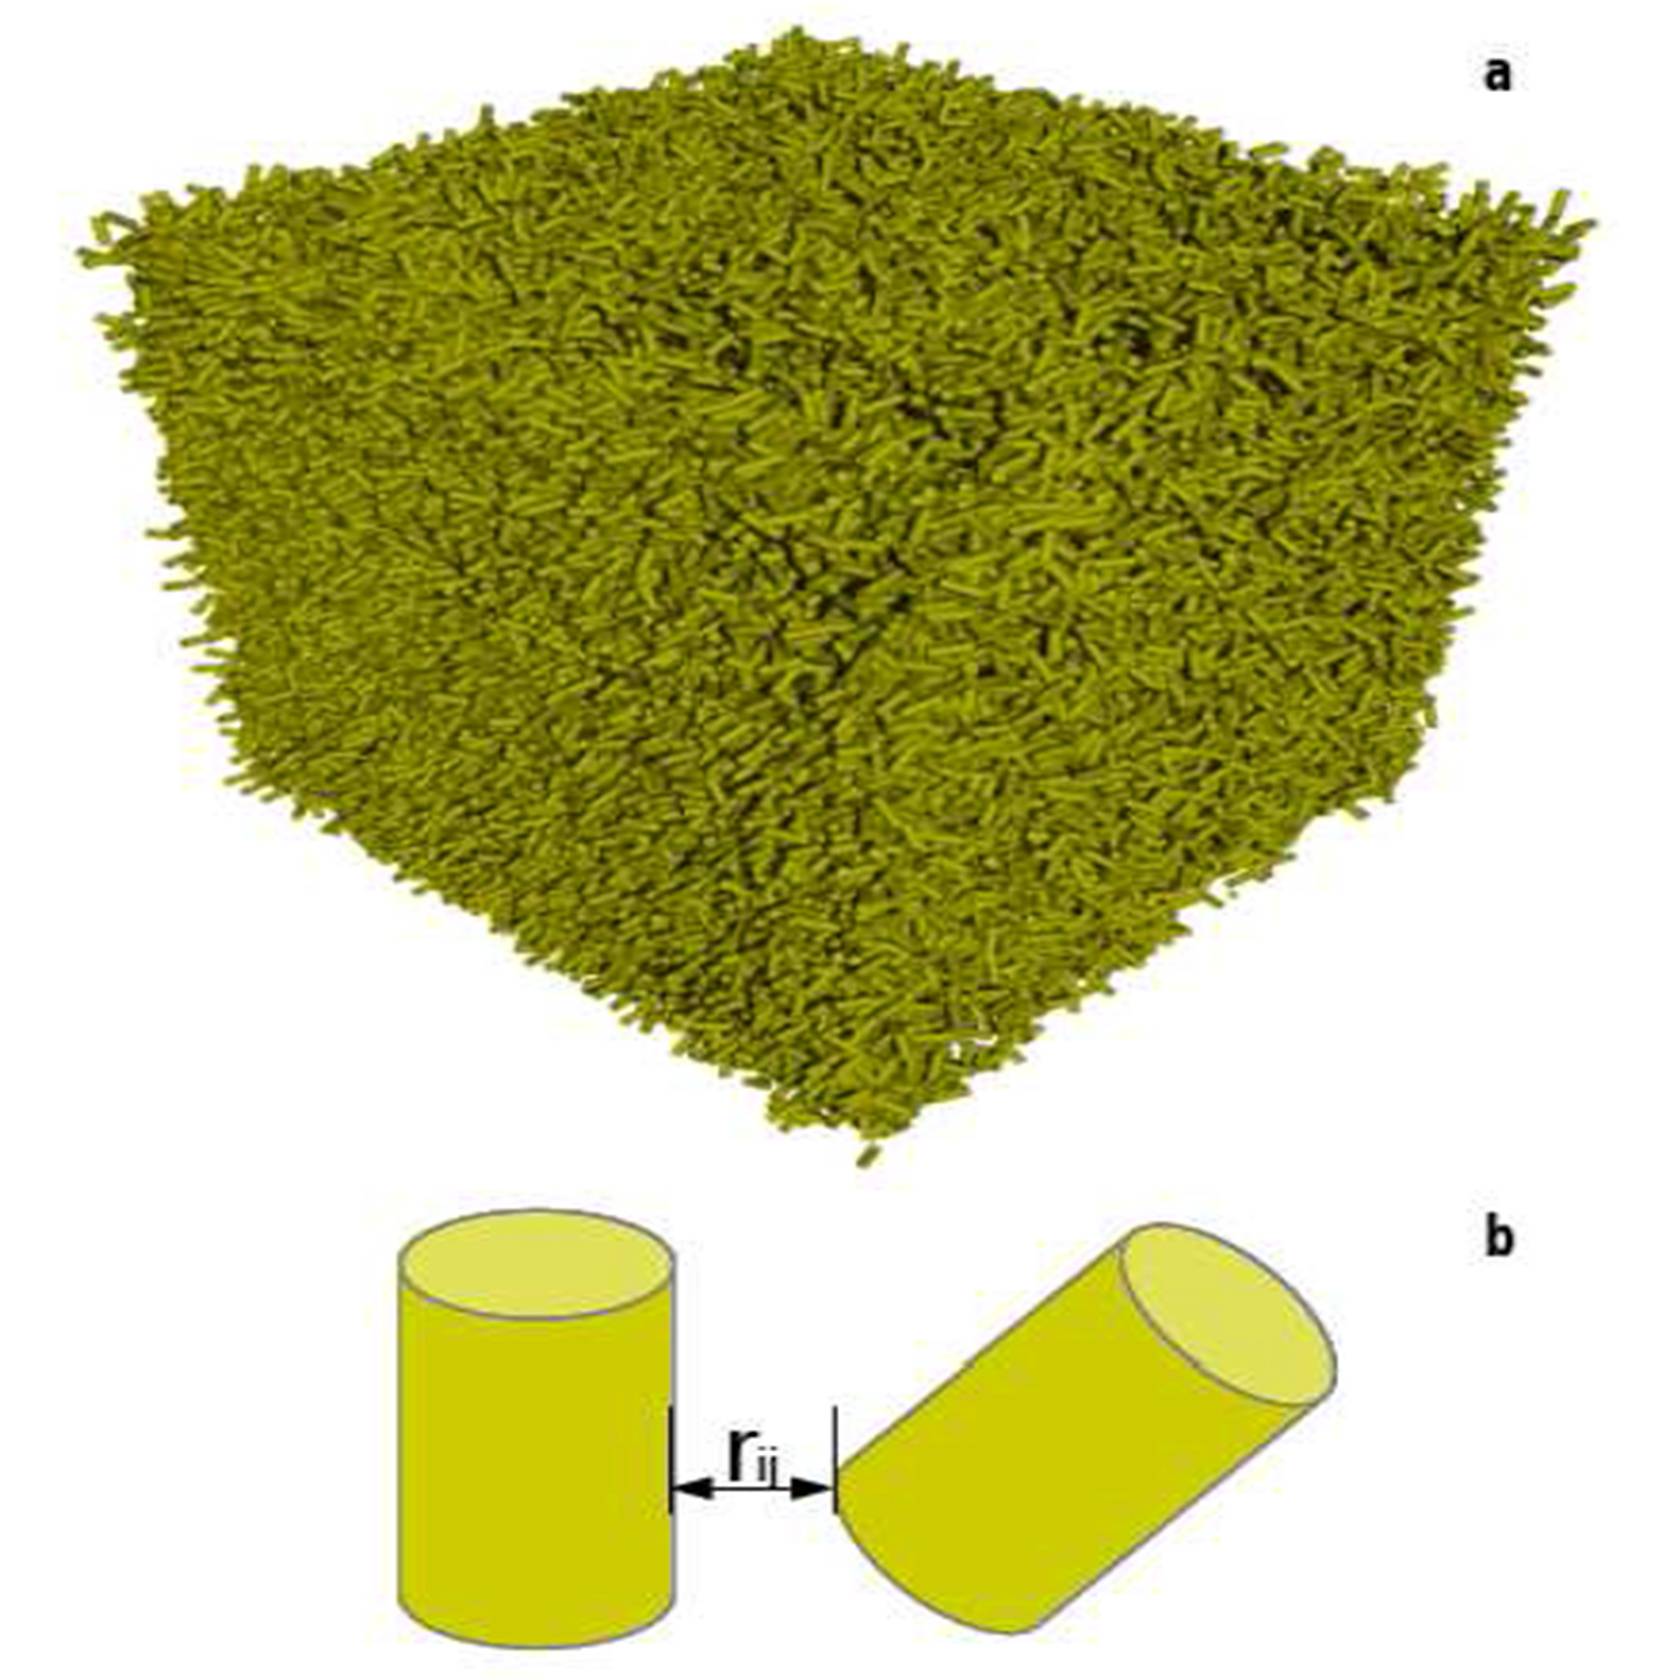
This study is based on the PEDOT/PSS complex morphology, which has been obtained in our previous research (Kaevand et al., 2011), and proven to be realistic. In spite of the fact that only the T beads have been in the focus of this research, the obtained results are reasonable, and the developed method proved to be simple and easy to implement.

Conclusions

A morphology-based method for an estimation of TOF values in a prototypic conjugated polymer PEDOT, complexed with PSS, has been developed. This method makes it possible to estimate the charge carrier mobility values over the whole range of PEDOT/PSS compositions and to reflect the anisotropy, PEDOT concentration and ordering effects. It is likely that the method can be used in other conjugated polymer systems, as well.

Acknowledgement
   
The authors are grateful to the dean of faculty of Chemistry and Material Sciences of the Tallinn Technical University Prof. A. Öpik for the inspiration and financial support.

References

AASMUNDTVEIT, K. E., SAMUELSEN, E. J., PETTERSSON, L. A. A., INGANAS, O., JOHANSSON, T. & FEIDENHANS’L, R. 1999. Structure of thin films of poly(3,4-ethylenedioxythiophene). Synthetic Metals, 101, 561-564.
Publisher 

ARKHIPOV, V. I., HEREMANS, P., EMELIANOVA, E., V., , ADRIAENSSENS, G. J. & BÄSSLER, H. 2002. Weak-field carrier hopping in disordered organic semiconductors: the effect of deep traps and partly filled density-of -states distribution J.Phys.: Condens. Matter, 14, 9899-9911.
Publisher 

ATHANASOPOULOS, S., KIRKPATRICK, J., MARTINEZ, D., FROST, J. M., FODEN, C. M., WALKER, A. B. & NELSON, J. 2007. Predictive study of charge transport in disordered semiconducting polymers. Nano Letters, 7, 1785-1788.
Publisher – Google Scholar

BAUMEIER, B., KIRKPATRICK, J. & ANDRIENKO, D. 2010. Density-functional based determination of intermolecular charge transfer properties for large-scale morphologies. Phys.Chem. Chem,. Phys., 112, 11103-11113.
PublisherGoogle Scholar

BREDAS, J. L., BELJONNE, D., COROPCEANU, V. & CORNIL, J. 2004. Charge-transfer and energy-transfer processes in pi-conjugated oligomers and polymers : A molecular picture. Chem. Rev., 104, 4971-5003.
PublisherGoogle Scholar

BÄSSLER, H. 1993. Charge transport in disordered organic photoconductors: A Monte Carlo simulation study. Phys. stat. sol, 175, 15-56.
Publisher 

CHATTEN, A. J., BALLANTYNE, A. M., FROST, J. M., ASTUTI, Y., DURRANT, J., R. ,  & NELSON, J. 2007. Influence of morphology on charge dynamics in conjugated polymers and blends for solar cell applications. 22nd European Photovoltaic Solar Energy Conference, Milan, Italy, 579-583.

COROPCEANU, V., CORNIL, J., DA SILVA FILHO, D., A., OLIVIER, Y., SILBEY, R. & BREDAS, J. L. 2007. Charge transport.in organic semiconductors. Chem. Rev., 107, 926-952.
PublisherGoogle Scholar

DE KOK, M., BUECHEL, M., VULTO, S., VAN DE WEIJER, MEULENKAMP, P., DE WINTER, S., MANK, A., VORSTENBOSCH, H., WEIJTENS, C. & VAN ELSBERGEN, V. 2004. Modification of PEDOT: PSS as hole injector layer in polymer LEDs. Phys. stat sol. (a), 201, 1342-1359.
Publisher 

DENG, W. Q. & GODDARD, W. A. 2004. Predictions of hole mobilities in oligoacene organic semiconductors from quantum mechanical calculations. Journal of Physical Chemistry B, 108, 8614-8621.
PublisherGoogle Scholar

DKHISSI, A., BELJONNE, D., LAZZARONI, R., LOUWET, F., GROENENDAAL, L. & BREDAS, J. L. 2003. Density functional theory and Hartree-Fock studies of the geometric and electronic structure of neutral and doped ethylenedioxythiophene (EDOT) oligomers Int. J. of Quant. Chem., 91, 517-523.
Publisher 

GESKIN, A. M., DKHISSI, A. & BREDAS, J. L. 2003. Oligothiophene radical cations: Polaron structure in hybrid DFT and MP2 calculations Int. J. of Quant. Chem., 91, 350-354.
Publisher – Google Scholar

GRELL, M. 2005. Electronic and electro-optic molecular materials and devices. In: KELSALL, R. W., HAMLEY, I. W. & GEOGHEGAN, M. (eds.) Nanoscale science and technology. John Wiley&Sons, Ltd.
Publisher 

GROENENDAAL, L. B., JONAS, F., FREITAG, D., PIELARTZIK, H. & REYNOLDS, J. R. 2000. Poly(3,4-ethylenedioxythiophene) and its derivatives: past, present and future Adv.Mater., 12, 481-494.
PublisherGoogle Scholar

HUTCHISON, G., RATNER, M. & MARKS, T. 2005. Hopping Transport in Conductive Heterocyclic Oligomers: Reorganization Energies and Substituent Effects. JACS, 127, 2339-2350.
Publisher

IONESCU-ZANETTI, C., MECHLER, A., CARTER, S. A. & LAL, R. 2004. Semiconductive Polymer Blends: Correlating Structure with Transport Properties at the Nanoscale. Adv. Mater., 16, 385-389.
PublisherGoogle Scholar

JÖNSSON, S. K. M., BIRGERSON, J., CRISPIN, X., GRECZYNSKI, G., OSIKOWICZ, W., DENIER VAN DER GON, A. W., SALANECK, W. R. & FAHLMAN, M. 2003. The effects of solvents on the morphology and sheet resistance in poly(3,4-ethylenedioxythiophene)-polystyrenesulfonic acid (PEDOT-PSS) films. Synthetic Metals, 139, 1-10.
PublisherGoogle Scholar

KAEVAND, T., KALDA, J., KUKK, V., ÖPIK, A. & LILLE, Ü. 2011. Correlation of the morphology and electrical conductivity in thin films of PEDT/PSS complex: an integrated meso-scale simulation study. Molecular Simulation, 37.

KARL, N. 2003. Charge carrier transport in organic semiconductors. Synthetic Metals, 133-134, 649-657.
Publisher 

KEMERINK, M., TIMPANARO, S., DEKOK, M. M., MEULEMKAMP, E. A. & TOUWSLAGER, M. J. 2004. Three-dimensional inhomogeneities in PEDOT: PSS films. J.Phys.Chem.B, 108, 18820-18825.
Publisher 

KIM, E. G. & BREDAS, J. L. 2008. Electronic Evolution of Poly(3,4-ethylenedioxythiophene) (PEDOT): From the Isolated Chain to the Pristine and Heavily Doped Crystals. Journal of the American Chemical Society, 130, 16880-16889.
Publisher 

KIRCHMEYER, S. & REUTER, K. 2005. Scientific importance, properties and growing applications of poly(3,4-ethylenedioxythiophene). Journal of Materials Chemistry, 15, 2077-2088.
Publisher 

LAFORGUE, A. & ROBITAILLE, R. 2010. Production of Conductive PEDOT Nanofibers by the Combination of Electrospinning and Vapor-Phase Polymerization. Macromolecules, 43, 4194-4200.
PublisherGoogle Scholar

LANG, U., MULLER, E., NAUJOKS, N. & DUAL, J. 2009. Microscopical Investigations of PEDOT:PSS Thin Films. Advanced Functional Materials, 19, 1215-1220.
Publisher 

LAQUAI, F., WEGNER, G. & BASSLER, H. 2007. What determines the mobility of charge carriers in conjugated polymers? Philos Transact A Math Phys Eng Sci, 365, 1473-87.

NARDES, A. M., JANSSEN, R. A. J. & KEMERINK, M. 2008. A morphological model for the solvent-enhanced conductivity of PEDOT : PSS thin films. Advanced Functional Materials, 18, 865-871.
Publisher

NARDES, A. M., KEMERINK, M., JANSSEN, R. J. A. M., BASTIAANSEN , J., KIGGEN, N. M. M., LANGEVELD, B., VAN BREEMEN, A. & DE KOK, M. 2007. Microscopic understanding of the anisotropic conductivity of PEDOT : PSS thin films. Advanced Materials, 19, 1196-1200.
Publisher 

NELSON, J., KWIATKOWSKI, J. J., KIRKPATRICK, J. & FROST, J. M. 2009. Modeling Charge Transport in Organic Photovoltaic Materials. Acc Chem Res.
Publisher 

PASVEER, W. F., COTTAAR, J., TANASE, C., COEHOORN, R., BOBBERT, P., BLOM, P., DE LEEUW, M., MICHELS, M. & 2005. Unified description of charge carrier mobilities in disordered semiconducting polymers Physical Review Letters, 94, 206601-1 to 206601-4.

PRINS, P., GROZEMA, F., SCHINS, J., SAVENIJE, T. P., S., SCHERF, U. & SIEBBELES, L. 2006. Effect of intermolecular disorder on the intrachain charge transportin ladder-type poly(p-phenylenes. Phys.  Rev. B, 73, 045204-1 to 9.

SANGEETH, C. S. S., JAISWAL, M. & MENON, R. 2009. Correlation of morphology and charge transport in poly(3,4-ethylenedioxythiophene)-polystyrenesulfonic acid (PEDOT-PSS) films. Journal of Physics-Condensed Matter, 21, 072101-106.

SIRRINGHAUS, H., BROWN, R., FRIEND, H., NIELSEN, M., BECHGAARD, K., LANGEVELD-VOSS, B.A. J. H. SPIERING, B., JANSSEN, R., MEIJER, E., HERWIG, P. & DE LEEUW, D. 1999. Two-dimensional charge transport in self-organized, high-mobility conjugated polymers. Nature, 401, 685-689.
Publisher Google Scholar

SMITH, R. R., SMITH, A. P., STRICKER, J. T., TAYLOR, B. E. & DURSTOCK, M. F. 2006. Layer-by-layer assembly of poly(ethylenedioxythiophene): poly(styrenesulfonate). Macromolecules, 39, 6071-6074.
Publisher 

ZHUO, J., LI-HONG ZHAO, L., CHIA, P., SIM, W., FRIEND, R. & HO, P. 2008. Direct Evidence for Delocalization of Charge Carriers at the Fermi Level in a Doped Conducting Polymer Physical Review Letters, 100, 186601-4.

TANASE, C., MEYER, E., J., BLOM, P., W. & DE LEEUW, D. M. 2003. Unification of the Hole Transport in Polymeric Field-Effect Transistors and Light-Emitting Diodes Phys.Rev. Lett., 91, 216601-216604.
PublisherGoogle Scholar

TORQUATO, S. 2002. Random Heterogeneous Materials. Microstructure and Macroscopic Properties, Springer.
Publisher Google Scholar

TULADHAR, S., SIMS, M., KIRKPATRICK, J., MAHER, R., CHATTEN, A., BRADLEY, D., NELSON, J. & 2009. Influence of alkyl chain length on charge transport in symmetrically substituted poly(2,5-dialkoxy-p-phenylenevinylene) polymers.Phys. Rev. B, 79, 035201-035210.
PublisherGoogle Scholar

TURBIEZ, M., FRERE, P. & RONCALI, J. 2003. Stable and Soluble Oligo(3,4-ethylenedioxythiophene)s End-Capped with Alkyl Chains J.Org. Chem., 68, 5357-5360.
PublisherGoogle Scholar

TYUTNEV, A. P., SAENKO, V. S., PODZHIDAEV, E. D. & IKHSANOV, R. S. 2008. Time of flight results for molecularly doped polymers revisited. J.Phys.Condens. Matter, 20, 215219 (6pp).

VALEEV, E. F., COROPCEANU, V., DA SILVA FILHO, D., A., SALMAN, S. & BREDAS, J. L. 2006. Effect of Electronic Polarization on Charge-Transport Parameters in Molecular Organic Semiconductors. JACS, 128, 9882-9886.

WANG, S. J. & PARK, H. H. 2009. Electronic properties of hybridized poly (3, 4-ethylenedioxythiophene): Polystyrene sulfonate with surface-capped CdSe nanocrystals. Journal of Applied Physics, 105, 023716-1 to 023716-5.


Shares