Introduction
Biodiesel is considered an environmentally friendly alternative to conventional diesel fuel, being biodegradable, renewable and having low emission characteristics (USEPA, 2002). It is routinely produced from triglycerides (TG) obtained from vegetable or animal lipid sources which are catalytically transesterified to produce fatty acid methyl esters (FAMEs) using excess methanol in the presence of a strong base such as sodium or potassium hydroxide. The production of FAMEs by base catalysis is simple, rapid and reliable at relatively low temperatures and pressures, making it a reasonably economic commercial process. Other alcohols, such as ethanol can be substituted for methanol to produce biodiesel, yielding ethyl esters and glycerine instead of methyl esters and glycerine, however, methanol is preferred because of its lower costs and easier separation from glycerol (Bondioli, 2004; Gerpen, 2005;, Meher et al., 2006).
A wide variety of TG sources can be used for biodiesel production, including recycled frying oils, vegetable oils, animal fats and biomass extracts (Algae Fuel). The fatty acid composition of the feedstock strongly influences the properties of the biodiesel produced, including its cetane number, cloud point and pour point, oxidative stability, and viscosity (Knothe,2005; Bajpai and Tyagi, 2006). The presence of free fatty acids (FFAs) and moisture in the feedstock are key variables affecting the efficiency of the biodiesel production process, these resulting in soap formation and incomplete conversion of TGs to FAMEs as well as complicating subsequent biodiesel purification. For high FFA feedstock, direct acid catalyzed esterification can be used to minimize FFAs and thus improve biodiesel yield. Other variables such as temperature, amount of catalyst, use of co-solvents and reaction time also affect the efficiency of the process (Gerpen, 2005). At the conclusion of the transesterification process, biodiesel contains residual methanol, moisture, triglyceride and FFA and/or partly reacted by-products such as mono- and di-glycerides which affect biodiesel quality. Basic quality standards exist for biodiesel to ensure satisfactory diesel engine operation under a variety of conditions having been set by the American Society for Testing and Materials (ASTM) 6751-02 in North America and EN 14214 in Europe. Both standards detail requirements in terms of biodiesel composition, physical properties and the relevant standard test methods to be used to ensure their requirements are met.
The analytical method currently used to monitor the biodiesel production and final biodiesel quality is gas chromatography (GC) for both the ASTM and EN standards. This method is widely applied to determine various key contaminants such as mono-, di- and tri-glycerides and glycerol. The drawback of the GC method is that it is time consuming in terms of sample preparation and analysis and therefore it is not suitable for biodiesel process monitoring. Other methods reported to have been used to monitor or analyze biodiesel production include HPLC (Holcapek et al., 1999; Komers et al., 2001;Türkan and Kalay, 2006), gel permeation chromatography (GPC) (Dubé, et al., 2004), size-exclusion chromatography (Arzamendi, et al., 2006), NMR (Gelbard, et al., 1995) and FTIR spectroscopy (Zagonel, et al., 2004; Knothe, 2006;Trevisan et al., 2008) Raman spectroscopy (Chesti, et al., 2006) as well as viscometric analysis (Ellis, et al., 2008). Among these methods, FTIR spectroscopy is one of the only methods that have the potential to provide real time qualitative and quantitative biodiesel process information without extensive sample preparation.
Mid-FTIR spectroscopy has seen extensive development and application in relation to the qualitative “condition monitoring” of lubricants, a procedure which has evolved into an ASTM practice (ASTM E2412-04). It has also been developed extensively as a quantitative analytical tool for assessing edible oil quality parameters (van de Voort, et al.,1996; Ma Ket al., 1997) as well as determining the acidity and moisture content in lubricants and fuels (Al-Alawi, et al.,2005, 2006). These FTIR methods tend to be based on simple Beer’s Law relationships without having to resort to more advanced and less intuitive chemometric procedures such as partial least squares (PLS) regression. On the other hand, PLS is a form of factor analysis that allows one to differentiate between correlating and non-correlating spectral regions guided by the results obtained using a primary analytical method; this chemometric technique is particularly effective when there are overlapping absorptions in the region of interest (Ismail, et al., 1997). Both mid-IR and near-IR have been used for monitoring the transesterification reaction. By using a fiber optic probe, Knothe (1999) quantified methyl esters based on their differences of NIR spectra to TGs at 6005 cm−1 and 4428 cm-1, where methyl esters develop a clear-cut band on a shoulder band of TGs. In mid-IR, the conversion of TGs to FAMEs involves the loss of the OCH2 groups in glycerol moiety, resulting in a decrease in peak height at 1378 cm−1, which was analyzed with FTIR-ATR (attenuated total reflectance) during biodiesel processing (Dubé, et al., 2004) and the results were correlated to Gel Permeation Chromatography data. Siatis used a PLS algorithm in the 1300-1060 cm-1 spectral region to determine the FAME in the TG/FAME mixture (Siatis, et al., 2006).
The limitation associated with the established chromatographic methods as well as the IR methods is that they all provide compositional information only well after the fact rather than in real time. It would be useful to have a means of monitoring the biodiesel transesterification process in real time as well as obtaining key final compositional data. FTIR spectroscopy has the potential to provide a direct, rapid and non-destructive means to do this and if attained would provide a useful means by which to study and optimize the transesterification process. This paper presents the design aspects, development and assesses the performance of a mid-FTIR system capable of real time, on-line monitoring of the biodiesel process and its end product quality.
Materials and Procedures
Materials
The biodiesel feedstock used on this study consisted of Canola oil (Brenntag, Rexdale, ON, Canada) and rendered animal fats (Rothsay Inc., Ste. Catherine, QC, Canada). Reagent grade methanol, ACS grade sodium hydroxide (NaOH) and concentrated sulfuric acid (98%) were obtained from Fisher Scientific, Canada. Mono-, di- and triglyceride standards were obtained from Sigma-Aldrich, Bellefonte, PA, USA and methyl ester standards were purchased from Nu-Chek Prep (Elysian, MN, USA).
FTIR Instrumentation and Software
The instrument used in this study was a modified Continuous Fuel Dilution Analyzer (CFDA) , a custom engineered FTIR system manufactured by Thermal-Lube Inc. Montreal, Canada (Figure 1). This system was originally designed for real time analysis of crankcase oil fuel dilution caused by biodiesel formulations in test-bed engines (van de Voort and Pinchuk, 2012).
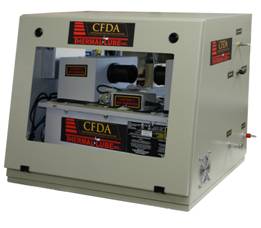
Figure 1. The Continuous Fuel Dilution Analyzer (CFDA) Used for Real-Time Monitoring of Triglyceride Transesterification
The CFDA system is composed of an ABB-Bomem FTPA2000 FTIR spectrometer equipped with a 45 mm temperature controlled CaF2 transmission cell mounted on a movable stage which is controlled and driven by UMPIRE IA (Universal Method Platform for Infra Red Evaluation Interval Analysis) software. This software allows the control of cell temperature, cell stage movement, carries out spectral data processing and presents graphical outputs of the measured spectral changes occurring over time. All spectra were collected at a resolution of 4 cm−1 by co-addition of 8 scans ratioed against an open-beam air background. The cell was linked via a recirculation loop and a micro-pump was used to transport the sample continuously from the reaction vessel through the cell and back. Figure 2a and 2b present an image of the movable stage/cell and an overall flow schematic diagram of the system as plumbed, respectively. The transmission cell was equipped with a solenoid equipped bypass line to limit the flow of the sample through the cell to the times spectra were being collected. The unique aspect of the spectrometer is its movable stage-mounted cell, which is computer controlled, moving in and out of the IR beam so as to collect a single beam background spectrum when out of the beam and a single beam sample spectrum when in the IR beam. By ratioing these two spectra, one produces a conventional absorbance spectrum which is always generated using a fresh background avoiding spectral drift that would be incurred using a conventional fixed cell. This operation is programmable in terms of timing and can take new backgrounds and process spectra up to a maximum of every minute.
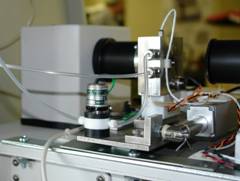
Figure 2. (A) View of the Movable Stage with Temperature Controlled Transmission Cell of the CFDA System Which Can Be Programmed to Move in and out of the IR Beam and (B) Schematic Diagram of the Plumbing and Sample Flow through the CFDA System Directed into the Cell by a Solenoid Valve Which is Normally Closed Unless Activated
Biodiesel Production and Monitoring
Canola oil or tallow was mixed with methanol in a molar ratio ranging from 1:6 to 1:12 in a temperature controlled and stirrer equipped reaction vessel with a condenser attached to avoid methanol loss. The reaction mixture was continuously stirred and maintained at 65 ±2 °C. A positive displacement micropump transported the sample through the tubing loop system and transmission cell by-pass at a constant flow rate of 1-2 ml/min (Figure 2). For Canola feedstock, which contained no appreciable FFAs, 0.2-1.0 ml 50% aqueous NaOH was added to the oil/methanol mixture. For tallow feedstock, which was high in FFA(~5%), it was first reacted with methanol in the presence of 0.3ml sulfuric acid to transform the FFA into FAMEs and then followed by the conventional base catalysis. FTIR process monitoring was always started prior to reagent addition to obtain a baseline, with sample spectra collected every minute thereafter. Each transesterification run was monitored for about 90 minutes. Canola, methyl ester, methanol and glycerol contents were monitored by GC and these data were used to develop PLS calibrations facilitating the quantitation of these components from measurements in specified spectral regions which correlated with the changes.
Results and Discussion
Biodiesel production by transesterification of triacylglycerols should proceed quickly if the feedstock is low in moisture and FFAs, but can be problematic if these optimal conditions are not met. Canola oil, as a liquid at room temperature,represents a fairly ideal feedstock, for biodiesel production, while tallow can be more problematic as it can crystalize, tends to contain more moisture and FFA. On line, analysis is facilitated by the unique movable stage which houses the transmission cell as this facilitates taking fresh backgrounds between samples so that water vapor and instrumental drift are continually ratioed out, providing high quality spectral data. The temperature controlled cell provides a stable temperature for spectral measurements and can be set to match that of the process (65ºC). Mid-FTIR spectroscopy provides access to most of the key functional groups which are affected by reaction, such as the loss and the formation of ester linkages, production and loss of -OH, etc. As the TGs are converted to methyl esters, these functional groups undergo marked changes and can be used to monitor the process. The challenge is to balance and optimize the pathlength to provide access to these signals on scale (short path lengths) yet have sufficient path length to allow the product to readily flow and present the instrument with a representative sample. This balance requires a path length of ~ 50 μm, which allows one to collect the information about both reactants and products from the transesterification process and a rapid and convenient means by which to monitor process on-line and determinate the endpoint of the reaction.
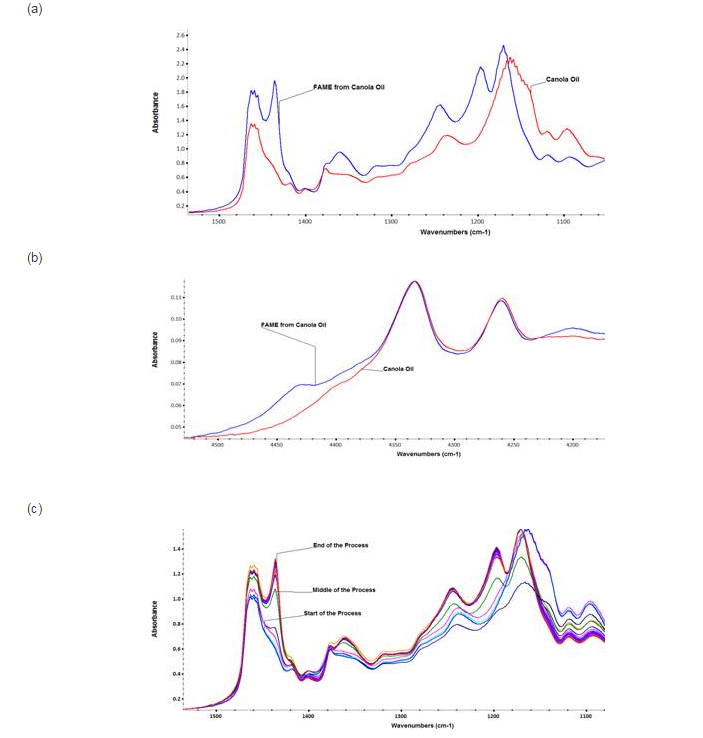
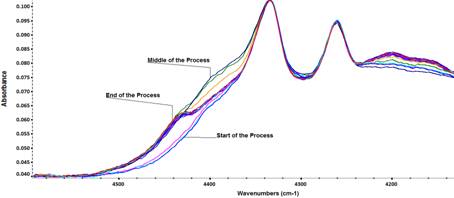
The FTIR spectra of TG and FAME in the mid-IR and near-IR regions are presented in Figure 3a and 3b which illustrate the spectra of Canola oil and its corresponding methyl esters in these regions respectively. FAMEs have several characteristic peaks in the mid-IR at 1198cm-1, 1363 cm-1, and 1436 cm-1, and as the FAME content increases, these peaks increase correspondingly. The peak at 1198 cm-1 is assigned to O-CH3 methyl group stretch while the peak around 1436 cm-1 is considered to be due to -CH3 asymmetric bending vibrations (Siatis et al., 2006). The band at 1377 cm-1 is attributed to the O-CH2 and its absorbance decreases with the increase of FAME formation (Dubé, et al., 2004). In NIR region, FAMEs and Canola oil TGs have similar infrared spectra except at 4430 cm-1, where FAMEs have a peak, but Canola oil TG only display a shoulder (Knothe, 1999). By monitoring these bands as the reaction proceeds, Canola oil transesterification process can be monitored.
In our work, sample spectra were collected every minute with a 45 µm transmission cell and processed by UMPIRE IA software using a reaction temperature at 65°C. After collecting a few baseline spectra without any reaction ongoing, the NaOH catalyst was added into the oil-methanol mixture to initiate the transesterification reaction. The spectra were collected directly without the separation of reactant and product components, which are taken from the upper layer of the reaction vessel, the glycerol accumulating at the bottom due to the moderate rate of stirring used. The monitoring concluded only when all bands being measured plateaued. Figure 3c and 3d show the infrared spectra for the 1100-1500 cm-1 region and 4200-4500 cm-1 region respectively during the Canola transesterification process.

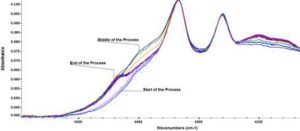
Figure 3. Comparison of Spectra of Canola Oil and its Corresponding Fames Collected in A) Mid-IR Region; B) NIR Region; C) Mid-IR and D) NIR Monitoring of Canola Oil Undergoing Conversion to Fames (Blue Spectrum Represents the Start of the Process; Red Spectrum Represents the End of the Process; Other Color Spectra Represent the Middle of the Process Taken from the Start to the End with 4-Minute Time Intervals)
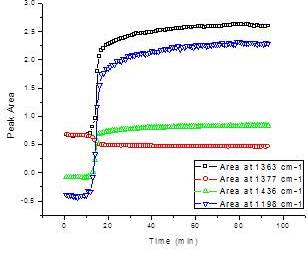
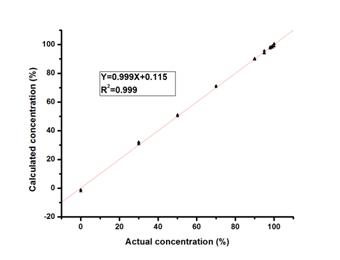
The transesterification process of TGs to their corresponding FAMEs can be monitored as a function of reaction time by measuring the key functional groups noted earlier. Figure 4 demonstrates several reaction curves of a Canola oil undergoing transesterification by monitoring the transmission IR spectra at 1363 cm-1, 1377 cm-1, 1436 cm-1 and 1198 cm-1 as a function of time. All these plots (peak areas) are sigmoidal with the bands at 1198 cm-1, 1363 cm-1 and 1436 cm-1 all increasing as FAMEs are produced, with the band at 1377 cm-1 decreasing. These dynamic reaction curves reveal that the methyl transesterification reaction is rapid and steep after the addition of the base catalyst, with most of the Canola oil converted into FAMEs. The reaction then slows down and attains a plateau where the excess methanol gradually drives the reaction to the endpoint and it reaches equilibrium. These reaction curves can be utilized to monitor the reaction course and judge the endpoint of the transesterification process. The peak at 1198 cm-1 provided the strongest signal change with a large increase after the addition of base catalyst. Among these peaks, only the O-CH3band at 1198 cm-1 has a direct linear response to the Beer-Lambert Law, with methanol and glycerol showing little change while the TGs display a shoulder. A linear calibration for FAME using variable amounts of methanol was developed and validated with standard samples using the 1198 cm-1 band (Figure 5). At all the other bands, methanol and glycerol interfere with the quantitative analysis of FAMEs.

Figure 4. Time-Course Reaction Curves of Canola Oil Transesterification Using Four Mid-IR Peaks
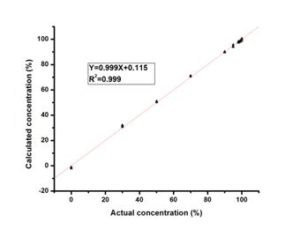
Figure 5. Plot of Calculated vs. Actual FAME Concentration in Percentage (w/w) Using Beer’s Law to Quantify the Degree of Biodiesel Conversion
With the aid of on-line monitoring the variables impacting Canola oil transesterification reaction, such as the ratio of Canola oil to methanol and amount of catalyst added were investigated. Methanol concentration was changed from 20% to 35% (w/w) relative to the weight of Canola oil (60g) respectively, with a constant amount of catalyst (0.6 ml of 50% NaOH). Their corresponding reaction curves measured at 1436 cm-1 are illustrated in Figure 6, demonstrating that more methanol results in a higher plateau in the reaction curve, indicating that increased methanol improved the biodiesel yield. However, this increase tapered off rapidly at concentrations beyond 30%.
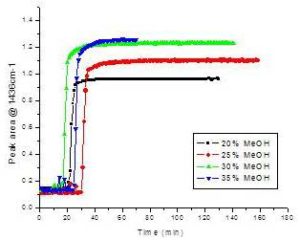
Figure 6. Reaction Curves of Canola Transesterification Tracked at 1436 cm-1 Using Various Methanol Concentrations Added to 60g of Canola Oil at 65ºC.
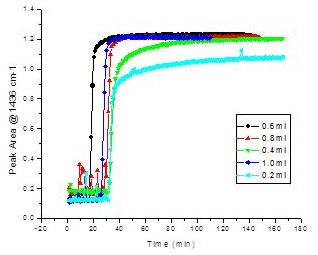
The amount of catalyst used in the transesterification process does not affect biodiesel yield per se but impacts the time of the reaction to reach its endpoint equilibrium. Even though the transesterification reactions under these conditions were generally fast, 0.6 ml or more of catalyst in the system resulted in sharper rises and less of an asymptotic trend to reach the equilibrium endpoint (Figure 7).

Figure 7. Reaction Curves of Canola Transesterification Tracked at 1436 cm-1 Using Various Amounts of Catalyst (50% NaOH) Added to 60g of Canola Oil Using 18g of Methanol Reacted at 65ºC
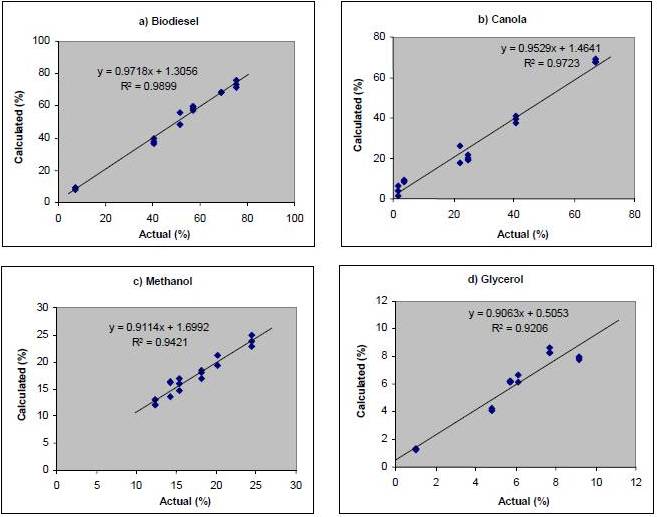
A partial least square (PLS) calibration model was developed using TQ Analyst (Thermo Electron Corp.) for quantification of FAMEs, methanol, glycerol and Canola oil using 1060-1135 cm-1, 1180-1455 cm-1, 3100-3700 cm-1 mid-IR regions and the 4220-4500 cm-1 NIR region. All calibrations used 3 factors for each component, except for glycerol which required 5 factors. The plots obtained for the FTIR predictions vs. the actual GC results for each are shown in Figure 8.
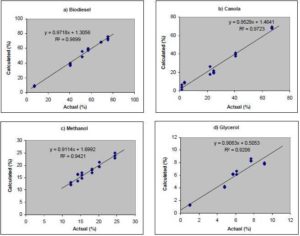
Figure 8. Plots of Calculated vs. Actual Concentrations in Percentage (w/w) Determined Using the PLS Method for Quantitating a) Biodiesel, b) Canola oil; c) Methanol; and d) Glycerol
These calibrations allow one to roughly quantify the amounts of biodiesel FAMEs, canola oil, methanol and glycerol present from the absorbance values as the process progresses over time. Given that methanol has a limited miscibility in canola oil and glycerol is not miscible with biodiesel during the reaction, these numbers are rough approximations, but still useful. It should be noted that the quantification based on this FTIR method cannot distinguish the intermediate residues of mono- and di-glycerides from FAMEs in the process. Nevertheless, these calibrations are good enough for the purposes of monitoring the course of the biodiesel process and making the judgment of the endpoint of the transesterification reaction. Furthermore, GC analysis of the final biodiesel produced confirmed the reaction endpoint as determined by FTIR analysis. Under optimized conditions the plateau in the reaction curve represents the conversion of >98% of the Canola oil to its FAMEs, with no mono- and/and di-glycerides detected by GC analysis at the reaction endpoint indicating that the reaction curves obtained by FTIR analysis can be applied to the biodiesel production monitoring and reaction endpoint determination with confidence. Recent work by Natalello et al (2013) using single-bounce attenuated total reflectance (ATR) spectroscopy using 2nd derivative spectra, indicates that the 1435 cm-1 band is an excellent predictor of FAMEs and that substrate hydrolysis can be tracked well at 1709 cm-1. Although not used in this study, using 2nd derivative spectra may provide a means of further improving the quantitation and tracking of the reaction.
Canola and other oils are relatively ideal substrates for biodiesel production being liquid at room temperature and not prone to crystallization while in the transit lines to the IR cell, which is temperature controlled. Similar results were obtained for less ideal feed stocks such as animal fats, where we did encounter some fat crystallization and clogging of the cell over time during some of our runs, using our original configuration, where only the IR cell was heated, but not the lines. For animal fat process analysis, heat tape has to be incorporated to keep the lines at ~40 oC, thus preventing any cell clogging due to crystal formation.
Conclusion
It has been demonstrated that the Continuous Fuel Dilution Analyzer (CFDA) FTIR originally developed by Thermal-Lube for on-line crankcase oil fuel dilution monitoring can be adapted to assess transesterification of lipids to produce biodiesel. It is the unique configuration of the instrument with its heated cell mounted on a motorized, computer controlled stage, that provides a means of continuously taking fresh backgrounds as the process proceeds and ensuesquality spectra to be collected. The system is capable of providing accurate spectral data representative of the changes taking place as the transesterification process proceeds, and thus aids determining the reaction progress and helps in its optimization. Given the variable nature of the feed stocks used in biodiesel production processes, such real-time information provides assurance that the process is complete and the reactor is ready for another run.
Acknowledgements
The authors would like to thank the Natural Sciences and Engineering Research Council (NSERC) of Canada for the financial support of this research. Also thanks to Rothsay Inc. for providing biodiesel feedstock for this work.
References
Al-Alawi, A., van de Voort, F. R. & Sedman, J. (2005). “A New Fourier Transform Infrared Method for the Determination of Moisture in Edible Oils,” Applied Spectroscopy, 59(10) 1295-1299.
Publisher – Google Scholar
Al-Alawi, A., Van De Voort, F. R. & Sedman, J. (2006). “Automated FTIR Analysis of Free Fatty Acids or Moisture in Edible Oils,” Journal of the Association for Laboratory Automation, (11) 23-29.
Publisher – Google Scholar
“Algae Fuel,” [Online], Article, Wikipedia, [Retrieve October 20, 2012],http://en.wikipedia.org/wiki/Algae_fuel
Publisher
Arzamendi, G., Argui-arena, E., Campo, I. & Gandía, L. M. (2006). “Monitoring of Biodiesel Production: Simultaneous Analysis of the Transesterification Products Using Size-Exclusion Chromatography,” Chemical Engineering Journal,122(1) 31-40.
Publisher – Google Scholar
Bajpai, D. & Tyagi, V. K. (2006). “Biodiesel: Source, Production, Composition, Properties and Its Benefits,” Journal of Oleo Science, 55 487-502.
Publisher – Google Scholar
Bondioli, P. (2004). “The Preparation of Fatty Acid Esters by Means of Catalytic Reactions,” Topics in Catalysis, 27(1) 77-82.
Publisher – Google Scholar
Chesti, G. F., de Macedo, J. L., Braga, V. S., de Souza, A. T. C. P., Parente, V. C. I., Figueredo, E. S., Resck, I. S., Dias, J. A. & Dias, S. C. L. (2006). “Application of Raman Spectroscopy to Monitor and Quantify Ethyl Esters in Soybean Oil Transesterification,” Journal of the American Oil Chemists’ Society, 83 597-601.
Publisher – Google Scholar
Dubé, M., Zheng, S., Mclean, D. D. & Kates, M. (2004). “A Comparison of Attenuated Total Reflectance-FTIR Spectroscopy and GPC for Monitoring Biodiesel Production,” Journal of the American Oil Chemists’ Society, 81(6) 599-603.
Publisher – Google Scholar
Ellis, N., Guan, F., Chen, T. & Poon, C. (2008). “Monitoring Biodiesel Production (Transesterification) Using in-Situ Viscometer,” Chemical Engineering Journal, 138 (1-3) 200-206.
Publisher – Google Scholar
Gelbard, G., Brès, O., Vargas, R. M., Vielfaure, F. & Schuchardt, U. F. (1995). “1 H Nuclear Magnetic Resonance Determination of the Yield of the Transesterification of Rapeseed Oil with Methanol,” Journal of the American Oil Chemists’ Society, 72 1239-1241.
Publisher – Google Scholar
Gerpen, J. V. (2005). “Biodiesel Processing and Production,” Fuel Processing Technology, 86 (10) 1097-1107.
Publisher – Google Scholar
Holcapek, M.,. Jandera, P., Fischer, J. & Prokes, J. (1999). “Analytical Monitoring of the Production of Biodiesel by High-Performance Liquid Chromatography with Various Detection Methods,” Journal of Chromatography A, 858(1) 13-31.
Publisher – Google Scholar
Ismail, A. A., Van De Voort, F. R. & Sedman, J. (1997). Chapter 4 – ‘Fourier Transform Infrared Spectroscopy: Principles and Applications,’ in Pare, J. R. J. and Belanger, J. M. R. (Eds), Instrumental Methods in Food Analysis, Elsevier Science B.V., Amsterdam, the Netherlands. Pp 93-139.
Google Scholar
Knothe, G. (1999). “Rapid Monitoring of Transesterification and Assessing Biodiesel Fuel Quality by Near-Infrared Spectroscopy Using a Fiber-Optic Probe,” Journal of the American Oil Chemists’ Society, 76(7) 795-800.
Publisher – Google Scholar
Knothe, G. (2005). “Dependence of Biodiesel Fuel Properties on the Structure of Fatty Acid Alkyl Esters,” Fuel Processing Technology, 86 (10) 1059-1070.
Publisher – Google Scholar
Knothe, G. (2006). “Analyzing Biodiesel: Standards and Other Methods,” Journal of the American Oil Chemists’ Society,83 (10) 823-833.
Publisher – Google Scholar
Komers, K., Stloukal, R., Machek, J. & Skopal, F. (2001). “Biodiesel from Rapeseed Oil, Methanol and KOH. 3. Analysis of Composition of Actual Reaction Mixture,” European Journal of Lipid Science and Technology, 103 (6) 363-371.
Publisher – Google Scholar
Ma, K., Van De Voort, F. R., Sedman, J. & Ismail, A. A. (1997). “Stoichiometric Determination of Hydroperoxides in Fats and Oils by Fourier Transform Infrared Spectroscopy,” Journal of the American Oil Chemists’ Society, 74 (8) 897-906.
Publisher – Google Scholar
Meher, L. C., Vidya Sagar, D. & Naik, S. N. (2006). “Technical Aspects of Biodiesel Production by Transesterification–A Review,” Renewable and Sustainable Energy Reviews, 10 (3) 248-268.
Publisher – Google Scholar
Natalello, A., Sasso, N., & Secundo, S. (2013). “Enzymatic Transesterification Monitored by an Easy-to-Use Fourier Transform Infrared Spectroscopy Method,” Biotechnology Journal.
Publisher – Google Scholar
Siatis, N. G., Kimbaris, A. C., Pappas, C. S., Tarantilis, P. A. & Polissiou, M. G. (2006). “Improvement of Biodiesel Production Based on the Application of Ultrasound: Monitoring of the Procedure by FTIR Spectroscopy,” Journal of the American Oil Chemists’ Society, 83 53-57.
Publisher – Google Scholar
Trevisan, M. G., Garcia, C. M., Schuchardt, U. & Poppi, R. J. (2008). “Evolving Factor Analysis-Based Method for Correcting Monitoring Delay in Different Batch Runs for Use with PLS: On-Line Monitoring of a Transesterification Reaction by ATR-FTIR,” Talanta, 74 971—976.
Publisher – Google Scholar
Türkan, A. & Kalay, S. (2006). “Monitoring Lipase-Catalyzed Methanolysis of Sunflower Oil by Reversed-Phase High-Performance Liquid Chromatography: Elucidation of the Mechanisms of Lipases,” Journal of Chromatography A, 1127(1-2) 34-44.
Publisher – Google Scholar
U. S. Environmental Protection Agency (2002). “A Comprehensive Analysis of Biodiesel Impacts on Exhaust Emissions,” [Online], [Retrieved March 20, 2012], http://www.epa.gov/otaq/models/analysis/biodsl/p02001.pdf
Publisher
van de Voort, F. R., Sedman, J. & Ismail, A. A. (1996). “Edible Oil Analysis by FTIR Spectroscopy,” Laboratory Robotics and Automation, (8) 205-212.
Publisher – Google Scholar
van de Voort, F. R., & Pinchuk, D. “In-Line, Continuous Monitoring of Fuel Dilution in Motor Oils by Fourier Transform Infrared (FTIR) Spectroscopy,” [Online], [Retrieved March 20, 2012], http://www.thermal-lube.com/Publications/In%20Line%20Fuel%20Dilution%20-%20Lube%20Ex.pdf
Publisher
Zagonel, G. F., Peralta-Zamora, P. & Ramos, L. P. (2004). “Multivariate Monitoring of Soybean Oil Ethanolysis by FTIR,”Talanta, 63 (4) 1021-1025.
Publisher – Google Scholar