Introduction
An ongoing concern for agriculture is the impact of land-applied manure from livestock production on sustainable production and the environment. Confined feeding systems concentrate nutrients from manure into a relatively small geographic area. The long-term application of these nutrients to limited land areas creates the potential for nutrients to move off-site into water supplies. Non-point source pollution continues to be a major source of nutrients in water, causing eutrophication of water bodies and reduced water quality (Carpenter et al 1998), and a potential source for pathogens (Duchemin and Hogue 2009). The movement of nutrients or pathogens into water supplies imposes external costs on the environment and on society.
Alternative uses for beef cattle (Bos taurus) manure have been explored, including the production of biogas through anaerobic digestion. Biogas production could yield about 30 m3 of methane t”‘1 of beef manure to produce 51 kWh of electricity and 230 MJ of heat. While anaerobic digestion provides energy and heat, digestion will not alter the total nitrogen (N) and phosphorus (P) in the manure. The concentration and form are altered, and could provide alternatives for land application, or selling solids into a commercial market. The province of Alberta, Canada has a high potential for biogas production from manure because of the livestock industry (AARD 2011). There is currently one biogas facility associated with a beef cattle feedlot and at least one being developed that will utilize slurry manures and organic wastes. The biodigesters also utilize other products to obtain an optimal balance of nutrients for anaerobic digestion.
The application of livestock nutrients to land, either manure or the digestate from anaerobic digestion, is to be applied at a rate based on plant nutrient requirements, either N or P. In Alberta, manure is to be applied based on N. Guidelines and standards have been developed to prevent the accumulation of excess nutrients that could move to water bodies. Nutrient application can impact nutrient runoff, depending on nutrient source and the time between application and rainfall (Eghball et al 2002; Smith et al 2007). Surface applied nutrients and soils high in nutrients have more potential for loss (Sharpley et al 1994). Traditionally, most livestock producers and nutrient management plans targeted N (Iowa State University 1997). The N-based rates resulted in an accumulation of P in soil over time, because the ratio of N to P from manure was less than plant requirements. If inorganic P fertilizer is applied above the manure standard, the standard will have little impact on P runoff (Schnitkey and Miranda 1993). Some jurisdictions have implemented guidelines or standards based on soil available P (Daniels et al 2005; MAFRI 2012), because of very high soil P levels.
Environmental benefits from nutrient based manure application can impose added costs onto livestock producers. A survey of large dairy and hog farms (2000 and 1998, respectively) in the United States determined about 20% met N, and less than 5% met P nutrient standards for soils (Ribaudo et al 2003). Complying with the N and P standards can be expected to increased costs to livestock producers, or they would already comply with the standard. To meet the standards, manure or manure products, will need to be transported further and application time and cost will increase (Schnikey and Miranda 1993; Smith et al 2006). Schnitkey and Miranda (1993) and Beckman and Livingston (2012) found no impact on the net return for crop producers from imposing nutrient standards.
A study near Lethbridge, Alberta found lower P fractions (mainly dissolved) in runoff for annual P- or triennial P-based applications compared to annual N-based applications over three years (Miller et al 2011). There was no net environmental benefit of annual P-based over triennial P-based application over the three years of the study; however, P runoff was higher in the first year of the triennial P-based application. With the imposition of costly nutrient standards, some of the added cost will be off-set by less fertilizer purchases. To compensate producers who adopt more costly nutrient management plans to comply with standards, cost share programs have been implemented to lower the net cost to the producer (Ribaudo et al 2004; Dupont 2010; Grand River Conservation Authority 2010; USDA 2011).
Most jurisdictions have standards with regards to citing livestock feeding facilities. The U.S. Environmental Protection Agency (EPA) (2012) has standards for confined animal feeding operations, and individual states have developed their own standards within the EPA framework. The Province of Alberta (2007) introduced standards to reduce the environmental impact of animal manure. In addition to the actual site, the characteristics of manure are used to determine the land base requirements of the facility (AAFRD 2006). A new facility must have adequate land base to spread the livestock manure at a rate based on N.
The impact of transforming beef feedlot manure through anaerobic digestion, and either N- or P-based standards on field application has not been previously analyzed. The purpose of this study was to evaluate the economics of beef cattle manure application when a biogas facility is integrated with a feedlot. The evaluation considered N and P from manure and for plant requirements. The boundaries for the study included the manure and digestate, application of the manure product to land used for annual crop production, and crop production. The profitability of livestock feeding and biogas production were outside the boundaries of this study, as were animal diets that could alter the nutrient composition of manure. The specific objectives of this study were: (1) to determine the cost of manure application when manure is transformed by a biogas facility, for a medium sized feedlot in southern Alberta, and (2) to determine the impact of changes to manure and digestate application standards on the cost of manure management. An annual N-based standard was compared with an unconstrained annual application, an annual P-based standard to meet plant P requirements, and a triennial P-based standard of three times the annual plant P requirement but applied triennially. The analysis included a spatial land distribution for manure application, which directly affects manure hauling cost. Fertilizer N and P prices were included as they can impact the distribution of livestock manure. The price of separated solids could impact the profitability of digesting manure.
Economic Model
The model developed for this analysis used the premise that the nutrients from manure must be applied to land, either as raw manure or as the products of anaerobic digestion. The separated solids from digestion could be sold. Determining the optimal quantity and form of manure, location of nutrient application was determined by the economic model. This approach contrasted to that of estimating the demand that land owners have for manure (Feinerman et al 2004).
The economic unit considered in this study was a beef feedlot with an anaerobic digester, and a land base near the feeding facility on which to grow crops and to apply livestock manure. Crops produced could be utilized in the feeding operation or marketed, and were valued at a market value. Land of a given type was assumed to be homogeneous so that the crop yield response to nutrients and the ability to accept manure was the same across the given land type. A moderate sized feedlot was specified and the biogas facility was scaled to the feedlot. The land area in the model was in proportion to the scale of the feeding facility. The costs and returns from feeding livestock were exogenous and did not influence crop production or manure management. Producers were price takers. Manure was applied annually to land once crops were harvested. The exception would be liquids from digestion that were in a holding lagoon and would be applied to crops by irrigation during the growing season. Separated solids from digested manure could be sold throughout the year. Piling of manure in pens (beef feedlot), near the digester (anaerobic digestion), and lagoon storage (anaerobic digestion) could occur. For this analysis, storage related costs were not considered to be part of the manure handling system.
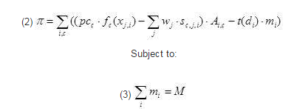
If manure supply and application were unconstrained, a producer growing crops will apply either inorganic fertilizer and/or manure products to fertilize crops such as to maximize crop production profits, π. The available nutrients from manure products and fertilizer were considered to be perfect substitutes. The profit function for a unit of land was:

Where pcc was the price of the crop, fc(x) was a yield function for a crop with fx > 0 and fxx < 0, x was the input nutrient (for example, N), w was the cost of inorganic nutrient s, t was the cost of applying manure products and depended on transport distance d, and m was the quantity of manure product. The total amount of input nutrient, x, was the sum of soil available, plus s, plus nutrients from m. If inorganic nutrients were applied, s>0 and m=0, the optimization was where the marginal value product of the nutrient equaled the cost. If manure products were applied, s=0 and m>0, the nutrient was applied to where the marginal value product of the nutrient within the manure product equaled the cost of transporting and applying the nutrient. For manure products, because the cost increases with distance hauled, the further the hauling distance (higher cost), the lower the optimal application rate. Different forms of manure products had different costs. For crop production, N was the most limiting nutrient when applying manure.
Manure can be a valuable source of plant nutrients, but the more plausible case for the livestock operation was that manure was a burden that needed to be disposed of in an acceptable manner (Norwood and Chvosta 2005). A livestock operation with or without a digester, and with a land base for crop production will allocate manure products to the land to optimize crop production and minimize the total cost of manure application. A discreet profit function across i fields of area Ai and j nutrients was specified as:
Where M is total manure supply from the feeding operation and the remaining variables were as previously defined. The optimization conditions for the unconstrained manure problem were, in general, not the same as the application of inorganic fertilizer. The manure constraint and geographic field location impacted the optimal rate of total N. The optimization condition when manure was applied to a field i for crop c was:
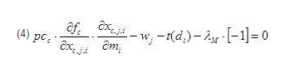
Where λM was the Lagrange multiplier for the manure constraint and the measure of the value of additional manure. If the nutrient source was inorganic, then t(di) and λM equaled zero, or if the nutrient source was manure then the supply of xfrom inorganic = 0, and wj = 0. Because transport cost increased with distance, the manure application rate declined, as distance from the feeding facility increased (Innes 2000). Additional livestock manure could be a net cost (λM < 0), the actual value depended on the value of the nutrient in crop production, manure product availability, and transport cost. Even though manure application rates can be high, it was unlikely the marginal value product of nitrogen from manure was negative.
Manure Application Standards
Manure application standards specified maximum rates with the objective of preventing off-site environmental impacts. Enforcement and monitoring were beyond the scope of this analysis. If the unconstrained optimum manure product application was m*, a standard required a lower rate, < m*. The rate was based on crop N or P requirements, and could be modified for soil texture, rainfall, proximity to water, or other environmental factors. With standards, manure application rates were lowered on at least some fields. As a result, some livestock manure products were transported further, increasing total transport cost. There was less inorganic fertilizer purchased for land that now received manure. The standards alter the optimization condition of equation 4 when manure was the source of nutrients:
Where the variables were as defined for equation 4, aj was a manure conversion factor for nutrient j, and λji was the Lagrange multiplier for the jth nutrient constraining the maximum rate of manure application to field i.
Empirical Model
A model of crop production and manure application from a beef feedlot was specified with the objective to maximize the net return from crop production less the cost of manure application. The feedlot had a biodigester that could be used to anaerobically digest manure and produce methane to generate electricity. The model was farm-based to facilitate consideration of the land geography relative to the feedlot location. Regional models (Kaplan et al 2004; Carreira et al 2007) have a similar structure but are unable to model manure application to individual parcels of land. The model balanced nutrients N and P, and livestock manure products so that all manure nutrients were applied to land. There were model constraints on land and crop area, and livestock nutrients applied when there were standards.
Where:
AREA = area of cropped land (ha)
AN = applied nitrogen (kg ha”‘1)
ANIM = livestock capacity (head)
APC = field application cost of manure ($ Mg”‘1)
BAN=upper bound of AN when manure is applied and N-limit (kg ha”‘1)
BCF = purchased fertilizer (Mg)
CM = manure for biodigestion (Mg)
CMBIOD = conversion factor of manure to digestate
CMBIOS = conversion of digestate to separated solids
CMBIOL = conversion of digestate to separated liquids
CMAX = maximum crop area (proportion)
DIST = distance from field to farmstead (km)
FC = crop production costs other than fertilizer ($ ha”‘1)
FCT = fertilizer cost ($Mg”‘1)
FNUTC = nutrients in purchased fertilizer (kg Mg”‘1)
HC = hauling costs of crop from field to farmstead ($ Mg-km”‘1)
HLC = hauling cost of manure ($ Mg-km”‘1)
LDC = loading cost of manure ($ Mg”‘1)
MD = nutrients in manure, total available over three years (kg Mg”‘1)
MDT = yearly available nutrients from manure for each of three years (kg Mg”‘1)
MLSTK = manure production from livestock (Mg head”‘1)
PBIOS = price of separated solids ($ Mg”‘1)
PC = price of the crop ($Mg”‘1)
P2O5 = phosphate nutrients (kg)
RESIDN = residual soil nitrogen (kg ha”‘1)
SBIOS = sale of separated solids (Mg)
T = manure transported (Mg)
TCA = total crop area (ha)
YLD = crop yield (Mg)
bn, abn = land area block, or field (64.8 ha)
c = crop (hard red spring wheat (Triticum aestivum), feed barley (Hordeum vulgare L.), barley silage, canola (Brassica napus)).
fs = fertilizer source (inorganic, manure, digestate products)
ft = inorganic fertilizer type (urea, monoammonium phosphate)
lc = land class (dryland, irrigated)
lm = manure product type (manure, digestate, separated solids (‘bios’), liquids (‘biol’))
maf = frequency of manure application (E1Y = yearly, E3Y = once every third year)
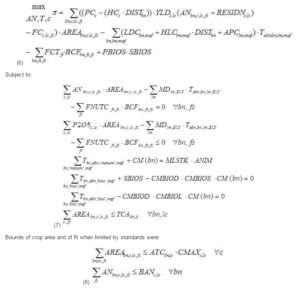
The model selected AN, c and T to maximize net return, π, from crop production and the application of livestock manure products to land (equation 6). The net price for the crop was adjusted by the cost of transporting the crop from the field, which was especially important for silage. Yield was a quadratic function of total available N (applied plus soil). Manure application cost consisted of loading, transporting to the field (depends on distance), and applying in the field (depends on the rate of application). The nutrient constraints (equation 7) balanced crop needs with that supplied from manure products and inorganic fertilizer. All manure products were utilized by applying to fields, or separated solids could be sold. The total crop area was constrained to not exceed that available by bounding the crop area (equation 8) to reflect production in the region of interest. Bounds on AN from manure were used for the N-limiting standard case by crop and land class. The AN bound was specified as the optimal rate of inorganic N using crop and fertilizer prices in the model (Table 1).
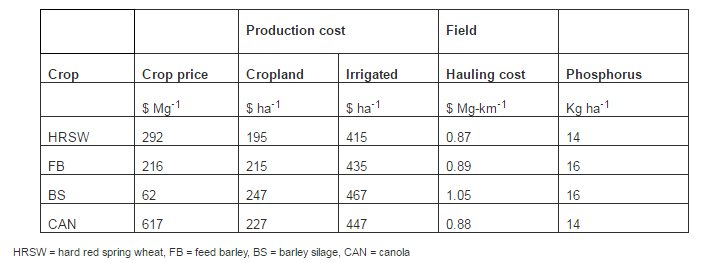
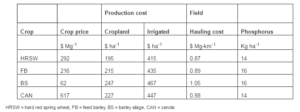
Table 1: Input Prices, Production Costs, Field Hauling Costs and Annual Phosphorus Requirement by Crop
A P-limit at three times the annual crop P requirement but applied triennially, altered the N and P constraints, because both the residual fertility of manure and the geographic distribution of land were explicitly taken into account. The available P for this constraint was based on available P the first year after application. The residual P available in the second and third years after application did not directly impact the P constraint, but was required to account for carryover and less inorganic P was required in years two and three. For the triennial P-based application of manure, the N and P constraints in equation (7) were replaced plus a total P-limit constraint was added. The constraints and optimality conditions were reported in Appendix A.
With a biodigester, the three times annual P applied triennially needed to be modified for the application of the separated liquids. The liquids were applied by an irrigation system fixed on the land (center pivot), and the system would not be moved to other land locations. The land receiving liquid was constrained to annual P application rates because the irrigation system was fixed in place. Separated solids could be applied at three times the annual rate, as was the situation for manure.
Data and Analysis
The model was applied to a beef feedlot in southern Alberta with a feeding capacity of 10,000 head (hd). The feedlot had access to 42 quarter sections (blocks) of land (2720 ha) on which to grow crops and apply livestock manure. The land was assumed to be similar in productivity. The land area was distributed so that some was adjacent to and some was up to 8 km from the feedlot. The land distribution reflected that most feedlots do not have access to a continuous block of land surrounding the feedlot. Manure transport cost was dependent on the distance to the land.
Crops included hard red spring wheat (HRSW), feed barley (FB), barley silage (BS) and canola (CAN). The FB was harvested for grain, and BS had the entire plant harvested and ensiled to be fed to cattle. Each crop yield was a quadratic function of available nitrogen (soil plus applied) derived from nitrogen response equations (AARD 2008). Crop prices were recent average prices and a hauling cost from the field to the yard/feedlot was deducted (Table 1). Optimal rates of N determined from the equations were within 10% of that recommended for southern Alberta (AAFRD 2004). The P requirement for each crop was based on Alberta recommendations (Table 1). Crop production costs were current direct input costs, less N and P costs because fertilizer costs were directly in the model. Nitrogen, in the form of urea, was $620 Mg”‘1, and mono-ammonium phosphate (MAP), 11% nitrogen and 51% phosphate, was $723 Mg”‘1. The feedlot finished larger feeder animals, producing 2.1Mg of manure for each animal unit of feedlot capacity. Manure hauling costs consisted of loading, hauling and field application. Application cost for solid products declined with application rate, because of reduced time in the field to apply the manure product. The field application cost for the P-rate limit was higher, because the lower rate of application required nearly twice the time to apply manure to the field. Solid manure hauling costs were based on custom rates for loaders and trucks, with enough trucks for continuous loading. Liquids separated from the digestate solids were applied by irrigation, the solids were applied the same as raw manure.
The model was solved using the MINOS algorithm available in GAMS (Brooke et al 1992). Crop yield for all crops in the model was quadratic. Initial values were assigned to applied nitrogen, manure transport, and crop area; otherwise the solution appeared at times to be a local optimum. The initial values were modified to determine the solution was robust.
Results and Discussion
The optimal yearly application of livestock manure with no standards was to apply a higher rate of manure to land near the feedlot. The higher manure application rate near the feedlot occurred because the cost to obtain N in the form of manure was less than from inorganic N. Near the feedlot, the cost of N embodied in the manure was about $0.95 kg”‘1, less than the cost of inorganic N ($1.35 kg”‘1). The yield benefit from the higher N rate was low, but total manure transport cost was reduced. Manure was a disposal problem and the least cost method of disposal was to apply a higher rate of manure near the feedlot. Additional manure imposed a net cost of about $1 t”‘1. Despite the lower cost of nearby manure application, it was not profitable to over apply manure to the point where the marginal product of N from manure approached zero. Also, in the absence of digesting manure, it was more profitable to apply manure triennially at three times the annual uptake of P by the crop. Environmentally, the triennial application was found to have similar total P run-off over three years compared to annual P application rate (Miller et al 2010).
The estimated benefit of utilizing the separated solids and liquids from digested manure, rather than raw manure, was generally negative (Figure 1). For the manure handling and cropping component of the farm, there was an additional cost of about $3 hd”‘1 to utilize biodigested manure. Benefits from the digester and feedlot operations (not part of this study) would be required to off-set this higher cost. A feedlot-to-power generation from a biodigester is a complex system and there are other components of the system that could potentially reduce costs. The loss of nitrogen, most likely in the form of ammonia (Hao 2012), reduced returns because a commercial fertilizer was purchased to replace the lost N. Smith et al (2007) reported that over one-half of the N in digestate was in the ammonia form. The loss of ammonia from digested and separated slurries will be higher with high pH.
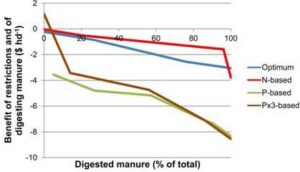
Figure 1: The Net Benefit of Digesting Beef Feedlot Manure without Nutrient Restrictions and With N and P Restrictions
The separated liquids were held in a storage pond and applied during the growing season to crops by an irrigation system. The land area nearest the digester was used for liquids and required an investment in irrigation equipment. The cost of applying liquid was low ($0.05 m”‘3), compared to solid manure products, but the annual fixed cost of the irrigation system was high ($222 ha”‘1). Custom application of the liquid using a drag hose or slurry tanks (about $2.90 for 1000L) would be more costly. Given the low application cost of liquids, the optimal amount of N applied in liquid form was 20% higher than from raw manure. It was profitable to apply high N rates to avoid the cost of expanding the irrigation system. Because of the high liquid N rate, additional inorganic N was purchased for the remaining farm land.
The standard limiting N application had minimal impact when raw manure was applied to land (Figure 1). The reduction in net return was less than reported by Key and Kaplan (2007) for a hog enterprise, but the model in this study included crops while theirs included only the livestock operation. Land within 2 km of the feedlot applied about 5.3% less manure with the N standard. When manure was digested, additional land area to receive the separated liquid was required, along with additional irrigation equipment for the liquid. The net additional cost of digesting all manure and applying as liquid and solid was about $4 hd”‘1 (Figure 1). Some N nutrients in liquid were lost (7.6%) and were replaced by purchasing inorganic N fertilizer. The study did not consider the benefits of methane production for power generation from the digester, or benefits to the livestock system related to pen cleaning and animal health.
Standards for annual P application to match crop requirements increased the cost of applying manure products. A noted exception was for raw manure applied at three times the annual P rate (3xP), but applied triennially (Figure 1). The triennial application of raw manure was less costly ($1.15 hd”‘1) than annual applications. The 3xP rate applied a similar amount of manure as the N-based system. The main benefit of applying manure triennially came from better use of P in the manure. The primary cost saving was that P purchases were less ($1.03 hd”‘1) because the residual P carried over to subsequent years.
For an annual P standard, manure transport costs were higher (34%) because manure products needed to be hauled further (a doubling of t-km) from the feedlot. The lower return from annual P-limit manure contrasted with Fleming et al (1998) who report higher profit for a small hog enterprise. With manure digestion, there was a need to double the irrigation area for liquid application. The nutrient ratio of N to P for the liquid resulted in excess P when applied to meet plant N requirements. The manure solids were hauled further from the feedlot than liquid. With the digestion of manure, there was no longer an advantage to applying three times the P rate triennially. This was because the liquid application could not be rotated among fields due to the fixed irrigation equipment. Liquid application was restricted to an annual P application. The added digestion cost of all manure with the P standard to match crop requirement was about $8 hd”‘1 (Figure 1). This cost was twice that of the N standard.
Income from the sale of solids separated from the digestate was not included in the analyses reported above. Revenue from separated solids could off-set some of the additional costs of using digested manure, plus the purchase of inorganic N and P to replace the solids. For the non-restricted system, a solids price of $3 t”‘1 was adequate to cover the additional costs for utilizing digested manure products. With the N standard, the solids price needed to be $4 t”‘1, with the annual P standard it was $5 t”‘1, and for the three times annual P applied triennially was $7 t”‘1. The market for separated solids from digestate is new and prices could vary widely. Bachewe et al (2008, p.37) quote a potential price for solids based on a peat moss price of $16.50 m”‘3. Pricing separated solids as a substitute for peat moss would give a price of about $23 t”‘1. Pricing separated solids on available N and P would give an estimated value of $7 t”‘1. There could be a high value for separated solids in some markets, such as horticulture or gardening. There was an incentive to market the separated solids.
The cost of inorganic fertilizer impacted the use of livestock manure. At a low price for urea ($450 Mg”‘1) and MAP ($500 Mg”‘1), the manure was digested without any required benefit from the rest of the feeding system. The liquids were applied to land, but the separated solids were ‘sold’ for no revenue. At the low cost of fertilizer, it was less costly to purchase inorganic fertilizer than to apply manure or spread the separated solids. At high urea ($900 Mg”‘1) and MAP ($1250 Mg”‘1) prices, there was a 7.5% decline in net return because of higher fertilizer expenditures and lower crop yield because less fertilizer was applied. At higher fertilizer prices, it was less profitable to use digested manure. The cost of digesting all manure would be about $5.58 hd”‘1. The price effect was almost entirely due to the MAP price. At a high MAP price, it became profitable to apply lower rates of manure to land to fully utilize the P in the manure. The application of manure was similar to that of the annual P standard. Manure had a positive value at high nutrient prices, rather than being a net cost to the system.
Conclusions
In a jurisdiction without standards for manure application, the application of beef cattle manure was about 12% higher near the feedlot than at further distances. The higher rate resulted in N being in excess of plant requirements and leaching of nitrates could result. Excess P will build up in the soil at these rates and could eventually move into water bodies. Standards for N and P can be used to prevent nutrient buildup in the soil. A standard limiting N to crop requirement reduced application rates near the feedlot and increased the average manure hauling and application cost by $0.04 hd”‘1. A standard to apply based an annual P increased manure handling cost by $3.55 hd”‘1, but if manure was applied at three times the annual P rate triennially, then costs were reduced by $1.15 hd”‘1.
When a feedlot has a biodigester and digests manure, there was an added cost to the system. Some of the added costs were due to N losses and other costs were higher capital costs for irrigation equipment to apply liquids. Without standards, the added cost was estimated to be $3.05”‘1, and with an N standard was $3.80 hd”‘1. This higher cost would need to be off-set by the returns to the digester, savings within the feedlot, or sales of manure products such as the separated solids. A P-based standard imposed much higher costs — $8.33 to $8.50 hd”‘1 — primarily because the area required for liquid application tripled to meet the standard. There was no benefit from the three times annual P rate applied triennially. With a P standard, extracting P from the liquid might be required to control the overall costs.
The cost of N and P influenced the rate of N application, the distribution of manure on land, and the cost/benefit of digesting manure. At high fertilizer costs, additional livestock manure has a positive value and is no longer a disposal burden. The net cost of digesting manure was higher ($5.58 hd”‘1). The cost of P had more impact than N. At a high P cost, there is an economic incentive to apply lower rates of manure to obtain the entire value of the P in the manure. Inorganic N supplemented the organic N to meet the crop N requirement. At low fertilizer costs, it was profitable to digest manure and it was less costly to give the separated solids away and buy inorganic fertilizer than to apply the separated solids to land.
When separated solids had a commercial value, it was profitable to digest manure and sell the separated solids. With an N standard, the separated solid price would need to be $3 t”‘1. When there were P standards, the separated solid price would need to be $5 t”‘1 for annual P or $7 t”‘1 for three times annual P applied triennially. A market to sell at least a portion of the separated solids was needed for the digesting of manure to be profitable.
References
Alberta Agriculture and Rural Development (AARD). (2008). “Alberta Farm Fertilizer Information and Recommendation Manager,” [Online], [Retrieved September 24, 2013], http://www1.agric.gov.ab.ca/$department/softdown.nsf/main?openform&type=AFFIRM&page=information#new
Publisher
Alberta Agriculture, Food and Rural Development (AAFRD). (2004). Alberta Fertilizer Guide, Agdex 541-1, Alberta Agriculture, Food and Rural Development, Edmonton Alberta.
Publisher
Alberta Agriculture, Food and Rural Development (AAFRD). (2006). ‘Agricultural Operations Practices Act (AOPA): Manure Characteristics and Land Base Code,’ Agdex 096-8, Alberta Agriculture, Food and Rural Development, Edmonton, Alberta.
Alberta Agriculture, Food and Rural Development (AAFRD). (2011). Biogas Energy Potential in Alberta, Agdex 768-3,Alberta Agriculture, Food and Rural Development, Edmonton, Alberta.
Publisher
Bachewe, F., Lazarus, W., Goodrich, P., Drewitz, M. & Balk, B. (2008). “Review of the Literature on the Economics of Central Anaerobic Digesters,” Staff Paper P08-09. Department of Applied Economics, College of Food, Agricultural and Natural Resource Sciences, University of Minnesota.
Publisher – Google Scholar
Beckman, J. & Livingston, M. (2012). “Effects of Manure Use and Use Restrictions on Variable Production Costs and Net Incomes for United States Corn Producers,” Journal of Agricultural and Applied Economics, 44 (1) 83”‘97.
Publisher – Google Scholar
Brooke, A., Kendrick, D. & Meeraus, A. (1992). ‘GAMS a User’s Guide, Release 2.25,’ The Scientific Press, San Francisco, USA.
Google Scholar
Carpenter, S. R., Caraco, N. E., Correll, D. L., Howarth, R. W., Sharpley, A. N. & Smith, V. H. (1998). “Nonpoint Pollution of Surface Waters with Phosphorus and Nitrogen,” Ecological Applications, 8 (3) 559-568.
Publisher – Google Scholar
Carreira, R. I., Young, K. B., Goodwin, Jr., H. L. & Wailes, E. J. (2007). “How Far Can Poultry Litter Go? A New Technology for Litter Transport,” Journal of Agricultural and Applied Economics, 39 (3) 611”‘623.
Publisher – Google Scholar
Daniels, M., Vandevender, K. & Danielm, T. (2012). ‘Phosphorus-Based Nutrient Management Planning,’ University of Arkansas, Division of Agriculture, Cooperative Extension Service, FSA9516-PD-9-05N, 2005. [Online], [Retrieved October 8, 2012], http://www.uaex.edu/Other_Areas/publications/PDF/FSA-9516.pdf
Duchemin, M. & Hogue, R. (2009). “Reduction in Agricultural Non-Point Source Pollution in the First Year Following Establishment of an Integrated Grass/Tree Filter Strip System in Southern Quebec (Canada),” Agriculture, Ecosystems & Environment, 131 (1) 85”‘97.
Publisher – Google Scholar
Dupont, D. P. (2010). “Cost-Sharing Incentive Programs for Source Water Protection: The Grand River’s Rural Water Quality Program,” Canadian Journal of Agricultural Economics, 58 (4) 481”‘496.
Publisher – Google Scholar
Eghball, B., Gilley, J. E., Baltensperger, D. D. & Blumenthal, J. M. (2002). “Long-Term Manure and Fertilizer Application Effects on Phosphorus and Nitrogen in Runoff,” Transactions of the American Society of Agricultural Engineers, 45 (3) 687-694.
Publisher – Google Scholar
Feinerman, E., Bosch, D. J. & Pease, J. W. (2004). “Manure Applications and Nutrient Standards,” American Journal of Agricultural Economics, 86 (1) 14”‘25.
Publisher – Google Scholar
Fleming, R., Babcock, B. & Wang, E. (1998). “Resource or Waste? The Economics of Swine Manure Storage and Management,” Review of Agricultural Economics, 20 (1) 96—113.
Publisher – Google Scholar
Grand River Conservation Authority. (2010). “Rural Water Quality Program,” [Online], [Retrieved September 5, 2012],http://www.grandriver.ca/index/document.cfm?sec=25&sub1=0&sub2=0
Publisher
Hao, X. (2012). ‘Assess Agronomic Value of Digestate-Derived Bio-Fertilizers,’ 2012 Annual Report to Alberta Inovates Bio Solutions. Agriculture and Agri-Food Canada, Lethbridge, Alberta. 88pp.
Innes, R. (2000). “The Economics of Livestock Waste and Its Regulation,” American Journal of Agricultural Economics,82 (1) 97”‘117.
Publisher – Google Scholar
Iowa State University. (1997). “Swine Manure Management and Iowa’s Manure Law,” Iowa State University, Pm-1700, Ames, IA. [Online], [Retrieved October 8, 2012], http://www.extension.iastate.edu/Publications/PM1700.pdf
Publisher – Google Scholar
Kaplan, J. D., Johansson, R. C. & Peters, M. (2004). “The Manure Hits the Land: Economic and Environmental Implications When Land Application of Nutrients Is Constrained,” American Journal of Agricultural Economics, 86 (3) 688-700.
Publisher – Google Scholar
Key, N. D. & Kaplan, J. D. (2007). “Multiple Environmental Externalities and Manure Management Policy,” Journal of Agricultural and Resource Economics, 32 (1) 115-134.
Publisher – Google Scholar
Manitoba Agriculture, Food and Rural Initiatives. (2012). ‘Manitoba Soil Management Guide,’ [Online], [Retrieved October 8, 2012], http://www.gov.mb.ca/agriculture/soilwater/soilmgmt/fsm01s04.html#reg
Miller, J. J., Chanasyk, D. S., Curtis, T. W. & Olson, B. M. (2011). “Phosphorus and Nitrogen in Runoff after Phosphorus- Or Nitrogen-Based Manure Applications,” Journal of Environmental Quality, 40 (3) 949”‘958.
Publisher – Google Scholar
Norwood, F. B. & Chvosta, J. (2005). “Phosphorus-Based Applications of Livestock Manure and the Law of Unintended Consequences,“ Journal of Agricultural and Applied Economics, 37 (1) 79-90.
Publisher
Province of Alberta. (2007). ‘Agricultural Operations Practices Act and Regulations,’ Alberta Queen’s Printer, Edmonton, Canada.
Ribaudo, M., Cattaneo, A. & Agapoff, J. (2004). “Cost of Meeting Manure Nutrient Application Standards in Hog Production: The Roles of EQIP and Fertilizer Offsets,” Review of Agricultural Economics, 26 (4) 430-444.
Publisher – Google Scholar
Ribaudo, M., Gollehon, N., Aillery, M., Kaplan, J., Johansson, R., Agapoff, J., Christensen, L., Breneman, V. & Peters, M. (2003). “Manure Management for Water Quality: Costs to Animal Feeding Operations of Applying Manure Nutrients to Land,” Washington, DC: U.S. Department of Agriculture, ERS AER 824, June.
Publisher – Google Scholar
Schnitkey, G. D. & Miranda, M. J. (1993). “The Impact of Pollution Controls on Livestock-Crop Producers,” Journal of Agricultural and Resource Economics, 18 (1) 25-36.
Publisher – Google Scholar
Sharpley, A. N., Chapra, S. C., Wedepohl, R., Sims, J. T., Daniel, T. C. & Reddy, K. R. (1994). “Managing Agricultural Phosphorus for Protection of Surface Waters: Issues and Options,” Journal of Environmental Quality, 23 (3) 437-451.
Publisher – Google Scholar
Smith, D. R., Owens, P. R., Leytem, A. B. & Warnemuende, E. A. (2007). “Nutrient Losses from Manure and Fertilizer Applications as Impacted by Time to First Runoff Event,” Environmental Pollution, 147 (1)131”‘137.
Publisher – Google Scholar
Smith, E. G., Card, G. & Young, D. L. (2006). “Effects of Market and Regulatory Changes on Livestock Manure Management in Southern Alberta,” Canadian Journal of Agricultural Economics, 54 (2) 199-213.
Publisher – Google Scholar
Smith, K., Grylls, J., Metcalfe, P., Jeffrey, B. & Sinclair, A. (2007). ‘Nutrient Value of Digestate from Farm-Based Biogas Plants in Scotland,’ Report for Scottish Executive Environment and Rural Affairs Department – ADA/009/06. ADAS UK Ltd and SAC Commercial Ltd. 44 Pp.
Google Scholar
United States Department of Agriculture (USDA), (2011). “Environmental Quality Incentives Program,” [Online], [Retrieved September 5, 2012], http://www.nrcs.usda.gov/wps/portal/nrcs/main/national/programs/financial/eqip
Publisher
United States Environmental Protection Agency (USEPA), (2012). “National Pollutant Discharge Elimination System (NPDES),” [Online], [Retrieved September 5, 2012], http://cfpub.epa.gov/npdes/afo/cafofinalrule.cfm
Publisher
Appendix A. Constraints and optimality conditions for applying manure products once every three years.
For the triennial P-based application of manure, the N and P constraints in reported in equation (7) are replaced by the following, plus a total P-limit constraint.
In a long-run solution, additional manure added to location block bn will benefit the block for the year applied, and for the two subsequent years there is reduced inorganic fertilizer purchased for blocks bn+1 and bn+2 as manure application is rotated across the blocks. The four right-most terms of equation A.3 left of the equal sign contain the transport cost, the shadow value of phosphorus times the nutrient release, the shadow value of the phosphorus limit times the nutrients, and the shadow value of manure.