Introduction
Drying is an essential process in many technological areas such as agricultural, chemical, food and wood-processing industries. Also, the drying of residual biomasses is an important issue in regions where agricultural or agro-industrial activity may provide adequate amounts of this kind of potential renewable solid fuel.
Every type of material shows a specific drying curve of its own, that depends on its chemical and physical characteristics. The mathematical description of drying curves is useful for the understanding of the supramolecular idiosyncrasies associated to materials in the drying process:
H2O(in solid matrix) ® H2O(g) + dry solid
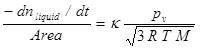
It is important to assess the fraction of moisture that accounts for loosely bound water, that is, water that for drying purposes, behaves as free liquid at the surface of particles. It is useful to give the observed results as drying rates,dx/dt, where x is the extent of the process that has occurred at time t, plotted as a function of the fraction of residual moisture (1 — x) associated to the solid material, at specific environmental conditions [1, 2]. The reader must note that xis conceptually different to the commonly used “X” in the drying-process literature: the dry-basis moisture content. Curves given as mass (or x) vs. time show an initial linear relationship (see Figure 1). This implies that -dm/dt (or dx/dt) is constant. Once a certain critical value is reached (tc, xc), the rate of drying decreases as the process takes place. The end of this zeroth-order kinetic phase indicates that now water evaporation is dependent on factors other than the intrinsic liquid volatility (vapour pressure). The first stage of the drying process involves the total coverage of solid-particle surfaces by water molecules. This layer of liquid behaves independently of the solid substrate, and the drying kinetics shows no relation to the chemical nature of the solid material [3]. The only variables that define dx/dt during the constant-rate period are those given by the Hertz-Knudsen equation for the rate of evaporation of a pure liquid against a stagnant gaseous surrounding [4]:
 (1)
(1)
Where pv is the vapour pressure of the liquid at temperature T, and M is the molecular mass of the liquid. The parameterk is a transmission factor that gives the fraction of liquid molecules that stay in the gaseous phase. This zeroth-order regime continues for as long as the rate of liquid arrival at the surface equals the rate of evaporation. The critical condition is reached when no continuous liquid coverage exists, and therefore the fraction of area covered decreases as the process extends further. During this stage, the rate of drying depends on the residual moisture content, due to water-surface interactions and internal transport limitations. The very last stage of this mechanistic description is that when no liquid remains on the surface, because the plane of evaporation is now slowly diffusing beneath the surface.
Liquids flow through porous matrices by either simple Fickian diffusion (concentration gradients) or by capillarity (intermolecular forces between the liquid and surrounding pore walls). Three solid properties define liquid diffusivity through porous materials: a) porosity (void fraction), b) constrictivity (ratio of mean diameter of moving liquid molecules to diameter of pores) and c) the tortuosity of pores. It is reasonable to state that fluids diffuse faster in porous materials which show high xc values.
Thus, xc can be used as a relative measure of water diffusivity amongst a group of porous materials, besides the macroscopic indication of the fraction of loosely bound moisture in the drying material. Diffusivity is also an important factor in heterogeneously-catalysed processes where catalyst molecules must move and act through pore networks, such as the pulping of wood or the saccharification of lignocellulosic materials.
Thus, we should like to describe an uncomplicated method for the determination of the relative diffusivity of water (and liquids in general) in porous materials based on drying kinetics. A molecular interpretation of the results is also included.
Materials and Methods
Materials
The non-biological samples tested were: diatomite (Industrias Mineras, Barranca, Costa Rica: SiO2 80, 10 %, Al2O3 10, 30 %, Fe2O3 0, 55 %, Na2O 0, 04 %), the zeolite Molecular Sieve Type 4 A (Caledon Laboratories, Canada); the strongly acidic cationic ion-exchange resin Dowex 50W-X2® (H+ form, Fluka) and the anionic ion-exchange resin Rexyn®202 (Cl–-SO4= form, Fisher).
The lignocellulosic residual agricultural biomasses studied were air dried and ground to obtain stringy particles. The samples were kept in sealed polyethylene bags.
Barley (Hordeum vulgare L.) straw was provided by the Centre for the Development of Renewable Energy Sources (CEDER-Soria, Spain). The material was milled to stringy particles of 0.74 ± 0.05 cm in length.
Blue-agave (Agave tequilana) bagasse was provided by PATRON Spirits Company (Atotonilco, Jalisco, Mexico). The material was milled to stringy particles of 6.8 ± 0.4 cm in length.
Oil-palm (Elaeis guineensis Jaq.) empty-fruit bunch was provided by Palma Tica, (Parrita, Puntarenas, Costa Rica). The material was milled to stringy particles of 1.8 ± 0.2 cm in length.
Pineapple (Ananas comosus) stover was provided by Pindeco (Buenos Aires, Puntarenas, Costa Rica). The material was washed and dried, and milled to stringy particles of 0.82 ± 0.07 cm in length.
Rice (Oriza sativa) hull was provided by Hacienda Tío Pelón (Guardia, Guanacaste, Costa Rica). The material had been dried in the open field and was milled to particles of 0.80 ± 0.02 cm in length.
Sugarcane (Saccharum officinarum) bagasse was provided by Hacienda Juan Viñas (Juan Viñas, Cartago, Costa Rica). The material was washed and dried, and had particles of 2.2 ± 0.2 cm in length.
Sweet corn (Zea mays L. Saccharata) was obtained from SARL Soupro+ (Castelmoron sur Lot, France). The material was milled to particles of 0.48 ± 0.04 cm in length.
Drying Curves
The relative humidity in the laboratory was kept at 60 ± 5 %. All measurements were done under the usual 87 kPa barometric pressure in this part of the Country. The two ion-exchange resins were soaked overnight in deionised water.The other materials were soaked overnight with tap water. Just prior to measurements, the soaked materials were pressed between paper towels to obtain free-flowing solids. Ten-gram samples of the water-soaked ground materials were placed on aluminium-foil sample pans of 92 mm diameter. The materials were spread evenly on the pan surface. The extent of the process was followed by monitoring the mass of samples (m) during the first stage of the drying process, in the same way as discussed by Fletcher and collaborators [5], but by using Ohaus MB35 Halogen Moisture Analyzers instead. Data collection was done manually. All measurements were done at 50 °C.
Data Treatment
The raw mass — time data were recalculated as extent of drying x – time, obtained from the simple mass balance x = [m(0) — m(t)] / [m(0) — m(¥)].
The extent of the initial zeroth-order kinetic phase was obtained by determining the slope of the group of x – time data pairs for which a linear correlation is valid with a Pearson’s correlation coefficient rP = 0.9990.
Results and Discussion
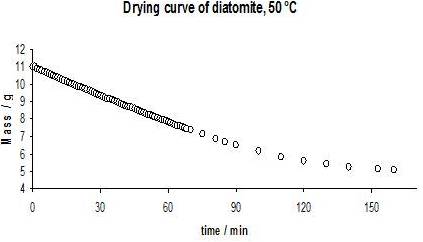
The determination of the fraction of moisture content that can cover entirely the surface of particles is a useful piece of information, for scaling drying processes and obtaining energy-efficiency operational parameters. Figures 1 and 2 show the drying curves of diatomite as example at 50 °C in crude and differential forms (60% RH and 87 kPa).
The first graph shows the expected initial linear behaviour that extends up to t ~ 90 min. The non-linear portion of the curve begins thereafter. The linear segments in all cases were taken as those in which mass-time data pairs correlate with a Pearson’s rp equal to 0.999.
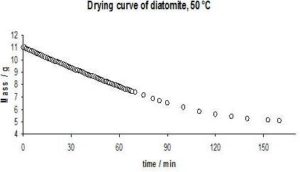
Fig. 1. Crude Data for the Drying Curve of Diatomite at 50 °C, 60% RH and 87 Kpa
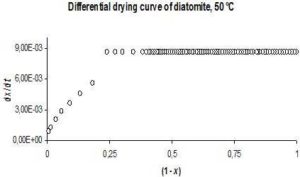
Fig. 2. Drying Curve of Diatomite in Differential form at 50 °C, 60% RH and 87 Kpa
Non-Biological Materials
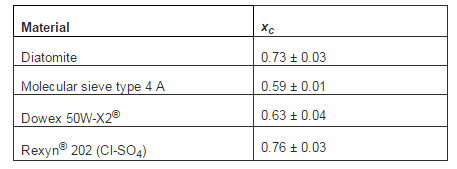
The xc values obtained are given in table 1 for the non-biological materials. Standard deviations result from the reproducibility of three runs.
Table1. xc Parameter for Non-Biological Materials Determined from Drying Curves at 50 °C
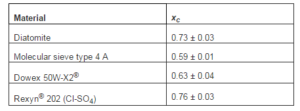
The value of xc is about 24% larger for diatomite than for the zeolite material (0.73 vs. 0.59, p < 0.05). This observation agrees well with expectation, because diatomites have pore sizes in the range 1 mm — 5 mm [6], whereas pores in the zeolite are of 0.4 nm, according to the manufacturer.
Polystyrene-based Na+-form sulphonic cationic resins have mean pore size of 0.8 nm when dry, magnitude which increases up to 1.6 nm when saturated with H2O [7]. This feature agrees well with the similar xc values measured for the zeolite and the cationic resin (0.59 and 0.63, respectively).
Swelling of ion-exchange resins varies according to ion size [7]. Thus, the larger xc value observed for the anionic resin relative to the cationic resin (0.76 vs. 0.63) agrees well with the molecular portrayal of the system.
Lignocellulosic Materials
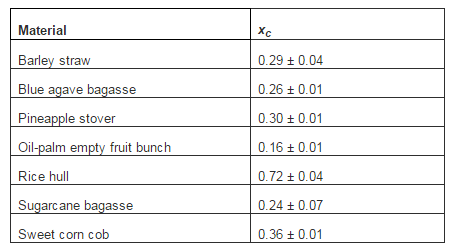
Table 2 gives the results observed for the lignocellulosic biomasses studied.
Table 2. xc Parameter for Biomasses Determined from Drying Curves at 50 °C
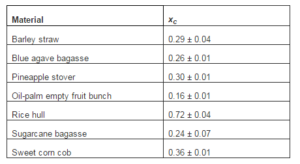
Five biomasses (barley straw, blue-agave bagasse, pineapple stover, sugarcane bagasse and corn cob) show similar behaviour amongst themselves (xc = 0.29 ± 0.04), except for the cases of oil-palm empty fruit bunch (xc = 0.16 ± 0.01; p< 0.025) and rice hull (xc = 0.72 ± 0.04; p < 0.005).
Oil-palm empty fruit bunch shows the lowest xc value. Palm oil extraction is done by extrusion of steam-treated fruit bunches. The residual material contains up to 10 % of its weight as lipids [8]. This much lipid must be located not only at the particles surface but also within the pore space which is relatively large (93 cm3 / 100 cm3) [9]. Thus, an obstructive effect from residual lipid is expected for water diffusivity in this crude palm material, as well as by the silica bodies observed in the pores [10].
On the other hand, rice hull has the highest xc value, that is, H2O diffusivity is largest amongst the biomaterials studied.We have observed that chemical analysis of rice hull shows a SiO2 content of 20 ± 2 %, a value well in agreement with data in the literature. Silica distribution amongst the three main organic components, i.e., cellulose, lignin and hemicellulose in the hull structure was studied by Sheng and Chin [11]. The authors found that silica was mainly bound to polysaccharides. This suggests that degradation of the architecture of the living tissue leaves behind a network of pores that correlate with the highest xc value recorded in our study. In fact, Sambo et al. [12] measured the total pore space of rice hull obtaining the value 79 ± 3 cm3 / 100 cm3 and the mean pore diameter in rice hull was determined by Alemán-Romero [13] as 6.9 nm. These observations agree well with the high xc observed for rice hull.
The residual biomasses show lower xc values than the mineral and synthetic materials included in this study (p < 0.01). Lignocellulosic fibres are of highly polar and hydrophilic character [10, 14-16], and have pores with nanometre-sized diameters [17]. This undoubtedly causes an increase in the frictional resistance to flow inside the biomass pores, thus decreasing the mobility of the water molecules.
A recent report [18] on the correlation of xc with pore size in filter paper yielded the following empirical equation:
log xc = 0.039 log (r/mm) — 0.077 (2)
Where r is pore size. The equation gives the acceptable xc = 0.69 value for rice hull (xc = 0.72, r = 6.9 nm). A satisfactory value xc = 0.62 is obtained for the zeolite material (xc = 0.59, r = 0.4 nm) as well as xc = 0.65 for the Dowex cationic resin (xc = 0.63, r = 1.6 nm).
Conclusions
The determination of drying curves of porous materials is a simple procedure that yields the xc parameter. This value is a useful quantitative criterion about the relative diffusivity of water in porous solids, besides the macroscopic assessment of the fraction of free superficial water in porous samples.
Except for the case of rice hull, the inorganic materials and the ion-exchange resins show higher xc values than the seven biomasses studied. This observation is understood in terms of the higher hydrodynamic severity in biomass pores, due to their constrictivity and polar/hydrophilic nature. Thus, increased frictional resistance to water mobility is expected inside biomass pores.
Acknowledgements
This work was done under the context of the project New feedstock and innovative transformation process for a more sustainable development and production of lignocellulosic ethanol (Babethanol), funded by the European Community’s Seventh Framework Programme (FP7/2007-2013) under grant agreement No. 227498. Ms. Laura Guido-Barboza helped checking the data and running parallel experiments. We acknowledge her kind cooperation.
References
[1] Mujumdar, A. S. & Devahastin, S. (2000). Fundamental Principles of Drying, in: Devahastin, S. (Ed.), Mujumdar’s Practical Guide to Industrial Drying, Exergex Corp., Montreal, Canada, Chapter 1.
Publisher – Google Scholar
[2] Kemp, I. C., Fyhr, B. C., Laurent, S., Roques, M. A., Groenewold, C. E., Tsotsas, E., Sereno, A. A., Bonazzi, C. B., Bimbenet, J.- J. & Kind, M. (2001). “Methods for Processing Experimental Drying Kinetics Data,” Drying Technology, 19 15-34.
Publisher – Google Scholar
[3] Geankoplis, C. J. (2006). Procesos de Transporte Y Principios de Procesos De Separación, 4th Spanish Ed.,CECSA, Mexico, Chapter 8.
Publisher – Google Scholar
[4] Rahimi, P. & Ward, C. A. (2005). “Kinetics of Evaporation: Statistical Rate Theory Approach,” International Journal of Thermodynamics 8 1-14.
Publisher – Google Scholar
[5] Beverly, K. J., Clint, J. H. & Fletcher, P. D. I. (1999). “Evaporation Rates of Pure Liquids Measured Using a Gravimetric Technique,” Physical Chemistry Chemical Physics 1 149-153.
Publisher – Google Scholar
[6] Alfaro-Vargas, A. (2007). “La Tierra Moler O “Diatomita” Como Sistema de Remoción de Sustancias Químicas en El Laboratorio,” Ciencia Y Tecnología (Costa Rica) 25 83-96.
Publisher – Google Scholar
[7] Sata, T. (2004). Ion Exchange Membranes: Preparation, Characterization, Modification and Application, Royal Society of Chemistry, London, P. 118.
Publisher – Google Scholar
[8] A) Previous Characterisations of This Material in Our Laboratory Have Given Amounts of Lipid Content from 8 % – 10 % (Dry Basis); B) Nahrul Hayawin, Z., Astimar, A. A., Anis, M., Hakimi, I. M., Abdul Khalil, A. P. S. & Zawawi, I. (2012). “Vermicomposting of Empty Fruit Bunch with Addition of Palm Oil Mill Effluent Solid,” Journal of Oil Palm Research 24 1542-1549.
Publisher – Google Scholar
[9] Asiah, A., Mohd, R. I., Mohd, K. Y., Marziah, M. & Shaharuddin, M. (2004). “Physical and Chemical Properties of Coconut Coir Dust and Oil Palm Empty Fruit Bunch and the Growth of Hybrid Heat Tolerant Cauliflower Plant,”Pertanika Journal of Tropical Agricultural Science 27 121-133.
Publisher – Google Scholar
[10] Wan Razali, W. A., Baharuddin, A. S., Talib, A. T., Sulaiman, A., Naim, M. N., Hassan, M. A. & Shirai, Y. (2012). “Degradation of Oil Palm Empty Fruit Bunches (OPEFB) Fibre during Composting Process Using In-vessel Composter,”BioResources 7 4786-4805.
Publisher – Google Scholar
[11] Liu, S.- L. & Ho, C.- H. (1960). “Study in the Nature of Silicon in Rice Hull. I. Solubility of the Silicon Part,” Journal of the Chinese Chemical Society (Taiwan) 6 141-153.
Publisher – Google Scholar
[12] Sambo, P., Sannazzaro, F. & Evans, M. R. (2008). “Physical Properties of Ground Fresh Rice Hulls and Sphagnum Peat Used for Greenhouse Root Substrates,” Horticultural Technology 18 384-388.
Publisher – Google Scholar
[13] Alemán-Romero, A. L. (2012). ‘Evaluación de la Esterificación Sobre Cascarilla de Arroz Como Estrategia Para Incrementar la Capacidad de Remoción Del Colorante Rojo Básico 46,” Master of Science Thesis, National University of Colombia-Medellín.
Publisher – Google Scholar
[14] Pasquini, D. Belgacem, M. N., Gandini, A., Curvelo, A. A. & Da, S. (2006). “Surface Esterification of Cellulose Fibers: Characterization by DRIFT and Contact Angle Measurements,” Journal of Colloid and Interface Science 295 79-83.
Publisher – Google Scholar
[15] Li, H., Chen, Q. C., Zhang, X., Finney, K. N., Sharifi, V. N. & Swithenbank, J. (2012). “Evaluation of a Biomass Drying Process Using Waste Heat from Process Industries: A Case Study,” Applied Thermal Engineering 35 71-80.
Publisher – Google Scholar
[16] Razak, N. W. A. & Kalam, A. (2012). “Effect of OPEFB Size on the Mechanical Properties and Water Absorption Behaviour of OPEFB/Ppnanoclay/PP Hybrid Composites,” Procedia Engineering 41, 1593-1599.
Publisher – Google Scholar
[17] Zhao, X., Zhang, L. & Liu, D. (2012). “Biomass Recalcitrance. Part I: The Chemical Compositions and Physical Structures Effecting the Enzymatic Hydrolysis of Lignocellulose,” Biofuels Bioproducts & Biorefining 6, 465-482.
Publisher – Google Scholar
[18] Mata-Segreda, J. F. (2014). “Drying Kinetics as a New Tool for the Estimation of Pore Size of Materials,” UNED Research Journal 6, 149-152.
Publisher – Google Scholar