Introduction
Microalgae are known to accumulate considerable amounts of triglycerides when starving for nitrogen [1-2] or when interacting with bacteria [3]. Due to depleting mineral oil resources and the accumulation of greenhouse gases in the atmosphere, microalgae biomass is a promising sustainable option for the production of biofuels [4] and a possible future feedstock for biochemical industry. Since costs for microalgae biomass production nowadays still exceed revenues from the biofuel market, current challenges for an energetic use of microalgae biomass are the efficient and economic cultivation [5-7] and the development of energy-saving downstream processes for cell content extraction, e.g. lipids. In order to develop and to optimize processes for lipid extraction from microalgae, a simple, reliable and reproducible determination of the lipid content of the feedstock to be processed is essential.
Well-established methods like solvent extraction [8] or gas or liquid chromatography [9, 10] are complex, time-consuming and in most cases require sophisticated background knowledge for attaining reproducible results. Thus, the development of new methods for fast and efficient monitoring of the oil accumulation in algae during cultivation is required.
However, some efforts have been made to upgrade methods based on fluorescent dyes or optical measurements [11-14]. Direct microscopic analysis allows visualization of oil bodies and analysis of sub cellular structures, but a microscope based imaging diagnostics for oil content determination requires the processing of a large amount of microscopic images.
Recently a Raman micro-spectroscopy method was introduced for evaluating the oil composition of living marine diatoms in conjunction with a chemometric method [15]. It enables the observation of real-time variations in individual lipids in diatom cells without specific treatment or oil extraction. In another study, Raman micro-spectroscopy was used to map the presence of botryococcenes in the extracellular matrix and intracellular oil bodies of a Botrycoccus braunii colony, indicating that this method could be applied to determine when oil levels are of both maximal quality and quantity for cell harvesting [16]. Up to now, the limiting factor of this method is the low number of cells analyzed per sample (around 30) which provides a poor average.
A spectrophotometric method based on Sudan Black B has been reported to be successfully used for the determination of lipids suspended in fermentation broth, but not inside individual cells [17]. Another disadvantage of this type of dye is its non-specificity. Sudan Black B stains a variety of lipids, including phospholipids and sterols and not only the neutral fat of algal oil-bodies.
Methods using fluorescent dyes, which are soluble in lipids or bind to specific groups of lipid molecules, have been reported in [18, 19]. A major disadvantage of methods based on fluorescent compounds is that they require a large amount of lyophilized biomass. Furthermore, non-specific staining of cell or organelle membranes, insufficient fluorescent emission or the interference with autofluorescence imposes additional limitations.
Recently a screening method for lipid detection in lyophilized algae powder based on Nile red (NR) fluorescence was reported [14]. However, sampling and preparation time can be reduced if the lipid content of algal cells is measured in situ, e.g. without previous lyophilization.
In the presence of polar and non-polar lipids, NR shifts its specific emission spectra from red to yellow [13]. Accordingly, phospholipids, which are mostly present in membranes, in general emit in red whereas oil-bodies composed of neutral lipids like esterified cholesterol and triglycerides [20, 21] fluoresce in yellow. These properties perfectly qualify the fluorescent dye NR for the monitoring of intracellular stored lipids in cells in cultivation medium. Moreover, processing route assessment work [22] pointed out that wet processing of microalgae exhibits a considerable potential for an energy-efficient production of biofuels. In this case, a diagnostic method for lipid content determination applied to wet microalgae biomass is desirable.
The goal of this work was to prove the hypothesis if NR fluorescence method is an adequate and fast method to detect the amount of intercellular neutral lipids of an algae suspension without any time-consuming intermediate procedures like lyophilization, drying or solvent transfer of lipids. The main improvement was to replace these procedures by using a cell suspension of normalized OD, which has a reliable equal number of cells 106 ml-1. For this purpose, we combined the fluorescent measurement with a spectroscopic method, e.g. optical density (OD) measurement for adjusting the cell density to a normalized OD of 1.0. Finally, we show that the lipid content of a microalgae suspension with a “normalized” cell density can be specified by using the NR-fluorescence method described in this work.
Materials and Methods
Cultivation of Microalgae
The strain Auxenochlorella protothecoides strain number 211-7a was purchased from Sammlung von Algenkulturen (SAG, Göttingen, Germany). A. protothecoides is a green algae with an adequate lipid inventory, when cultivated under nitrogen starvation [1-2]. The cells were grown in a 26 L annular bubble column photo-bioreactor (PBR), in a modified TAP (TRIS-acetate-phosphate) culture medium, prepared as described by Gorman and Levine, 1950 [23]. The pH of culture medium was adjusted to pH 7 after autoclaving. The temperature of the cultivation medium was regulated to 25°C by water cooling through an internal metallic tube. The CO2-flow was adjusted to 2.5 v. % in sterile air at a flow-rate of 60 L∙h-1. The PBR was continuously illuminated (600 µmol s-1m-2) by 8 radially arranged fluorescence lamps (Osram fluora, 36 W).
Fluorescence Microscopy and Imaging
NR stained A. protothecoides were analyzed by light- and fluorescence microscopy (Axioplan 2 imaging, Zeiss, Germany). Images were captured with a cooled CCD camera (Zeiss AxioCam HRc) using 63x objective (Zeiss LD Plan-Neufluar). NR emission was observed with 460±10 excitation and 515 long pass emission filter (Zeiss filter set 09) and with 546±12 excitation and 575-640 band pass emission filter (Zeiss filter set 20). To prevent dye bleaching, the light exposure time of the samples was limited to 1-5 seconds by using the shutter control of the Axiovision software. Multichannel fluorescence images of NR stained algae cells were acquired using the multidimensional acquisition procedure.
Determination of Lipid Content by NR Fluorescence Spectroscopy
The algal suspension was harvested from the PBR during cultivation and adjusted to a cell density which corresponds to an OD (at 750 nm) of 1.0 (+/- 0.05). For adjusting the OD, the cell suspension was diluted with water right before spectroscopic measurement (Genesys 10S UV-VIS, Thermo Scientific). Cellular density was verified by cell counting using a haemocytometer (Neubauer, Marienfeld Germany) and an optical microscope (Axioplan 2 imaging, Zeiss Germany). Nile red (5H-Benzo[α]phenoxazin-5-one, 9-(diethylamino)-) was purchased from Invitrogen, Karlsruhe, Germany. To 1.6 mL of the microalgae suspension (at OD = 1.0), 400 µL of NR stocking solution (30 µg mL-1 in dimethylsulfoxide, DMSO) was added and the tube was vortexed vigorously. Staining was performed within 10 min in the dark. Afterwards the cells were washed twice and harvested by centrifugation for 5 min at 98 ḡ. The supernatant was discarded and the cells were resuspended in 2 mL of water. Final concentration of NR during staining was 6 µg mL-1. The emission fluorescence spectra of NR (emission: 540-750 nm) were acquired by a fluorescence spectrophotometer (Cary Eclipse, Varian USA) using an excitation wavelength of 495 nm (both slit set at 5 nm). Reference lipid suspensions were obtained by a dilution of coffee cream (12.0 g fat per 100 g cream). Diluted cream suspensions of definite concentration (0.012 to 0.480 g L-1) were mixed with NR solution in DMSO of different concentration (2, 4 and 6 µg mL-1) and agitated on a vortex. The relative fluorescence intensity of this reference lipid suspension was analyzed within 20 min after staining by the fluorescence spectrophotometer.
Determination of Lipid Content by the Sulfo-Phospho-Vanillin (SPV) Method
Sulphuric acid, o-phosphoric acid, standard olive oil and vanillin were purchased from Carl Roth GmbH, Karlsruhe, Germany. A volume of 1 mL of algal suspension, adjusted to an OD of 1.0, was centrifuged at 98 ḡ for 5 min, the supernatant was discarded and the cell pellet was re-suspended in 200 µL of deionized water. Afterwards 20 µL of the algal suspension were transferred into a glass vial containing 400 mL of concentrated sulphuric acid. The vials were shaken on a vortex shaker, heated for 15 min in a block heater at 110°C and then cooled to room temperature. To each tube 3 mL of vanillin-reagent (0.2 % in 60 % o-phosphoric acid) were added, the vials were shaken on a vortex shaker and then incubated in the dark at room temperature for 30 min. The absorbance at 525 nm was measured using a spectrophotometer (Genesys 10 s, Thermo Fisher Scientific). The lipid content was calculated by using a calibration curve obtained by repeating the above described method with a lipid standard (standardized olive oil, Carl Roth, Germany, type no.: 8873, in absolute ethanol) [24]. The standard solution had a concentration of 0.1-10 g of total lipids in ethanol.
Gas Chromatography Analysis
For gas chromatographic (CG) quantification and characterization of algal oil, the lipids were extracted from microalgae according to Folch, Lees and Sloane Stanley procedure [25] and methylated as described by Lepage et al 1986 [26]. After extraction, the recovered algal oil was hydrolyzed and the released fatty acids were methylated by acetyl chloride. Samples were analyzed by gas chromatography-mass spectrometry using an Agilent 7890A a CG system equipped with a Supelco SPBTm-PUFA Fused Silica Capillary Column. The peak area of each fatty acid species was normalized based on an internal standard.
Results
Microscopic Analysis of NR Stained Microalgae
A. protothecoides cells stained with NR show a characteristic yellow fluorescence when observed by fluorescence microscopy with the long pass emission filter set 09. The yellow fluorescence emission is assigned to NR dye incorporated into oil bodies inside the algae, while the red emission originates from the characteristic autofluorescence peak of chlorophyll A (middle image in Fig. 1). When observing the same sample with the band pass emission filter set 20 (546±12 575-640, Fig. 1 bottom), the disturbing red emission of chlorophyll is blocked while the fluorescence emission of NR from oil bodies and the cell membrane is clearly visible. Unstained algae cells only show red fluorescence emission from chlorophyll. Contrary to NR solution in lipids, NR fluorescence emission from dye molecules solved in water or in other polar solvents can be neglected.
In general, old algae cells contain an increased number of large oil bodies compared to younger cells, which do not exhibit intracellular oil bodies. The average diameter of the oil bodies of 1.2 ± 0.4 µm was determined by microscopic measurement and evaluated by Axiovision software.
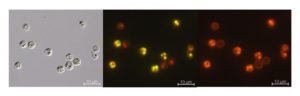
Fig. 1. Images from an identical sample of a suspension of the green alga A. protothecoides, stained with the fluorescent dye Nile Red observed by bright field microscopy (above) and fluorescence microscopy (bottom) using filter set 09 and 20, respectively. Stained oil bodies are visible inside the cells in yellow color (filter set 09, middle) or in red when observed with the band pass emission filter set 20 (bottom).
Spectrofluorimetric Characterization of NR Stained A. protothecoides
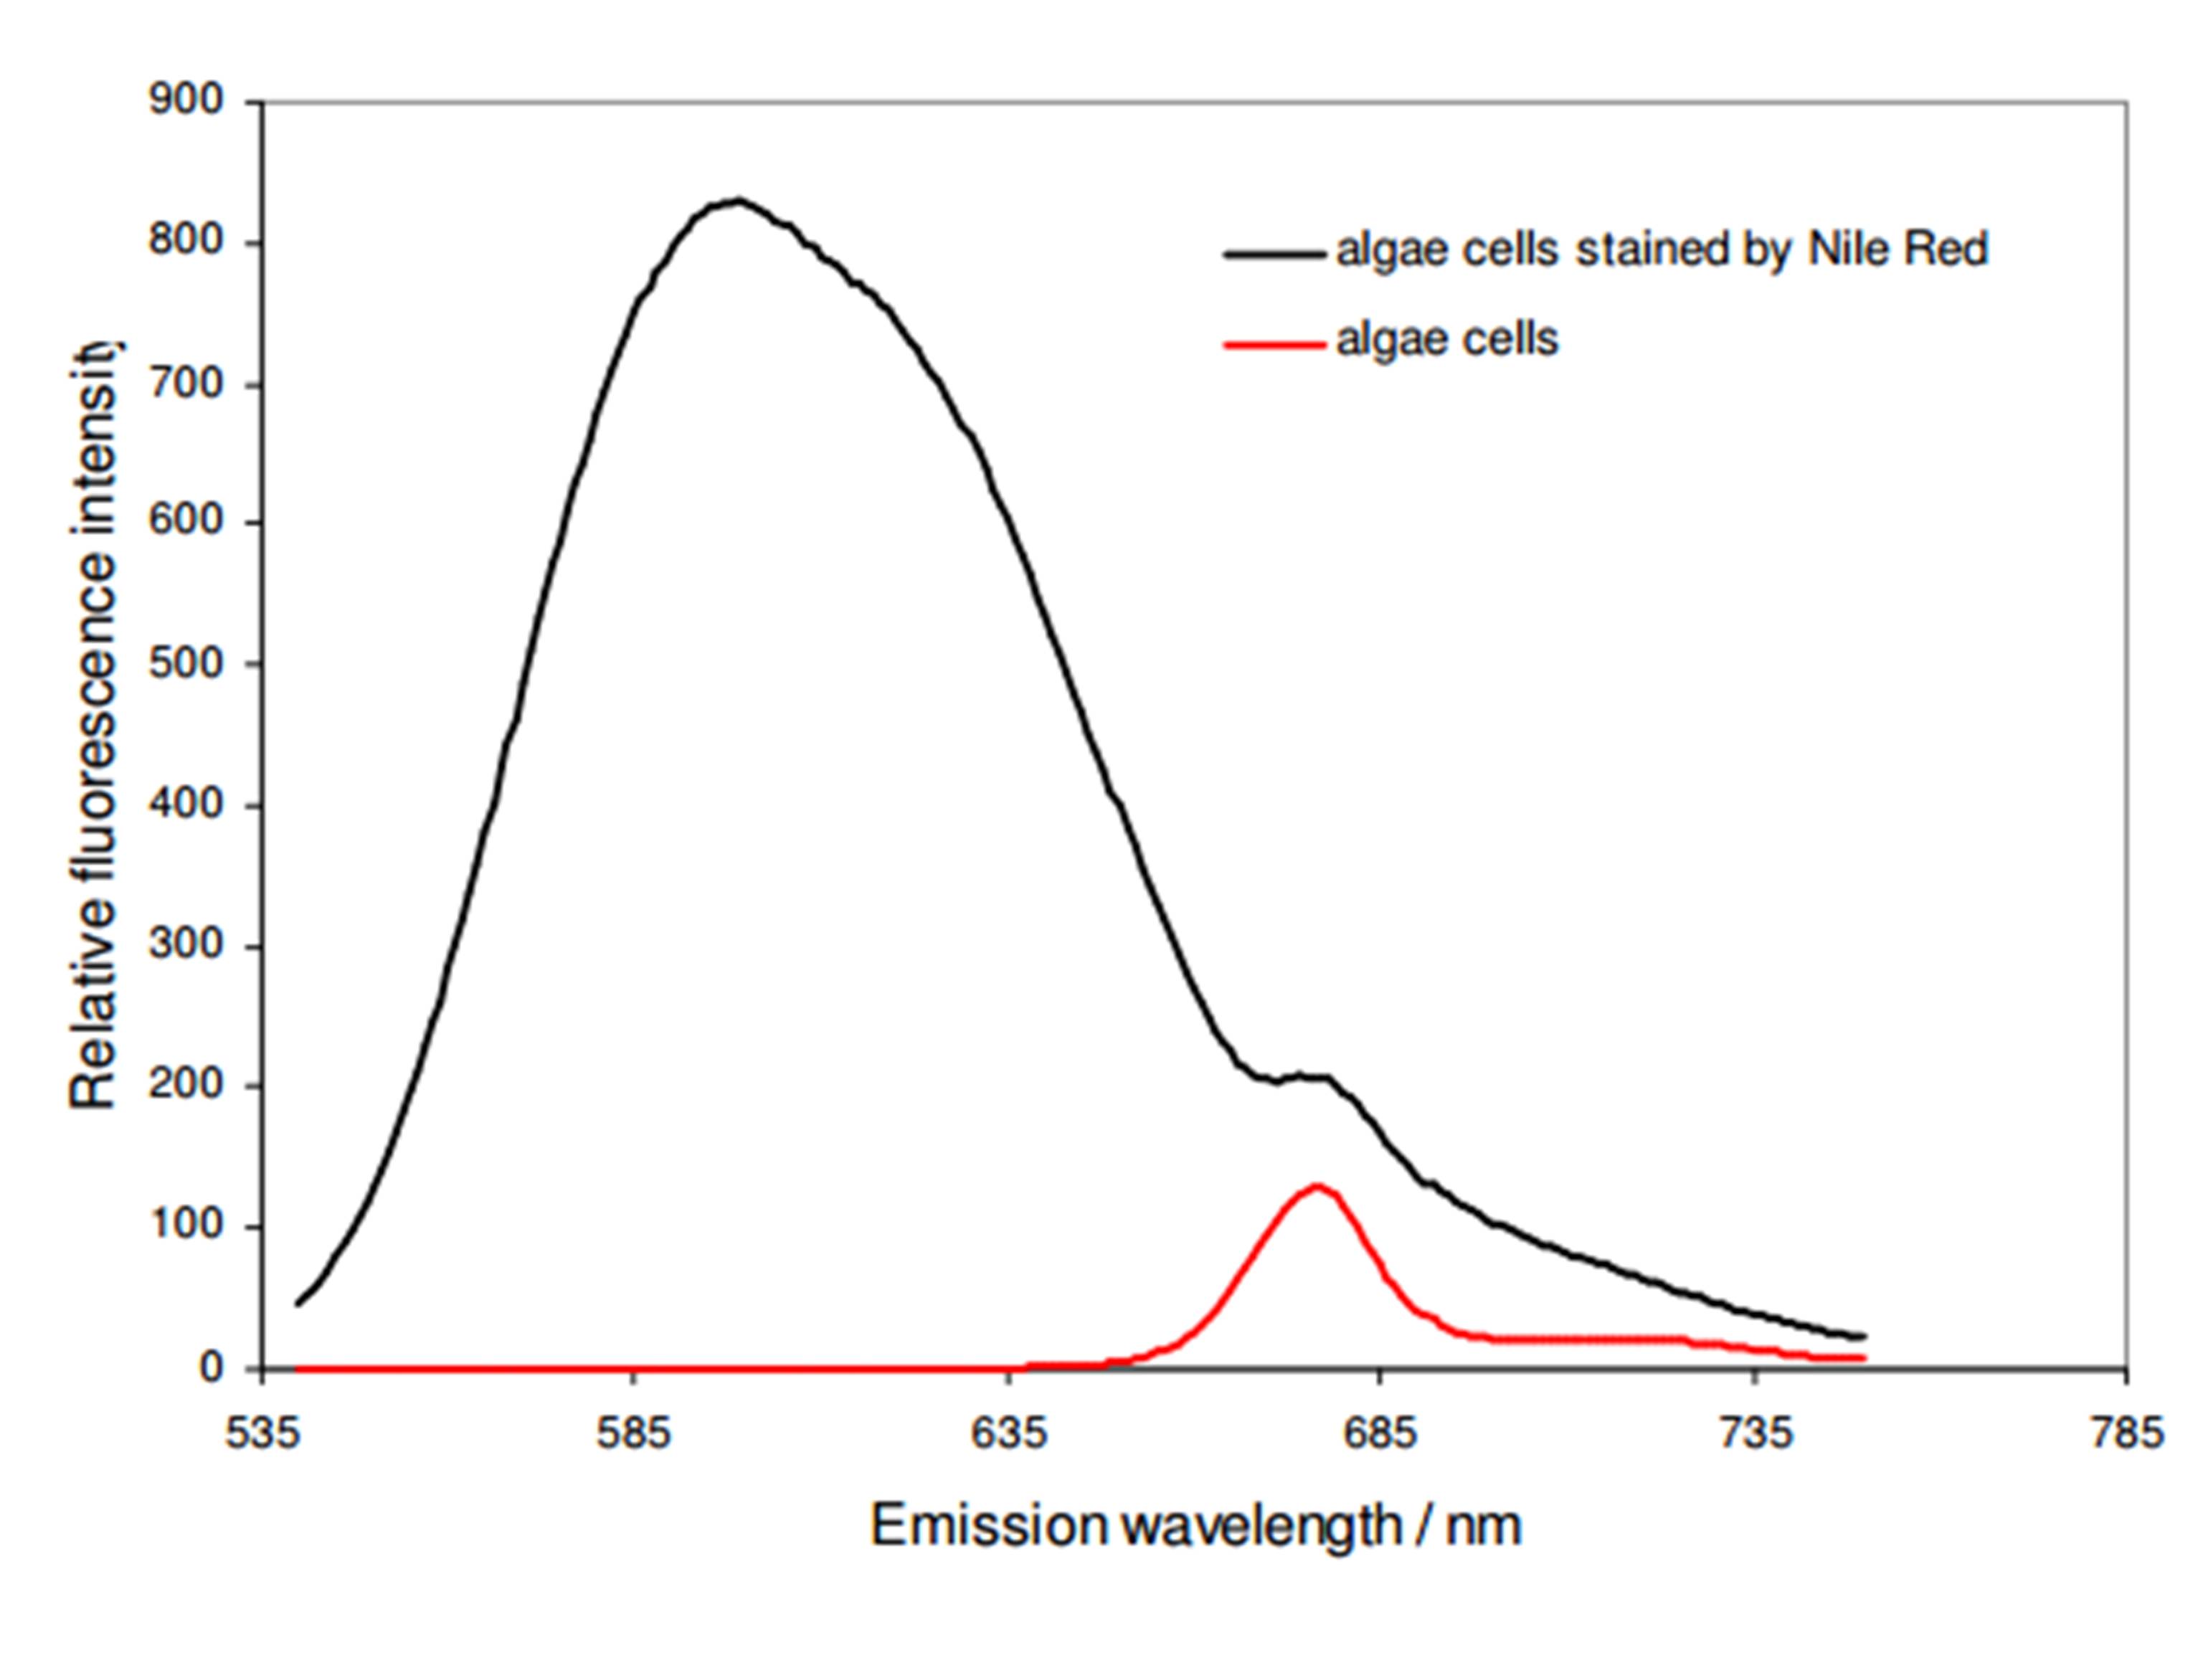
As shown in Fig. 2, NR stained A. protothecoides cells have a specific emission peak at 598 nm when excited at 495 nm. Stained cells as well as unstained cells also have an emission peak at 678 nm, which is the characteristic autofluorescence peak of chlorophyll A. NR exhibits rather low background fluorescence, when it is not dissolved in a lipid-rich environment. Following, the background fluorescence emission can be neglected for further evaluation.
Tests on the influence of staining time on fluorescence emission intensity of NR stained algae cells revealed that a staining time longer than 10 min does not increase the relative fluorescence intensity.
In order to test the influence of cell density on fluorescence intensity, algae suspensions with a cell concentration in the range of 2×10⁸ – 5×10⁸ mL-1 which corresponds to an OD between 0.4 and 1.0 were used. Best fluorescence signal could be obtained with a cell density corresponding to an OD of the suspension of 0.8 to 1.0. At higher cell densities, the fluorescent emission was quenched.
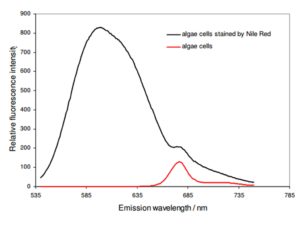
Figure 2: Emission spectrum of Nile Red stained algae cells (black) having an emission peak at 598 nm. Unstained cells (red) show only an emission peak at 678 nm which can be assigned to the characteristic autofluorescence peak of chlorophyll.
Monitoring of the Oil Accumulation during Cultivation
In a first approach, we investigated the behavior of the fluorescence intensity of NR stained algae cells sampled periodically from PBR, focusing on the relative quantification of the lipid content. Prior to staining, the algae cell density was adjusted to an OD of 1.0, which in the following is defined as our reference cell density for all measurements. The duration of the cultivation was 50 d. After 30 d, the PBR was partially harvested. As shown in Fig. 3, the relative fluorescence intensity of algae cells stained by NR (solid curve) increased during cultivation, indicating an oil accumulation inside the algae cells. The diagram shows cell density (Fig. 3, dots) and lipid content of the reference algae suspension, exhibiting always the same cell density (OD = 1.0).
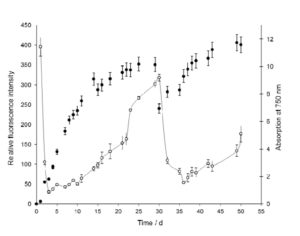
Figure 3: Monitoring of algal growth (-) by measuring the OD at 750 nm. The lipid accumulation (*) is indicated by the relative fluorescence emission (587 nm) of algae cells stained by Nile Red. In all cases, prior to fluorescence measurement, the cell density was adjusted to a reference density of OD = 1. The algae culture was partially harvested after 30 d.
During the first 30 d of cultivation, the lipid content only slowly increases at the beginning of the cultivation and increases faster, when the cell density approaches the stationary phase. At day 30, half of the algae suspension of the PBR was harvested and replaced by fresh cultivation medium. Whereas cell density recovers fast, the lipid content did not significantly rise before day 50. This demonstrates that cell density and lipid content are not correlated directly. This result nicely indicates that lipid accumulation in microalgae predominantly occurs in stationary phase [27-29].
The large fluorescence intensity at the beginning of the cultivation is due to the high oil content of inoculums cells, which were cultivated mixotrophically for more than 4 weeks. These high intensity values decrease during the first days of cultivation in PBR due to the high metabolic activity right after inoculation and due to the increased cell division. As already mentioned in chapter 3.1, younger cells do not produce lipid droplets.
The Quantification of Lipid Content
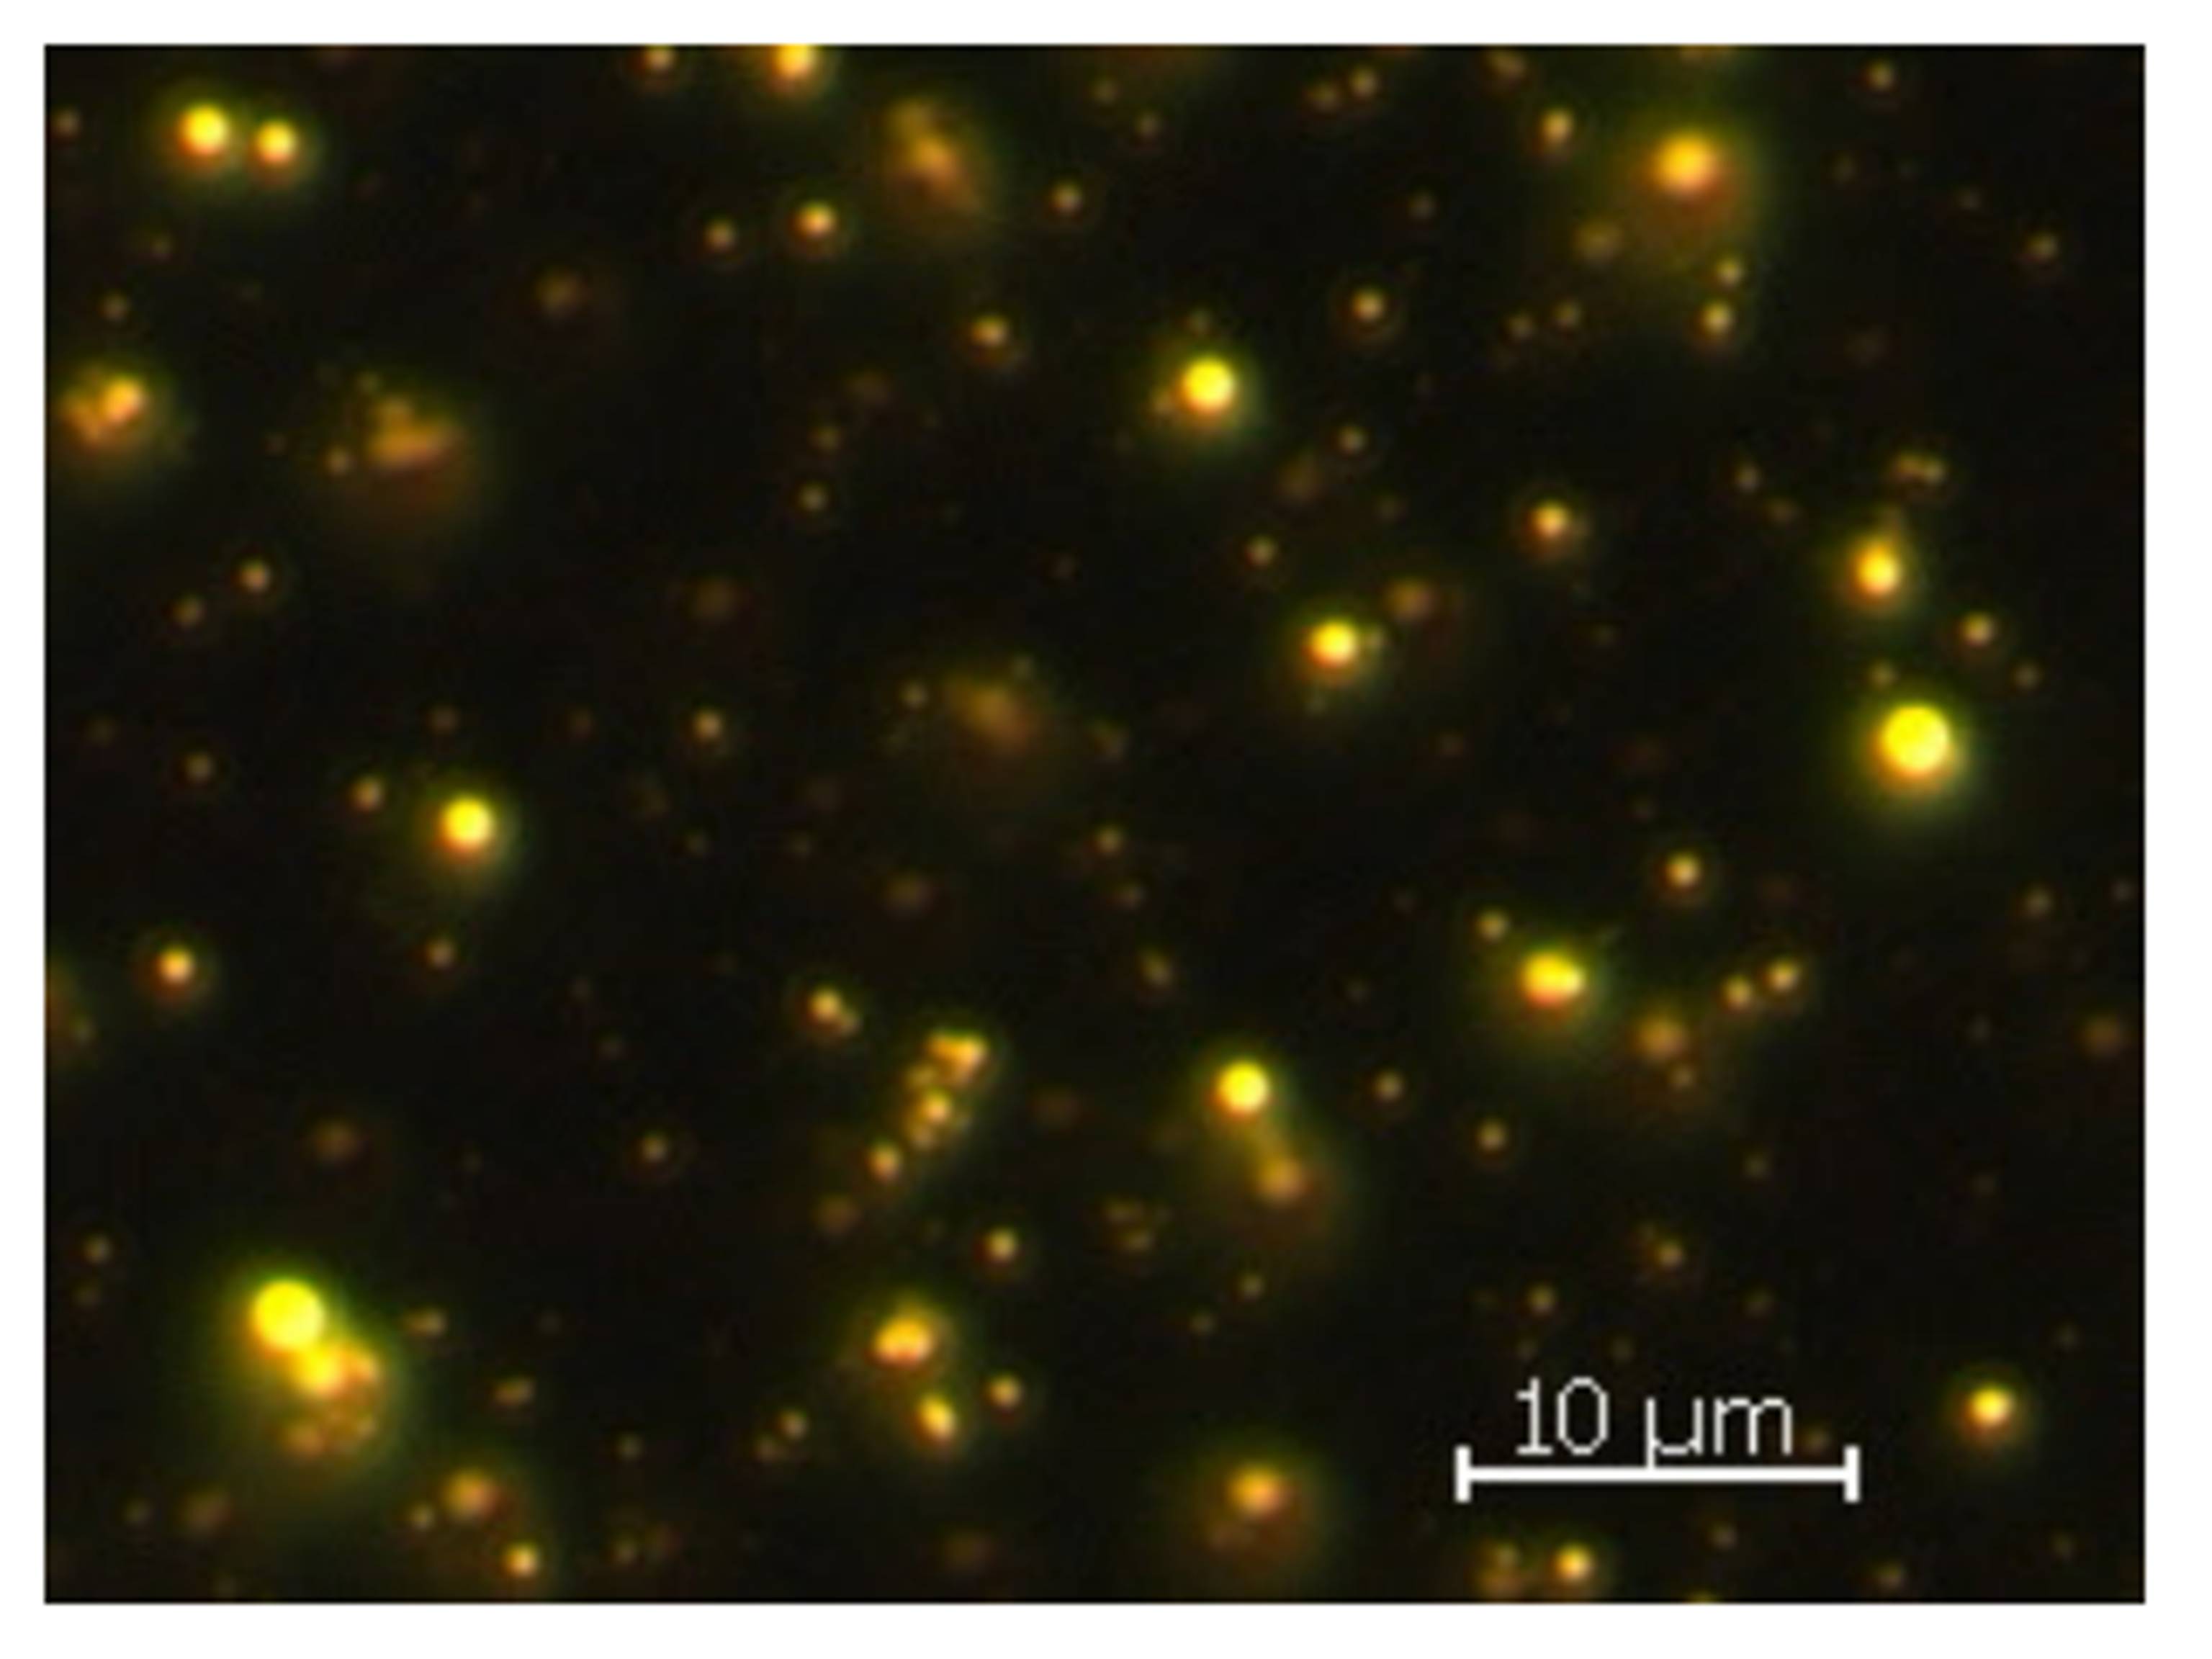
For further quantification of this method, the relation between relative fluorescence intensity and lipid content was determined by the binding of NR to fat globules of a milk emulsion and by varying the fat concentration. Although the emission peak of NR from stained fat globules is shifted to 588 nm due to an unavoidable residual concentration of DMSO in the emulsion, the curves reflect the relationship between lipid concentration and fluorescence emission well. Fig. 4 shows a microscopic fluorescence image of fat globules stained with NR. Compared to Fig. 1, middle, the fat globules exhibit the same fluorescence emission and have a size distribution with an average diameter of 1.2 ± 0.4 µm. The same size distribution was obtained for lipid droplets in algae cells, cf. chap. 3.1. For this condition, it is possible to assign the relative fluorescence emission from fat globules of a known concentration in emulsion to the lipid concentration in algae.

Figure 4: Milk emulsion stained by Nile Red and observed by fluorescence microscopy using filter set 09 (Zeiss, Germany). The average diameter of fat globules is 1.2 ± 0.4 µm.
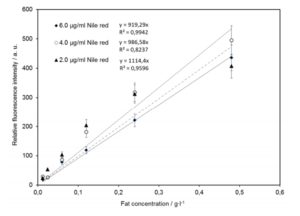
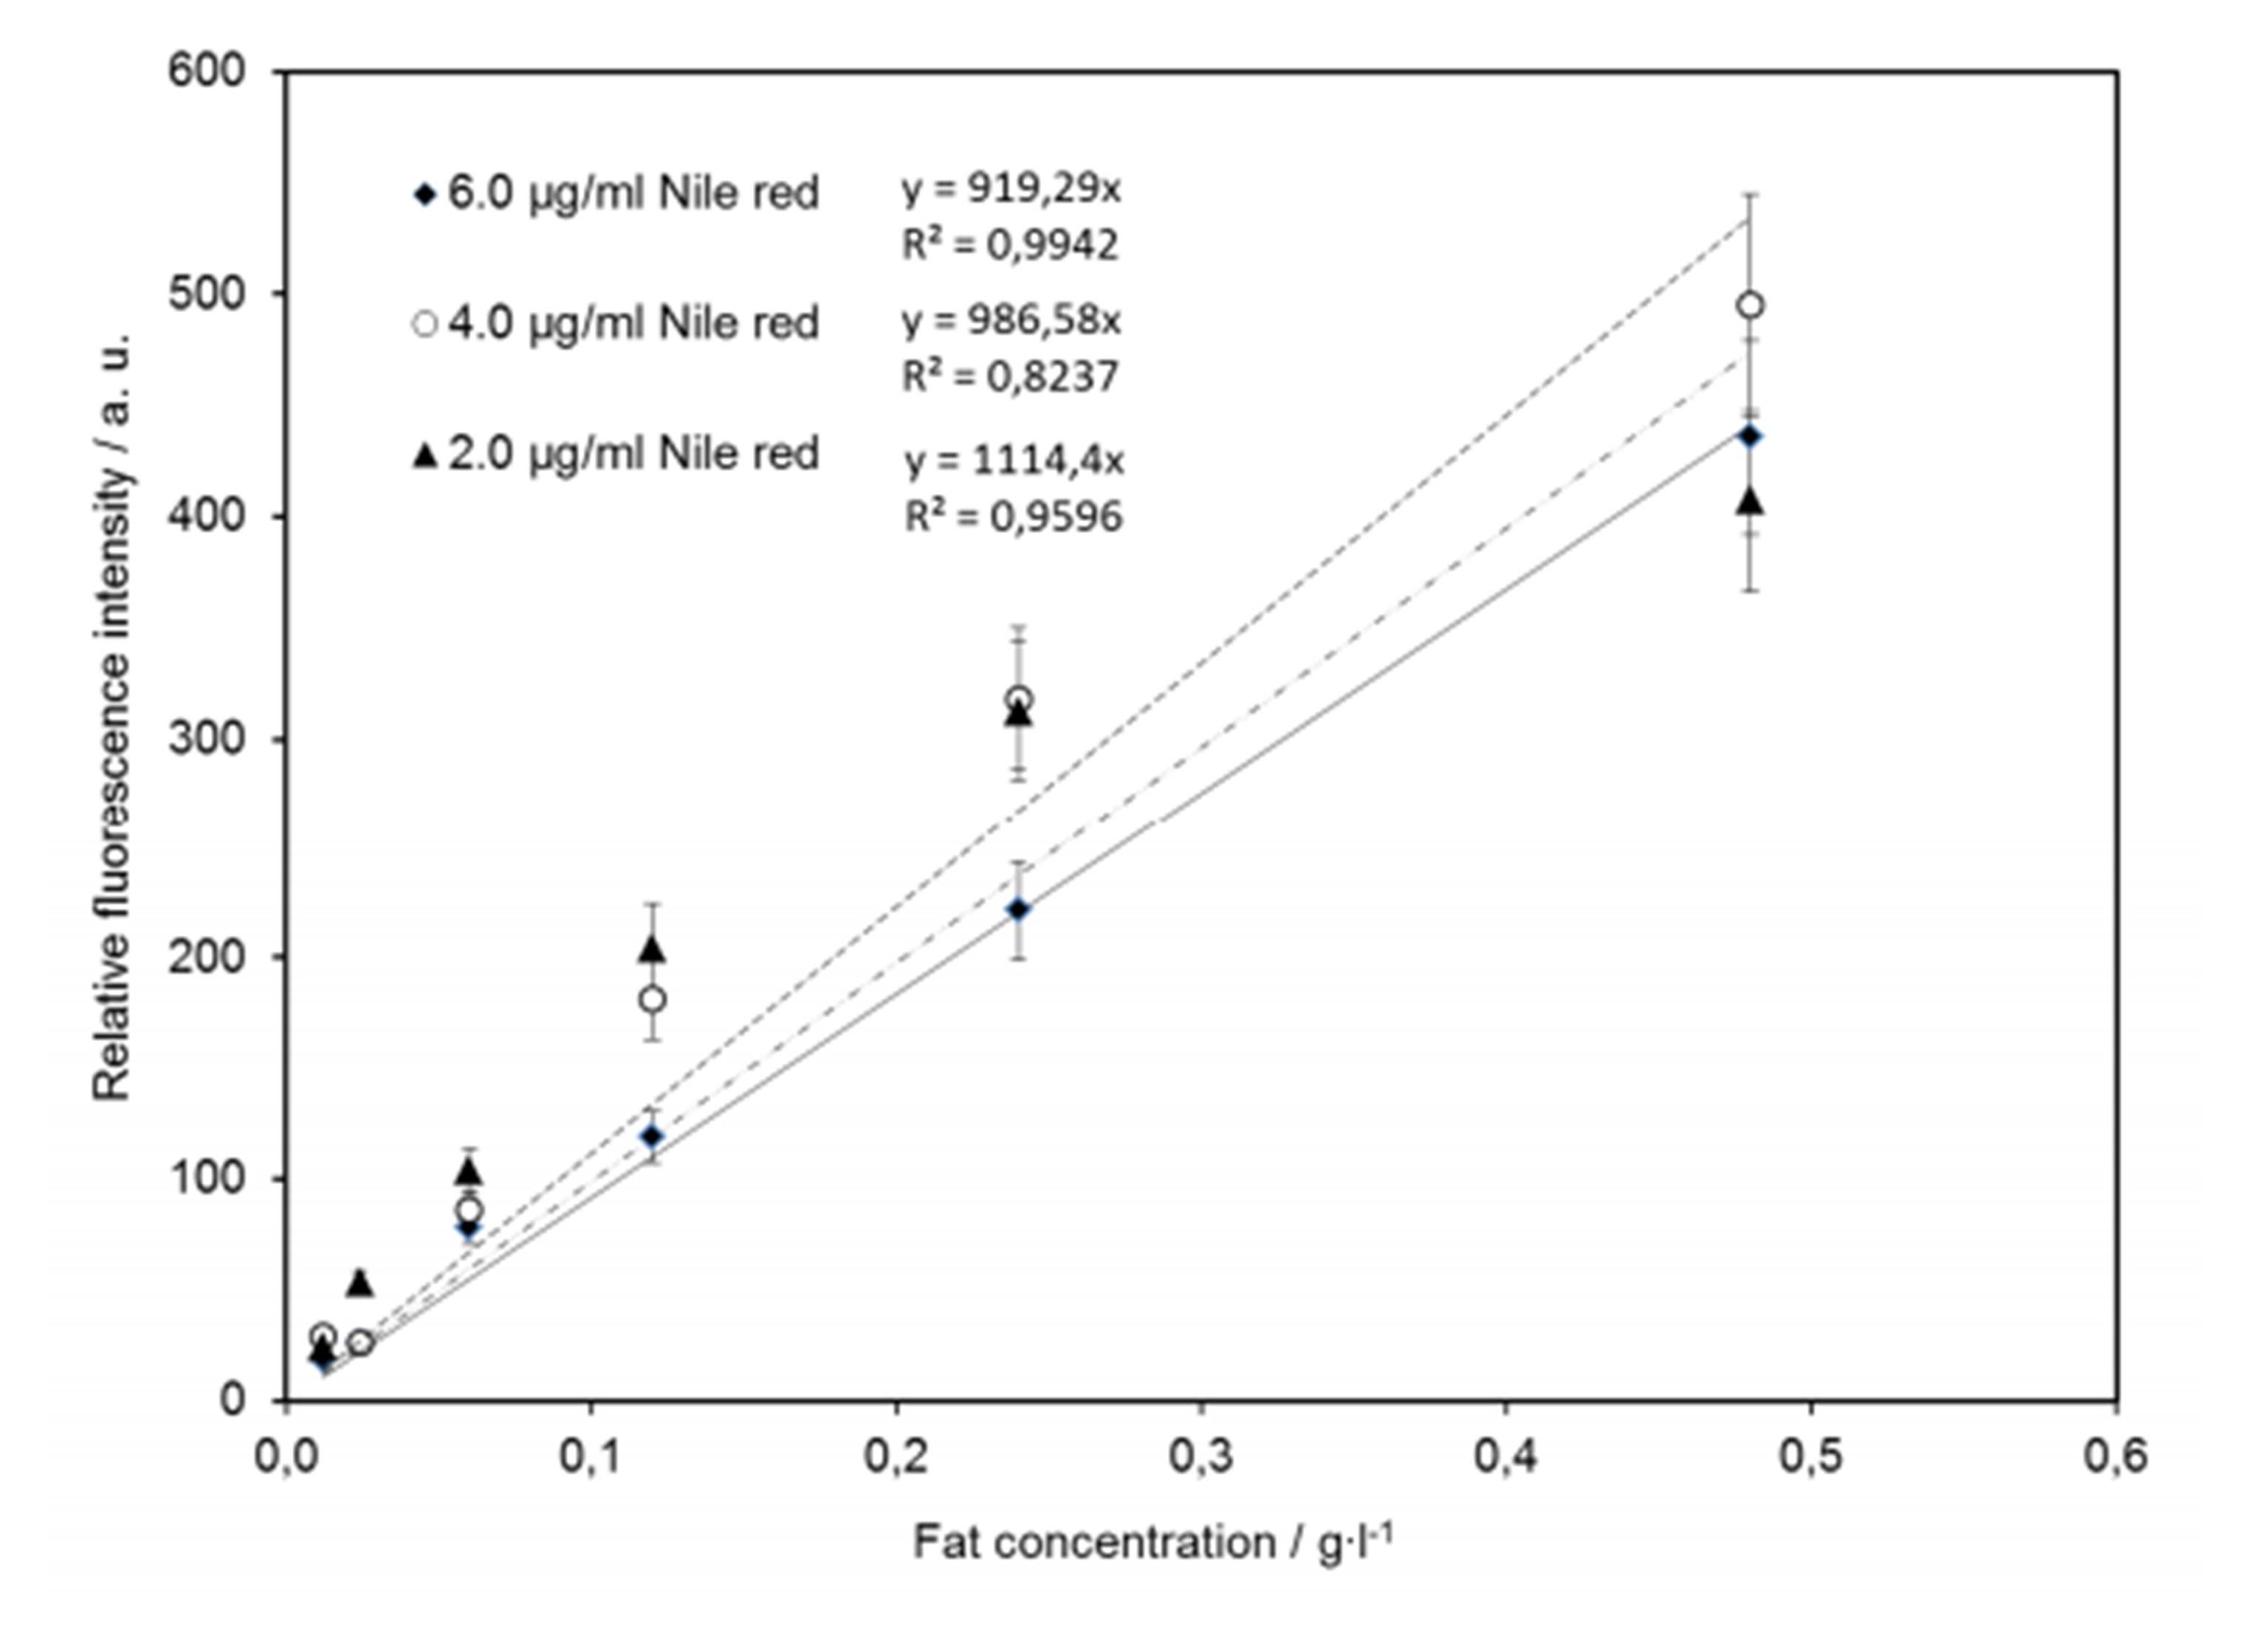
Figure 5: Effect of the fat concentration, 0.01-0.48 g L-1, on Nile Red fluorescence probes, with Nile Red of 2, 4 and 6 µg mL-1.
Important for applicability of this method is that fluorescence intensity linearly increases with fat concentration. The effect of NR concentration on lipid quantification is shown in Fig. 5. NR concentrations of 2, 4 and 6∙ mg L-1 were tested in milk emulsions of increasing fat globules density in the range between 0.012 and 0.480 g L-1. The relative fluorescence intensity of the milk emulsion of each concentration was analyzed within 20 min after NR staining. As shown in Fig. 5, a concentration of 6 mg L-1 NR is necessary to cover the required lipid concentration measurement range up to 0.48 g L-1. Within this concentration range, the relative fluorescence intensity is linearly correlated to the fat concentration, according to the following equation: (1) IntensityNile red = 918.3 x Fat concentration [g L-1]. The coefficient of determination for this relation is R2 = 0.991.
Up to this point, a correlation between the lipid content of a culture medium sample containing algae cells at OD = 1.0 (reference suspension) and the NR fluorescence intensity is available. Final objective of this method is to give a correlation to the lipid content of dry biomass. This correlation can be given by determining the dry biomass weight of the reference suspension (OD = 1). Therefore, 40 ml of a reference algal suspension were washed twice by centrifugation and re-suspended in deionized water. After washing, the pellet was dried at 80°C until the weight of the sample remains at a constant value. Applying the above described method, the dry biomass concentration of the reference algae suspension was determined to 0.67±0.06 g kg-1. The knowledge of the dry biomass concentration of the reference algae suspension allows the deduction of the lipid content of dry microalgae from fluorescence intensity measurements performed on microalgae stained by NR and suspended in cultivation medium. This correlation between NR fluorescence intensity acquired at 590/10 nm and the resulting lipid content of the dry algae biomass is given for four samples obtained during microalgae cultivation in PBR, cf Fig. 5, and summarized in Table 1. The lipid concentration related to dry microalgae biomass was calculated according to equation (1) and Fig. 5.
To verify the lipid content of the algae samples, the SPV method, which in meanwhile is well established for algae lipid content determination [30], was employed. Data are shown as means from two independent experiments. Significant differences of oil content values calculated by NR and SPV method were analyzed using ANOVA followed by unpaired t-test; p-value>0.05 and p(T 0.05, Table 1. This analysis indicates that the two methods predict similar oil content values.
In order to verify whether the composition of standard oil, used for calibration of the SPV-method, correspond to the main composition of microalgae oil, a gas-chromatographic analysis was performed. The analysis show following fatty acid composition of microalgae oil: C16:0 11-12%; C18:0 3-6%; C18:1 39-42%; C18:2 35-38% and C18:3 4-9%. Values are expressed in % recovery and represent the means of three samples. Thus, the amount of unsaturated fatty acids which are practically detected by the SPV-method was 78%-89%. The composition of the standard oil differs from algal oil with respect to the ratio of individual fatty acids, see also [31]; however, if only the amount of unsaturated fatty acids is considered, than the composition is quite similar, 65%-88% unsaturated fatty acids.
Discussion
The SPV reaction initially was developed as a standard routine for determination of the total lipid content in human cerebrospinal fluid. The chemical basis of this colorimetric reaction is the formation of a charged colored complex of vanillin and fatty acids in strong acidic milieu that absorbs maximally at 525 nm [32, 33]. The increase of absorbance at 525 nm is proportional to the amount of the formed complex, and thus to the amount of lipids available in the sample. For evaluation, the measured absorbance of the sample is compared to a calibration curve, obtained from the analysis of a lipid standard. This method has been adapted to extracted algal lipids. In this case, olive oil is used as standard. The results show a good linearity in the range of 0.1 to 10 g L-1 lipids, Fig. 6.
For low concentrations, the results for the lipid concentration of dry algae biomass obtained by applying the SPV-method are in general higher compared to the values determined by the Nile-Red method and in satisfactory agreement only at higher lipid concentrations. This most probable is due to a systematic uncertainty of the SVP method. The vanillin complex binds to C=C double bounds of the fatty acid chains of the lipids [29]. Since algae oil standards are not available yet, the C=C double bound content of the oil standard (olive oil) used for calibration is not necessarily the same as assumed for algae lipids. In our case the ratio of unsaturated to saturated fatty acids of oil standard and algae oil was very similar, as shown by the gas-chromatographic analysis. Thus, this uncertainty can be neglected. On the other hand, by using the SPV method, the concentration of all lipids, including the lipids in cell membrane, is detected, whereas in case of the NR method, the main fluorescence emission originated from NR incorporated into lipid droplets. Therefore, a constant shift in concentration is inevitable. To increase the precision of the method, this amount can be subtracted by detecting first the amount of lipids of a cell suspension, which does not contain any oil droplets. For some algae species, the SPV-method may not be suitable, considering that some have a very dense cell wall, which influences the lipid extraction and subsequently the results. Therefore, another more precise analytical method should be considered [33].
Thus, at the current state of work and based on considerations above, the accuracy of the NR method for the determination of the absolute lipid content of dry microalgae biomass can be confirmed to be better than 25% for lipid concentrations higher than 10%. Nevertheless, for applications, where a determination of the absolute lipid content is not required and the knowledge of the relative fluorescence intensity is sufficient, e.g. for a determination of the best harvesting time of algae cultures with respect to comparable lipid content, the NR method exhibits excellent suitability and reproducibility due to the high linearity of the fluorescence intensity over lipid content within the usual concentration range of intracellular stored lipids in algae suspended in cultivation medium.
This study confirms NR to be an adequate fluorescence probe for the detection of neutral lipids in-vivo, avoiding drying of the microalgae. In addition, the lipid content inside algae cells in reference suspension (fixed OD) can be quantified by combining fluorescence measurement and OD measurement. When using DMSO for dye solubilization, NR staining of algae suspensions results in a strong and reproducible fluorescence emission from stained lipids inside the algae cells. This was confirmed by fluorescence microscopy imaging and fluorescence spectroscopy.
Conclusions
This work provides a simple and reliable method for the monitoring of lipids in fresh algae suspension (in-vivo) from PBR cultivation. The NR method exhibits very short processing times compared to gravimetric and other methods which have usually been used for algal lipid determination. The required processing time is shorter than 30 min and the required sample volume is less than 5 ml. Essential preparation steps of alternative methods, like time-consuming cell drying or lyophilization, can be skipped.
Prior to staining, the algae suspension has to be adjusted for a reference cell concentration by setting the OD to a definite value of 1.0. This intermediate step provides linearity between the relative change of the fluorescence intensity and the quantity of lipids accumulated inside the algae cells. Optimal staining of the reference algae suspension was accomplished by an NR concentration of 6 µg L-1. Under these conditions, the NR method covers the usual lipid concentration range expected from lipid-producing algae cells of up to 70% related to dry weight. Up to this lipid concentration, the relative fluorescence intensity and the lipid concentration are correlated linearly, which is a basic condition for lipid quantification by optical fluorescent techniques. On the first approach, the accuracy of the results was verified and statistically validated by ANOVA and t-test. However, due to the chemical nature and calibration uncertainties of the SPV method, the accuracy of the Nile-Red method is suggested to be better than 20%, which has to be verified by appropriate methods in future work.
References
1. Yujie F, Chao L, Dawei Z. Lipid production of Chlorella vulgaris cultured in artificial wastewater medium. Bioresource Technology 2011; 102: 101-105.
Puplished – GoogleScholar
2. Arief W, Chao-Chang C, Yi-Hsu J. Study of increasing lipid production from fresh water microalgae Chlorella vulgaris. J Taiwan Inst Chem Eng 2009; 40: 13-20.
Puplished – GoogleScholar
3. de-Bashan L E, Bashan Y, Moreno M, Lebsky V K, Bustillos J J. Increased pigment and lipid content, lipid variety, and cell and population size of the microalgae Chlorella spp. when co-immobilized in alginate beads with the microalgae-growth-promoting bacterium Azospirillum brasilenses. Can J Microbiol 2002; 48: 514—521.
Puplished – GoogleScholar
4. Schenk PM, Thomas-Hall SR, Stephens E, Marx UC, Mussgnug JH, Clemens Posten C, Kruse O, Hankamer B. Second Generation Biofuels: High-Efficiency Microalgae for Biodiesel Production. Bioenerg Res 2008; 1: 20-43
Puplished – GoogleScholar
5. Posten C. Design principles of photo-bioreactors for cultivation of microalgae. Eng Life Sci 2009; 9: 165-177.
Puplished – GoogleScholar
6. Lehr F, Posten C. Closed photo-bioreactors as tools for biofuel production. Curr Opin Biotech 2009; 20: 2080-285.
Puplished – GoogleScholar
7. Morweiser M, Kruse O, Hankamer B, Posten C. Developments and perspectives of photobioreactors for biofuel production. Appl Microbiol Biotechnol 2010; 87:1291-1301.
Puplished – GoogleScholar
8. Cooney M, Young G, Nagle N. Extraction of Bio-oils from Microalgae. Sep Purif Rev 2009; 38: 291.
Puplished – GoogleScholar
9. Carvalho AP, Malcata FX. Preparation of Fatty Acid Methyl Esters for Gas-Chromatographic Analysis of Marine Lipids: Insight Studies. J Agric Food Chem 2005; 53: 5049-5059.
Puplished – GoogleScholar
10. Wiltshire KK, Boersma M, Möller A, Buhtz H. Extraction of pigments and fatty acids from the green alga Scenedesmus obliquus (Chlorophyceae). Aquat Ecol 2000; 34: 119—126.
Puplished – GoogleScholar
11. Cooksey KE, Guckert JB, Williams SA, Callis PR. Fluorometric determination of the neutral lipid content of microalgal cells using Nile red. J Microbiol Methods 1987; 6: 333— 345.
Puplished – GoogleScholar
12. Elsey D, Jameson D, Raleigh B, Cooney MJ. Fluorescent measurement of microalgal neutral lipids, J Microbiol Met 2006; 68: 639-642.
13. Diaz G, Melis M, Batetta B, Angius F, Falchi AM. Hydrophobic characterization of intracellular lipids in situ by Nile Red red/yellow emission ratio. Micron 2008; 39: 819-24.
Puplished – GoogleScholar
14. Chen W, Zhang C, Song L, Sommerfeld M, Hu Q. A high throughput Nile red method for quantitative measurement of neutral lipids in microalgae. J Microbiol Met 2009; 77:41-47.
Puplished – GoogleScholar
15. Meksiarun P, Spegazzini N, Matsui H, Nakajima K, Matsuda Y, Sato H. In vivo study of lipid accumulation in the microalgae marine diatom Thalassiosira pseudonana using Raman spectroscopy. Appl Spectrosc 2015; 69:45-51.
Puplished – GoogleScholar
16. Weiss TL, Chun HJ, Okada S, Vitha S. Holzenburg A, Laane J, Devarenne TP. Raman Spectroscopy Analysis of Botryococcene Hydrocarbons from the Green Microalga Botryococcus braunii. J Biol Chem 2010; 285: 32458—32466.
Published – GoogleScholar
17. Thakur MS, Prapulla SG, Karanth NG. Estimation of intracellular lipids by the measurement of absorbance of yeast cells stained with Sudan Black B. Enzyme Microb Technol 1989; 11(4): 252-254.
Publisher – GoogleScholar
18. Pomoshnikova NA, Korotkov SA, Galanina LA. Use of fluorescent analysis for the study of lipid synthesis by mycelial fungi. Microbiol (USSR Intern Ed) 1983; 52: 698-701.
19. Kimura K, Yamaoka M, Kamisaka Y. Rapid estimation of lipids in oleaginous fungi and yeasts using Nile red fluorescence. J Microbiol Met 2004; 56(3): 331-338.
Publisher – GoogleScholar
20. Bartz R, Li WH, Venables B, Zehmer JK, Roth MR, Welti R, Anderson R GW, Pingsheng Liu, Chapman KD. Lipidomics reveals that adiposomes store ether lipids and mediate phospholipid traffic. J Lipid Res 2007; 48:837-847.
Publisher – GoogleScholar
21. Sally M, Parton RG. Lipid droplets: a unified view of a dynamic organelle. Nat Rev Mol Cell Bio 2006; 7: 373-378.
Publisher – GoogleScholar
22. Brilman Su L, Withag DJ, Brem G, Kersten S. Assessment of a dry and a wet route for the production of biofuels from microalgae: Energy balance analysis. Bioresource Technol 2011; 102: 5113-5122.
Publisher – GoogleScholar
23. Gorman DS, Levin RP. Cytochrome f and plastocyanin: their sequence in the photosynthetic electron transport chain of Chlamydomonas reinhardi. Proc Natl Acad Sci USA 1965; 54: 1665-1669.
24. Eing C, Goettel M, Straessner R, Gusbeth C, Frey W. Pulsed Electric Field Treatment of Microalgae – Benefits for Microalgae Biomass Processing. IEEE T Plasma Sci 2013; 41: 2901-2906.
Publisher – GoogleScholar
25. Folch, J, Lees M, A Simple Method for the Isolation and Purification of Total Lipides from Animal Tissues. J Biol Chem 1957; 226(1): 497-509.
GoogleScholar
26. Lepage G, Roy CC. Direct Transesterification of All Classes of Lipids in a One-Step Reaction. J Lipid Res 1986; 27(1): 114-120.
GoogleScholar
27. Casadevall E, Dif D, Largeau C, Gudin C, Chaumont D, Desanti O. Studies on batch and continuous cultures of Botryococcus braunii: hydrocarbon production in relation to physiological state, cell ultrastructure, and phosphate nutrition. Biotechnol Bioeng 1985; 27: 286-95.
Publisher – GoogleScholar
28. McGinnis KM, Dempster TA, Sommerfeld MR. Characterization of the growth and lipid content of the diatom Chaetoceros muelleri. J Appl Phycol 1997; 9: 19-24
Publisher – GoogleScholar
29. Knight JA, Anderson S, Rawle JM. Chemical Basis of the Sulfo-phospho-vanillin Reaction for Estimating Total Serum Lipids. Clin Chem 1972; 18: 199-202
GoogleScholar
30. Vatassery GT, Sheridan MA, Krezowski AM, Divine AS, Bach HL. Use of the sulfo-phospo-vanillin reaction in a routine method for determining total lipids in human cerebrospinal fluid. Clin Biochem 1981; 14: 21.
Publisher – GoogleScholar
31. MacMahon S, Begley TH, Diachenko GW. Analysis of processing contaminants in edible oils. Liquid chromatography-tandem mass spectrometry method for the direct detection of 3-monochloropropanediol and 2-monochloropropanediol diesters. J Agric Food Chem 2013; 61(20):4748-57.
Publisher – GoogleScholar
32. Cheng YS, Zheng Y, VanderGheynst JS. Rapid quantitative analysis of lipids using a colorimetric method in a microplate format. Lipids 2011; 46: 95.
Publisher – GoogleScholar
33. Pal D, Khozin-Goldberg I, Cohen Z, Boussiba S. The effect of light, salinity and nitrogen availability on lipid production by Nannochloropsis sp. Appl Microbiol Biotechnol 2011; 90: 1429-1441.
Publisher – GoogleScholar