Introduction
Starting from the first forms of manifestation of the fraud mentioned by Beattie (2011) in his work (the first fraudulent act was recorded over 2300 years ago and was committed by a Greek merchant named Hegestratos) and continuing with a series of historical benchmarks concerning the great financial scandals presented by Singleton et al. (2010) (Manhattan 1626, South Sea Bubble 1717-1720, Meyer versus Sfeton 1817, Charles Ponzi and U.S. Postal Service 1920, Samuel Insull 1920-1929, Kreuger & Toll 1929, Securities Exchange Act 1934, Watergate 1970, Enron – WorldCom-Arthur Andersen 2000-2002, Bernard Madoff and Lehman Brothers 2008), a problem has been posed to identify the determining factors as well as the development, prevention, and detection mechanisms of financial fraud.
Gallet (2010) presents in his work a series of attempts to identify the dimensions and determining factors of fraud by listing the studies of renowned experts in the field (Donald Cressey 1919-1987, Dr. Steve Albrecht 1980, Richard C. Hollinger – John P. Clark 1983 and Joseph T. Wells). All these approaches are however more oriented towards the behavior of the person who commits the fraud (attitude, reasoning, pressures, the work environment, personality) and less towards the identification and description of financial behaviors specific to frauded companies. The appearance of European or American auditing standards (ISA – International Standards on Auditing issued by IFAC – International Federation of Accountants and USGAAS – United States Generally Accepted Auditing Standards that contain the SAS – Statements on Auditing Standards issued by AICPA – American Institute of Certified Public Accountants) brings into light a new approach of financial fraud and classifies it into frauds on assets (misappropriation of assets) and frauds on the accounting statements, thus pointing out two financial dimensions of fraud. A third component characterizes corruption and belongs to the ACFE (the Association of Certified Fraud Examiners), contributing to completing the approaches and interpretations provided by ISA or USGAAS.
This study aims to perform an empirical analysis of the problem of identifying the components and dimensions of financial fraud. The positivist approach resorts to a quantitative analysis by using advanced statistical methods (the principal components analysis, the discriminant analysis, and the logistic regression analysis) in order to validate the work hypotheses and to obtain the research results.
Conceptual Approaches of Financial Fraud
Based on auditing standards, ISA 240 (The Auditor’s Responsibilities Relating to Fraud in an Audit of Financial Statements) defines fraud as an intentional act performed by one or several managing individuals, upon persons responsible for governance, employees, or third parties, involving the use of deceit in order to obtain an unfair or illegal advantage (IFAC, 2009). Moreover, SAS 99 (Consideration of Fraud in a Financial Statement Audit) brings a series of explanations concerning the distinction between fraud and error from the perspective of the intention of the person who commits it, in order to steal assets or to resort to fraudulent financial reporting (Bragg, 2010). It is important to mention that the definition provided by the auditing standards is completed by yet another dimension that refers to corruption actions, mentioned by ACFE so that the schemas of manifestation of financial fraud also follow conflicts of interests, giving and receiving undeserved benefits (Singleton et al., 2010).
In what concerns the determining factors, Cressey’s study (1953) brings another perspective on the triggers of fraud, by presenting a fraud triangle, determined by the opportunities that lie at the basis of committing these acts, the pressures or motivating factors that have determined their occurrence, as well as the reasoning and attitude of the person committing the fraud. Gallet (2010) sees these opportunities as coming from those who know the detailed knowledge of the company environment, of the information system, and of the control mechanisms, and who has a series of technical skills. The pressures that lead to the appearance of fraud come from the direction of empowering persons who cannot prove their ability to efficiently manage essential fields/systems in the company (for example: bank accounts, cash and cash equivalents), from a series of personal failures, from mistaking the company’s wealth for the personal wealth, from the physical and psychological isolation of the person who commits the fraud, from the desire to improve their personal status by resorting to such actions, as well as from the relationships between employee and employer when the employees consider that they are not sufficiently remunerated in compensation to their effort (Gallet, 2010). Last but not least, the factor related to attitude or reasoning concerns the individualist behavior of the fraud committer (characterized by the term of independent businessman, and who considers that the company belongs to them) as well as the justification of their actions (misappropriation in order to cover other illicit actions or isolated short-term misappropriations justified by the fact that the committer will never be caught) (Gallet, 2010).
In order to prevent, detect, and investigate fraud, it is necessary to know and understand the development mechanisms of the various fraud schemes. A series of dichotomist classifications performed by Singleton et al. (2010) present fraud as intentional and malicious activities performed on customers or investors, of a civil or criminal nature, on or for the company, from within it or from outside, by managers or non-managers.
Of the category of fraud committed by managers, financial statement frauds cause the highest amount of losses at the company level and aim to distort the financial truth in order to obtain certain advantages or to hide the possible losses or negative performance (Rezaee et al., 2010). The main schemes that follow fraud on financial statements concern the inappropriate acknowledgement of income, the over-evaluation of assets, the under-evaluation of expenses and debts, misappropriation of assets, and inappropriate reporting (Rezaee at al., 2010).
At the ACFE level, we can all remember the classification of fraud into a fraud tree including three main categories:fraudulent statement, asset misappropriation and corruption. Fraudulent statement fraud concerns financial and non-financial statements (internal documents), asset misappropriation refers to fraud committed on cash or cash equivalents as well as on stocks or goods, such as inventory items, and corruption is classified into: Conflicts of interest, Bribery, Illegal gratuities and Economic extortion (Singleton et al., 2006).
From Financial Auditing to Fraud Auditing
According to ISA 240 (IFAC, 2009), the main objective of the financial auditor is to express an objective, professional, and independent opinion concerning the financial statements, and not to identify/detect financial fraud. However, the standard states that, during their mission, the auditor must also ensure the fact that the risk of fraud (the presence of illegal actions) will not significantly influence their opinion and implicitly the quality of their mission (IFAC 2009). But the need to prevent, detect, and fight financial fraud has been compensated by the appearance of legislative acts, among which the Sarbanes-Oxley Act 2002 (SOX) that imposes the organization of an auditing committee at the company level subject to auditing, establishing and promoting a code of ethics, ensuring and implementing a functional internal control system, organizing and institutionalizing internal audit (Silverstone et al. 2005).
At the profession level, a series of such mutations has also occurred, so that recently we can speak of the presence of fraud auditors, members of ACFE, who aim to create an environment that would encourage the detection, prevention, and correction of fraudulent actions (Singleton et al., 2010). Besides knowing and understanding legal texts concerning the fight against economic criminal actions, the fraud auditor needs a series of knowledge and abilities related to: the main fraud schemes, the triggering factors, and the profiles of those who commit such acts, corresponding red flags, obtained through financial analysis, accounting and auditing standards, the way of implementing an efficient control system, and information systems.
Fraud detection and the recognition of its manifestations imply the acquisition of flags that would help the auditor obtain the best answers regarding the presence or absence of financial fraud. These signal elements are called red flags and can be financial or non-financial, and the methods through which they are obtained vary from simple questionnaires to complex analyses of the financial statements. These indicators can be structural red flags and concern a series of indicators related to the hierarchy of the responsibilities within the company, or can be a characteristic of the personnel red flags and concern the monitoring and evaluation of the employees, operational red flags, which identify those elements that signal fraud associated with the operational activity, accounting system red flags that concern the internal control system and signaling the unbalances in the accounting statements. Others are financial performance red flags and identifying the unrealistic or distorted results or professional service red flags, which identify the causes that have determined replacing an auditor, a consultant or expert in the accounting field (Coenen, 2009).
Once these red flags have been identified, it is possible to formulate and implement a series of fraud prevention and detection programs. Therefore, the development of an appropriate prevention environment within the audited company, characterized by the adoption of the good practices of corporate governance (the existence of a code of ethics and setting realistic strategic objectives at the company level), complying with the fraud detection mechanisms (continuous monitoring, unexpected auditing missions, punishing the guilty) and deploying the best prevention methods (backgroundchecks, regular auditing missions, interval verifications) significantly contribute to reducing these criminal acts (Singleton et al., 2010).
In what concerns the financial fraud detection mechanisms, they must take into account: the weaknesses present within the governance program adopted by the audited companies, the lack of an auditing committee or its inefficiency, the inappropriate performance of interval checks, unrealistic forecasts of the managers concerning future financial results, the accumulation of strategic decisions in the hands of a single person or of a limited group that is difficult to control, the aggressive attitude of managers in the financial communication, unusual results recorded by the company, disproportionate in comparison with the average of the operational field to which it belongs, the existence of unusual transactions and, last but not least, the analysis of the causes that have lead to the possible conflicts with the auditors (Rezaee at al., 2010). Moreover, according to certain fraud schemes, the detection mechanisms can become more specific and certain tests can be detailed in order to obtain proofs that will indicate the presence or absence of fraud.
In the case of fraud auditing, Gallet (2010) suggests an entire approach, structured in the following stages, combined in an anti-fraud program: reuniting the project team, establishing an anti-fraud policy, identifying and evaluating risks (establishing possible targets that may be subject to fraud, identifying threats, suggesting scenarios concerning the occurrence of fraud, testing and evaluating these scenarios), integrating the prevention and detection devices, developing a monitoring process (the continuous verification of the manner in which the program works, periodically retesting the scenarios, analyzing the disfunctions of the program), and the terminus of the mission aims at obtaining a diagnosis concerning the presence of the risk of fraud.
Research Methodology
The purpose of the present study is to identify the main financial factors that determine fraud in a company, having a particularly important role in the prevention and detection of these actions. Moreover, starting from the current level of knowledge presented in specialized literature, a series of work hypotheses will gain support and will be validated through the empiric results obtain and that, using a deductive-inductive reasoning will help reaching the research objectives. The positivist approach implies using quantitative methods of data analysis at the level of the studied sample (Smith, 2003).
The Current Knowledge Level: is represented by the research in the field that has been concerned, among other things, with the history of fraud, in the study of Lenard et al. (2008), and the role of the accounting profession (in a broad sense: accounting experts, financial analysis, auditors and fraud auditors) in fraud prevention and detection in the studies of Bernardi (2009) and Jayalakshmy et al.(2005). At the same time, a collection of papers has been concerned with the analysis of the main methods of fraud prevention and detection, in the studies performed by Bierstaker et al., (2006) and Wang et al. (2009). A particularly important part in the development of the research in the field has been played by the studies oriented towards the analytical procedures and on the financial impact in signaling fraud, and the paper of Kaminski et al. (2004) is illuminating in this respect. The analysis of the risk of fraud has made the object of several studies detailed among others in the article suggested by Payne et al. (2005). We can also mention a series of materials on famous international frauds, dealt with in the work of Barlaup et al. (2009), Vinten (2008).
The Work Hypotheses: have been formulated starting from the definition of fraud, according to ISA 240 and SAS 99, as well as from the financial nature of the red flags used in signaling financial fraud. Therefore, we aim to test and validate the following formulated work hypotheses
- Hypothesis 1: A series of economical-financial indicators (consecrated financial ratios) suggested for analysis can be synthesized into two latent variables (components, factors), that explain to a significant degree the occurrence of financial fraud. Thus, we aim to identify these influencing factors.
- Hypothesis 2: To predictive purposes, it is possible to obtain score functions that would classify companies into frauded and unfrauded, based on the identified components/factors, in order to determine the existence of the risk of fraud. Thus, we aim to determine the coefficients of these functions.
- Hypothesis 3: Based on the components/factors identified, it is possible to obtain a function for determining the probability of occurrence of fraud in the analyzed sample for predictive purposes. Thus, we aim to estimate the coefficients of this function of determining the probability of occurrence of the risk of fraud.
The Data Analysis Methods: used in the study are specific to financial analysis (the ratios technique) as well as to statistics. Therefore, in order to obtain financial ratios, the financial statements of the companies in the studied sample have been analyzed, and the main statistical methods of data analysis used are the principal components analysis – PCA, the discriminant analysis – DA and the logistic regression analysis – LRA.
The principal components analysis (PCA) is a multi-varied descriptive method introduced for the first time by Karl Pearson in 1901 and integrated in 1933 by Harold Hotelling in mathematical statistics. The practical usage of this method is recent due to the current information tools (Lebart et al., 2006). The main purpose of this method is to summarize the analyzed data as much as possible, with minimum losses, in order to facilitate the interpretation of a large number of initial data, as well as to give an exact meaning of the synthesized data. The basic principle of this method consists in reducing the number of analyzed variables (Larouse, 2006). PCA allows reducing complex databases (that contain a large number of variables), by replacing them with 2-3 latent variables, eliminating collinearity and at the same time facilitating analysis. Considering a multitude of initial variables, Xi (i=1…n), the new variables are determined (factors orcomponents), having the form:
Cj (j=1…m), where Cj = bj1X1 + bj2X2 + … + bjnXn, and m≤n.
In PCA, the principal components determined through the linear combination of the initial variables are independent from one another.
The hypothesis of the independence of the principal components can be validated through several tests, among which: the test statistics χ2 (to test the existence of a connection between the variables) and KMO statistics (Kaiser-Meyer-Olkin, to determine the intensity of this connection). KMO statistics can take values in the interval [0,1]. KMO values under the threshold of 0.5 indicate insignificant connections, values between 0.5 and 0.6 indicate the existence of medium connections, values between 0.6 and 0.7 indicate connections of an acceptable intensity, values between 0.7 and 0.8 indicate the existence of good connections, KMO values higher than the threshold of 0.8 indicate the presence of very good connections, and values over 0.9 indicate that the solution obtained after applying PCA is excellent (Lebart et al., 2006). The estimation of the components can be achieved using a statistic software. The correlations between the initial variables and the principal components can be graphically represented using the “correlation circle”. The principal components are represented on the factorial axes, graded from -1 to +1. Zero shows that there is no connection. The initial variables are represented in coordinate points defined by the correlation coefficients between the initial variables and the principal components.
The discriminant analysis (DA) is a multi-varied classification method that aims to classify a population into predefined groups. This classification is based on score functions (Z) that express the relations between the numeric or nominal variables, Xi, specific to the studied population, and the categories of classification variables. This method was initially suggested by Fisher in 1936, in order to differentiate between individuals belonging to the same species, according to a series of specific characteristics. In practice, DA is very often used, being also known as the credit-score method or the Forecast method of the risk of bankruptcy (the Altman model, the Conan model). The DA method concerns the estimation of the relation between a category dependent variable (dichotomic or multi-chotomic) and linear combinations of several metric independent variables, having the form:
Z = α0 + α1X1 + α2X2 + … + αnXn,
where Z is the score associated to each individual: Xi with (i=1,…,n) are the independent variables and αi are the coefficients of the model (unknown). In the opinion of Lebart et al. (2006), the approach of the discriminant analysis presupposes: building the discriminant functions (resulted from the linear combination of the independent variables that will discriminate the categories of the dependent variable), establishing the independent variables that contribute the most to explaining the differences between the groups, classifying the cases by assigning them to a specific group (to predictive purposes, starting from the values of the independent variables of each individual replaced in the score functions) and evaluating the accuracy of the classification.
In order to determine the probability of occurrence of the risk of fraud, the logistic regression analysis (LRA) will be applied. It uses regression models with dependent alternative variables, of the form:
Y = β0 + β1C1 + β2C2 + ε,
where Y = 0 in case there is no risk of fraud and Y = 1 in case this risk exists, and Ci represents the independent variables (factors/components identified through PCA), βi the coefficients of the logistic regression model, with i = 1;2 and ε is the error component. Moreover, since Y is a Bernoulli variable (Gujarati, 2004) it associates to the values one and zero the following probabilities of occurrence: p for Y = 1 and q for Y = 0. LRA starts from the idea that the conditioned average, M(Yi/Ci) = pi is based on a logistic distribution:
M(Yi/Ci) = pfraud = 1/[1+e^-(β0+βiCi)] = 1/(1+e^-zi).
After applying the reverse function, there will be a result that zi = ln[pi/(1-pi)], and the logistic model will be defined by the relation Li = ln[pfraud/(1-pfraud)] = β0+β1C1+ β2C2 + εi (Gujarati, 2004).
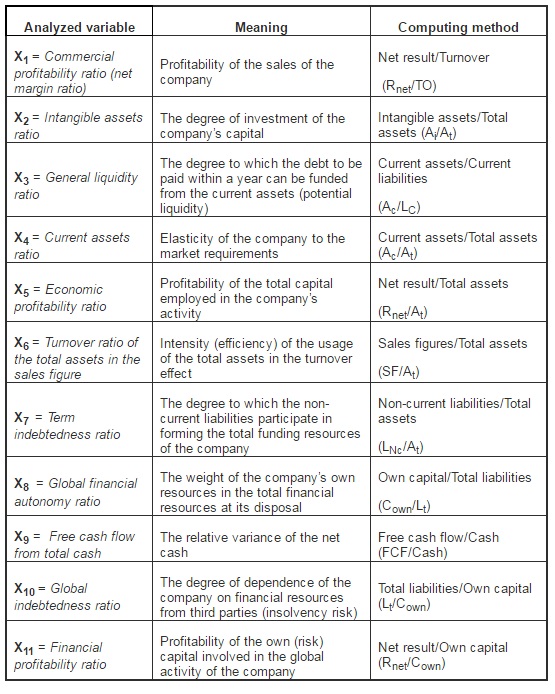
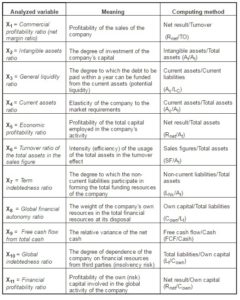
Analyzed Variables: in the present study, we have suggested for analysis a series of independent variables (financial ratios that describe both the structure of the company assets and the level of the recorded performance care), synthesized in Table 1.
Table 1: Independent Variables Used in the Study
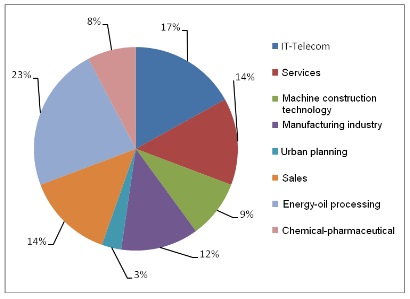
Target Population and Sample: the target population is represented by companies quoted in the New York Stock Exchange (NYSE), NASDAQ, the London Stock Exchange (LSE), the Paris Stock Exchange, and the Milan Stock Exchange. The selected sample includes 30 frauded companies (famous cases at the international level, between 1998 and 2008) and 35 unfrauded companies (in 2008 they were in the top of the most profitable companies worldwide). The structure of the analyzed sample according to the operational field is illustrated in Figure 1.
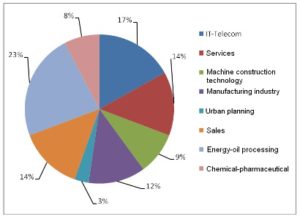
Fig 1. Structure of the Analyzed Sample into Activity Fields
Data collection: the data have been collected from the financial statements of the analyzed companies presented on the Web sites of the Stock Exchanges mentioned above. Therefore, for the frauded companies, the financial statements corresponding to the fiscal year in which the fraud was discovered and reported have been analyzed, and for the unfrauded companies, the financial statements for the fiscal year 2008. The data was processed using the SPSS 19.0 statistic software.
Research Results and Discussions
The application of PCA on the 11 variables initially introduced into the analysis (Xi, i = 1,…, 11) has lead to the identification and estimation of the principal components that determine the occurrence of fraud, for the analyzed sample. For choosing the number of factorial axes and components will take account of the corresponding Eigenvalues higher than one (Kaiser’s criterion, 1960). According to Figure 2, after analyzing, the data will choose two main components.
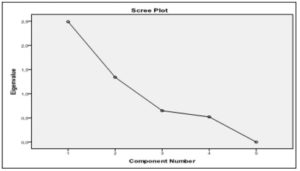
Fig 2. Graphical Representation of the Eigenvalues for the Two Selected Components
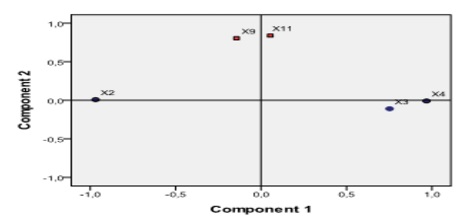
Based on information obtained from the diagram shown in the figure above, we can estimate that the variance explained by the two components identified, combined, is 76.624% of the total variance of the cloud points (the graphical representation of the values of variables analyzed). The diagram obtained in SPSS 19.0 (Figure 3) plots the two main components and their influence on each variable. The graphical representation of the components is possible only in case their number is higher than or equal to two.
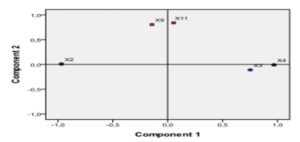
Fig 3. Contribution of the Initial Variables to Obtaining the Principal Components
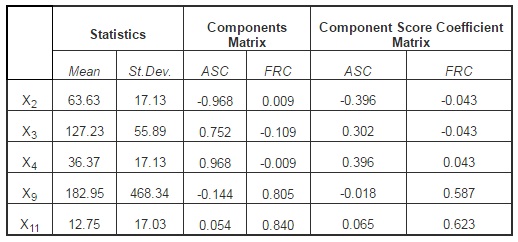
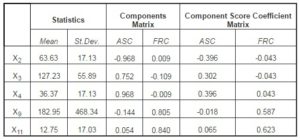
For the analyzed sample, we can notice the existence of two main financial-accounting components that determine the occurrence of financial fraud. The first component is significantly influenced by the level of X2 = (Ai/At), X3 = (Ac/Lc) and X4 = (Ac/At). These indicators characterize the structure of the assets as well as the manner in which the current assets will manage to cover the short-term debts (reducing the insolvency risk), and the name we will give to the newly obtained latent variable will be the Assets structure component (ASC). The second component is significantly influenced by the indicators X9 = (FCF/Cash) and X11 = (Rnet/Cown) that describe the economic-financial results obtained by the company, and the newly obtained latent variable characterizes the Financial reporting component (FRC). This component explains the occurrence of fraud through financial statements that follow to distort and hide the truth in financial statements. Influence of variables on each principal components extracted is presented in Table 2. Values close to +/- 1 of the values of components matrix indicate a strong positive or negative influence, and values tend to zero indicate the absence of any connection.
Table 2: Descriptive Statistics and Component Matrix
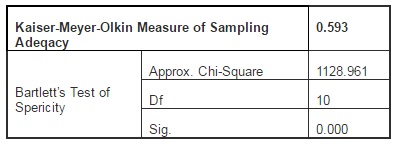
The value of the test statistics used to test the independence of the components, KMO, is 0.593, indicating the existence of a significant connection between the initial variables that have been included in the structure of the principal components resulted, according to data presented in Table 3. The results indicate that the assumption of the independence of variables is acceptable for a Sig. = 0.000 lower than the significance level of 0.05.
Table 3: KMO Statistics and Bartlett’s Test
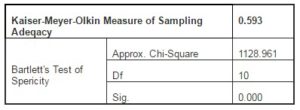
Therefore, we can say that the dimensions (factors) that determine fraud significantly explain the occurrence and manifestation of this phenomenon, from an accounting perspective.
Based on the information obtained from Table 2, section Component Score Coefficient Matrix, components can be determined as a linear combination of financial indicators introduced into the analysis. Thus, after applying the PCA, we will get two equations for the two components:
ASC = -0.396X2 +0.302X3 +0.396X4 -0.018X9 +0.065X11, and FRC = -0.043X2 -0.043X3 +0.043X4 +0.587X9+0.623X11.
Moreover, we can notice that at the ASC level, the relation between the value of the floating assets and that of the intangible assets is inversely proportional in what concerns their influence on the obtained component. We can draw the conclusion that the presence of liquidity predisposes the company to the occurrence of frauds because of the ease with which they can be misappropriated, compared to the case of intangible assets (their misappropriation is much more difficult to achieve and is more related to reporting, through the overestimation of amortizations).
Based on the principal components obtained using PCA (ASC and FRC), we will estimate the coefficients of the score function by introducing them into discriminant analysis, using as a classification criterion of the presence or absence of financial fraud for the studied cases in the selected sample. The main advantage of the discriminating functions consists in subsequent classifications of companies that are not included in the working sample, to predictive purposes.
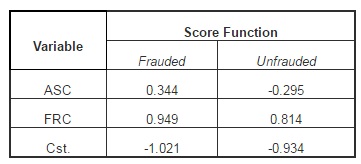
Table 4: Classification Function Coefficients
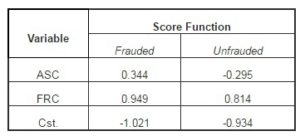
The rule for using these classification functions is the following: to be within each function resulted from the linear combination of the products between the analyzed variables and the associated coefficients, to be according to the results presented in Table 4, replacing them with the values of the indicators extracted from the financial statements of an unclassified company, we will obtain two sets of scores. The two scores (for the function corresponding to the frauded companies and that for the unfrauded companies) will be compared with one another, and the maximum value of the score corresponding to a function will also dictate the belonging to the respective classification group (existence of fraud or non-existence of this risk). At an empirical level, the two classification functions will be presented as:
Scorefrauded = 0.344ASC -0.949FRC -1.021 and Scoreunfrauded = -0.295ASC +0.814FRC -0.934.
Moreover, the value of the coefficients in the model also signals the importance of a component in making the discrimination. The module values of the associated coefficients indicate the importance of a component in making the discrimination. Moreover, we can notice that the CFR factor is determining in indicating the occurrence of financial fraud. The reverse relation between the two components (given by the sign of the coefficients in the model) indicates that a company subject to the risk of fraud cannot simultaneously present the two fraud types mentioned.
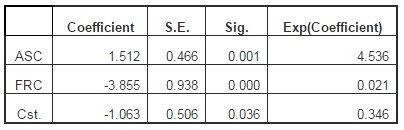
In case of using LRA, the results obtained in SPSS aim to estimate the parameters of the function for determining the probability of occurrence of the risk of fraud for a company, according to the scores of the fraud components, of a financial-accounting nature (ASC and FRC). The results of LRA are summarized in Table 5.
Table 5: Probability Function Coefficients
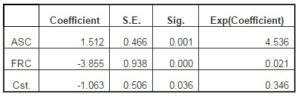
The resulting model will have the next form:
ln[pfrauded/(1-pfrauded)] = -1.063 +1.512ASC -3.855FRC.
Since the interpretation of this equation is rather difficult to achieve (the increase of ASC by one unit will trigger an increase in the logarithm applied to the ratio of the opportunities between the two states by 1.512), we will use the exponential value of these coefficients. Therefore, an increase of ASC by one unit (determined by the influence of the financial indicators considered in PCA) will determine a ratio between the cases of companies that present the risk of fraud and the companies that do not present this risk of 4.536 = exp(1.512). In the case of FRC, the increase by one unit of this component, determined by the influence of the financial indicators considered in PCA, will determine a ratio between the cases of companies that present the risk of fraud and the companies that do not present this risk of 0.021 = exp(-3.855). In this respect, we can notice that the variances of the values of ASC are much more sensitive in what concerns the probability of occurrence of fraud (misappropriation/disappearance of a single item may indicate the presence of fraud), compared to the variations of FRC (where the distorted presentation of specific information in the accounting statements can be considered either as caused by fraud or by recording errors).
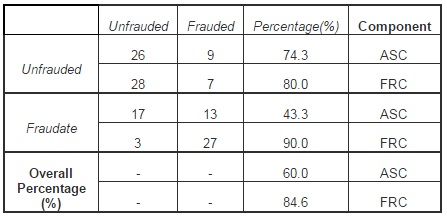
The accuracy of each component in terms of identifying financial fraud is shown in Table 6. Thus, ASC has an accuracy of 74.3% regarding the identification of unfrauded companies and of only 43.3% in identifying frauded companies (a low degree). According to the obtained results, we can conclude that this component is a perfect indicator in monitoring the functionality of the company’s activity in case the presence of the risk of fraud is not signaled. In the case of FRC, we can notice that the accuracy of the component in what concerns the identification of the unfrauded companies is 80% and 90% in identifying the cases subject to fraud.
Table 6: The Probabilities of Components in Identifying Fraud
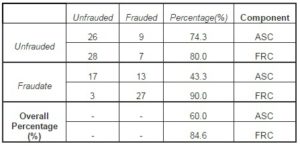
Comparing these two component, we can draw the conclusion that by using the financial indicators that significantly influence FRC (the ratios based on result and cash flows), as auditing procedures in the identification and proving the existence of financial fraud must come before the ratios that describe the structure and destination of the resources (intangible or current). According to research results, the financial ratios obtained on the basis of profits and cash flows are particularly important in financial fraud signaling. Regarding the nature of fraud, the ratios that significantly influence the FRC component would indicate, with predilection, the reporting fraud, and the ratios that significantly influence the ASC component would signal the presence of assets fraud (embezzlement).
Conclusions
The three work hypotheses suggested in this study have been validated through the empirical results obtained, which has lead to the fulfillment of the research objectives. Therefore, we have identified the factors that determine fraud by synthesizing the two financial components that characterize the misappropriation of assets and fraudulent statement, we have obtained the score functions for classifying companies into frauded and unfrauded and we have estimated the function parameters for determining the probability of occurrence of the risk of fraud in a company, based on the identified latent variables (ASC and FRC).
If the studies that supported this research considered only the psychological dimensions that determine the occurrence of the risk of fraud, the present research has attempted a completion of these approaches. Therefore, we have stressed and quantified new financial dimensions of fraud, internal to the company, correlated to its position and financial performance. The usefulness of this study comes first of all from the possibility to apply the current work methodology, as well as the classification functions and those for determining the probability of occurrence of fraud, as analytical procedures used to obtain auditing evidence, within financial or fraud auditing. On this basis, the auditor will be able to make sure that the audited company is not predisposed to the risk of fraud, or that the presence of fraud will not have any significant impact on the auditing opinion in the final report.
Future development directions of the study are aimed at enlarging the sample of analyzed companies, focusing on specific activity objects, and determining dimensions/components characteristic for each individual sector, refining the data analysis methods and the work tool. Last but not least, according to the individual needs and the economic context specific to each company, the presented models can be improved and individualized so as to provide the best insurance possible concerning the presence or absence of fraud in the company.
The importance of this topic and of the results comes from the promotion of a work methodology in order to determine the dimensions of fraud and to evaluate its associated risk, which may support the successful prevention and detection of these disastrous actions.
Acknowledgements
This work was supported by the European Social Fund in Romania, under the responsibility of the Managing Authority for the Sectorial Operational Program for Human Resources Development 2007-2013 [grant POSDRU/CPP 107/DMI 1.5/S/78342].
(adsbygoogle = window.adsbygoogle || []).push({});
References
Barlaup, K., Dronen, H. I. & Stuart, I. (2009). “Restoring Trust in Auditing: Ethical Discernment and Adelphia Scandal,” Managerial Auditing Journal, Vol. 24, No. 2, 183-203.
Publisher – Google Scholar
Beattie, A. (2011). “The Pioneers of Financial Fraud,” http://www.investopedia.com/articles/financial-theory/09/history-of-fraud.asp accessed on 05.04.2011.
Publisher
Bernardi, R. A. (2009). “Establishing a Baseline for Assessing the Frequency of Auditor’s Comments Concerning Perceived Client Integrity,” Managerial Auditing Journal, Vol. 24, No. 1, 4-21.
Publisher – Google Scholar
Bierstaker, J. L., Brody, R. & Pacini, C. (2006). “Accountants’ Perceptions Regarding Fraud Detection and Prevention Methods,” Managerial Auditing Journal, Vol. 21, No. 5, 520-535.
Publisher – Google Scholar – British Library Direct
Bragg, S. M. (2010).’Practitioner’s Guide to GAAS 2010 Including all SASs, SSAEs, SSARSs, and Interpretations,’ John Wiley & Sons, New Jersey.
Coenen, T. L. (2009). Expert Fraud Investigation: A Step-by-Step Guide, John Wiley & Sons, New Jersey.
Publisher – Google Scholar
Cressey, D. R. (1953). ‘Other People’s Money: A Study in the Social Psychology of Embezzlement,’ Glencoe, 1II: Free Press.
Google Scholar
Gallet, O. (2010). Halte aux Fraudes. Guide pour Auditeurs et Dirigeants, 2e édition, Dunod, Paris.
Google Scholar
Gujarati, D. (2004). Basic Econometrics, the McGraw-Hill Companies, New York.
Google Scholar
International Federation of Accountants (IFAC) (2009). International Standards on Auditing.
Jayalasksmy, R., Seetharaman, A. & Khong, T. W. (2005). “The Changing Role of the Auditors,” Managerial Auditing Journal, Vol. 20, No. 3, 249-271.
Publisher – Google Scholar
Kaminski, K. A., Wetzel, T. S. & Guan, L. (2004). “Can Financial Ratios Detect Fraudulent Financial Reporting?,” Managerial Auditing Journal, Vol. 19, No. 1, 15-28.
Publisher – Google Scholar – British Library Direct
Larose, D. (2006). Data Mining Methods and Models, John Wiley & Sons, New Jersey.
Publisher – Google Scholar
Lebart, L., Piron, M. & Morineau, A. (2006). Statistique Exploratoire Multidimensionnelle. Visualisation et Inférences en Fouille de Données, 4e édition, Dunod, Paris.
Google Scholar
Lenard, M. J. & Alam, P. (2010). “A Historical Perspective on Fraud Detection: From Bankruptcy Models to Most Effective Indicators of Fraud in Recent Incidents,” Journal of Forensing & Investigative Accounting, Vol. 1, Issue 1, 1-27.
Publisher
Payne, E. A. & Ramsay, R. J. (2005). “Fraud Risk Assessments and Auditors’ Professional Skepticism,” Managerial Auditing Journal, Vol. 20, No. 3, 321-330.
Publisher – Google Scholar
Rezaee, Z. & Wiley, R. (2009). Financial Statement Fraud: Prevention and Detection, 2nd edition, John Wiley & Sons, New Jersey.
Publisher – Google Scholar
Singleton, T. W., Singleton, A. J., Bologna, J. & Lindquist, R. J. (2006). Fraud Auditing and Forensic Accounting, 3rd edition, John Wiley & Sons, New Jersey.
Publisher
Singleton, T. W. & Singleton, A. J. (2010). Fraud Auditing and Forensic Accounting, 4th edition, John Wiley & Sons, New Jersey.
Publisher – Google Scholar
Smith, M. (2003). Research Methods in Accounting, SAGE Publication, London.
Publisher – Google Scholar
Vinten, G. (2003). “Enronitis – Dispelling the Disease,” Managerial Auditing Journal, Vol. 18, No. 6/7, 448-455.
Publisher – Google Scholar – British Library Direct
Wang, J., Zhou, J. & Peng, B. (2009). “Weak Signal Detection Method Based on Duffing Oscillator,” Kybernetes, Vol. 38, No. 10, 1662-1668.
Publisher – Google Scholar