Techno-Economic Assessment of Renewable Hybrid Systems for Rural Electrification and Distributed Generation in Selected Sites across Nigeria

Ajayi, Oluseyi. O1, Ohijeagbon O.D2, Ajanaku, K.O3, Aasa, S.A1 and Omotosho, O.A1

1Mechanical Engineering Department, Covenant University, Ota, Nigeria

2Mechanical Engineering Department, University of Lagos, Akoka, Lagos, Nigeria

3Chemistry Department, Covenant University, Ota, Nigeria

Academic Editor: Dorel Ailenei

Cite this Article as:

Ajayi, Oluseyi. O, Ohijeagbon O.D, Ajanaku, K.O, Aasa, S.A and Omotosho, O. A. (2015), "Morphology of Sella Turcica in Skeletal Class II Subjects," Journal of African Research in Business & Technology, Vol. 2015 (2015), Article ID 124767, DOI: 10.5171/2015.124767

Copyright © 2015. Ajayi, Oluseyi. O, Ohijeagbon O.D, Ajanaku, K.O, Aasa, S.A and Omotosho, O. A. Distributed under Creative Commons CC-BY 4.0

Abstract

The study considered the potentials and economic feasibility of solar and wind energy resources for rural-electricity and distributed generation from six selected sites of Nigeria. Remote communities cut off from the central grid and made up of 200 homes, a school and health centre were conceived – a site per geopolitical zone was investigated. A specific electrical load profile was then developed to suite the rural communities. In view of this, the design that will optimally meet a daily load demand with 1% LOLP was carried out by considering standalone PV, Wind and Diesel systems design, as well as a Wind-PV hybrid system design. Further to this, an analysis covering the same sites was carried out to determine the commercial viability of generating and distributing electricity in the Megawatt range via distributed generation. The 24 years’ (1987-2010) solar, wind and other meteorological data utilized in this study was obtained from the Nigeria meteorological centre, Oshodi. The results of the study revealed that wind standalone system is the most economically viable substitute for power generation at most of the sites with costs ranged between $0.129/kWh and $0.327/kWh for Jos and Benin City respectively. More so, a huge potential for profit making by willing investors in line with the present tariff order for wind and PV distributed generation was discovered with all sites being viable on both configuration. The optimum LCOE for distributed generation ranged between -$0.021/kWh and -$0.158/kWh for PV distributed generation in Iseyin and Maiduguri respectively. This is very much competitive with grid electricity. Thus, renewable electricity could be adopted and included into the federal rural development strategy, thereby reducing the energy deficit being experienced in Nigeria.

Keywords: Photovoltaic Power; Wind power; Solar-Wind Hybrid; Distributed Generation; Cost per kWh; Clean Energy; Nigeria

Introduction

Access to modern energy supply is requisite to sustainable development. However, a population of about 1.3 billion people worldwide are deprived of access to electricity and over 2.6 billion people worldwide rely on traditional biomass for cooking and heating. More so, between 2011 and 2013, access to sustainable electricity generation remained static in growth rate. Although, some countries like those of the Latin America and certain Asia made great leaps forward, other regions fell largely behind, with India regressing in the number of people with access to electricity by 17 million. Half of the world’s population without access to electricity reside on the African continent (Renewables Global Status Report, 2014)

In most remote communities of developing nations, connection to the central electric grid is usually prohibitive due to its non-economic viability. Moreover, the major use of energy in these rural communities is for heating and cooking purposes. Such energy resources are derived from repeated biomass burning. The byproducts of such burning have been found to be deleterious to both humans and the environment. Based on this, renewable energy systems (RES) present an exceptional prospect to hasten the transition from deleterious biomass based energy supply to modern energy services in remote and rural areas. It has the potential of escalating access to sustainable energy for cooking and heating, inexpensive lighting, communications, food preservation, improved public health, and also for agro-processing and other productive activities.


The conventional electrical power system model in use in Nigeria involves a system that mainly revolves around centrally generated electrical power and a massive system of transmission and distribution networks. Albeit, this system has been in use for many decades and the shortcomings associated with these model has led to economic volatility as well as diverse threats to public health (Walker, 2008; Wustenhagen, et al 2007; Rogers et al, 2008; Bayod-Rujula, 2009; Clark & Eisenberg, 2008). Moreover, the conventional systems are decrepit and outmoded, ineffective, and regularly strained, resulting in high utility fee variations payable by the general public (Ipakchi and Albuyeh, 2009; Mamo et al , 2009). Thus, to gradually shift emphasis from centrally generated electricity that operate on deleterious fossil based generation systems to RES, there would be the need to establish and strengthen institutional, financial, legal, and regulatory support mechanisms for renewable energy deployment must. Once established, these mechanisms will help improve access to financing, growth in necessary infrastructure, and increased awareness about renewable energy.


Some of these mechanisms have been put in place in Nigeria. One notable policy thrust, is the positive feed-in tariff law on wind and solar electricity enabling. It enables consumers deliver additional green energy to a mini-grid network at prices higher than that of network electricity (Ohijeagbon and Ajayi, 2015). The regulation describes a form of generation where excess renewable energy generated by a consumer above the 1 MW mark may be sold to a nearby mini-grid system at prices higher than grid electricity. These feed-in tariffs are captured under provisions for embedded (distributed) generation as presented in the multi-year tariff order for 2012-2017(Nigerian Electricity Regulatory Commission, 2012; Overview of the NERC regulations, 2012). Therefore, willing investors may take advantage of this regulation in order to provide cheap access to electricity at rural communities and also help to meet the Millennium Development Goals (MDGs) while also sustaining themselves as profitable ventures through proceeds from sales to a mini-grid in proximity of the rural communities.

Therefore, this study offers a design approach that will establish the potentials and economic feasibility of solar and wind resources for rural-electricity and distributed generation for six selected sites of Nigeria. A site per geopolitical zone was considered. Rural communities unconnected to the national grid and made up of 200 homes, a school and health centre were considered. A specific electrical load profile was then developed to suite the rural communities. Further to this, an analysis covering the same sites was carried out to determine the commercial feasibility of generating and distributing electricity in the Megawatt range via distributed generation.

Potential of Renewable Energy Resources in Nigeria

A number of indigenous researchers have studied the potential of Renewable Energy (RE) resources in Nigeria in view of demonstrating their viability in the country. Onyebuchi (1989) projected the technical potential of solar energy in Nigeria by means of a device with 5% conversion efficiency. The study concluded that 15.0”‰×”‰1014”‰kJ of useful energy can be generated annually. Chineke et al. (2008) disclosed that Nigeria receives copious supply of solar energy that can be valuably harvested. The yearly average daily solar radiation was evaluated to 5.25”‰kWh/m2-day, with specific values ranged between 3.5”‰kW h/m2-day, in the coastal regions of the south and 7.0”‰kWh/m2-day at the northern boundaries. Mean duration of sunshine hours within the country was estimated at 6.5”‰hours with yearly average solar energy intensity being 1,935”‰kWh per m2 per year, which approximately equals 1,770 TWh of solar energy retrievable on a yearly basis. This is roughly equivalent to a multiple of 120,000 of the total annual average electrical energy produced by the Power Holding Company of Nigeria (PHCN) prior to privatization (UNDP, 2012). It is therefore reasonable to integrate solar energy in the nation’s energy mix.


A number of research reports present the potentials for wind-to-electricity projects in Nigeria. For instance, Adekoya and Adewale (1992) looked into wind speed data of 30 stations in Nigeria and found the annual mean wind speeds and power flux densities to fluctuate between 1.5 – 4.1”‰m/s and 5.7 – 22.5”‰W/m2 respectively. Fagbenle and Karayiannis (1994) also studied the 10-year wind data from 1979 to 1988 taking into cognizance surface and higher winds as well as upper limit of guts. Ajayi (2010) hinted that inland, the wind is superlative in mountainous regions of the North, while moorland topographies of the middle belt and northern precincts of the nation have enormous prospect for massive wind energy production. Mean wind speeds in the north and south were revealed to lie between 4.0 − 7.5 m/s and 3.0 − 3.5 m/s respectively at 10 m height. In view of the above, most researchers concluded that wind energy is principally of excelent abundance in core northern states, the hilly and mountainous parts of the central and eastern states, and also the country’s offshore areas (Adekoya et al, 1992; Ajayi, 2010; Fagbenle, et al, 2011; Ajayi et al, 2011; Ajayi et al, 2010).


These information points to the fact that, Nigeria is richly endowed with huge natural supply of solar and wind energy resources and has good prospect for improved sustainable electricity production. Nonetheless, the energy need of the populace in remote areas is still centered on traditional biomass (Ajayi et al, 2010) because this group of fuels have been discovered to supply more than 50% of total energy usage in Nigeria (National Energy Policy, 2003). In furtherance to this, the disparity in fuel wood supply and demand in many remote locations is now a threat to the energy security of these communities (Kanase-Patil et al, 2010; Rajoriya, 2010; Setiawan et al, 2009; Akella et al, 2007; Promoting Renewable Energy, 2007) due to the present degree of deforestation. It is a fact that Nigeria  parades one of the poorest annual per capita consumption of electricity worldwide, which is estimated to fall between 100 kWh and 135 kWh (Ajayi and Ajayi, 2013) with a sizeable proportion of her population still unconnected to the national electricity grid (Ajayi,  2010). Hence, a diversification of the nation’s energy mix is cogent if the country is to achieve its target of energy security by the year 2020. This is with the clear understanding that RE resources has the advantage of being employed as a standalone facility besides its potential for grid connectivity.

Present Work

In Nigeria, only a few research studies subsist depicting the prospect of hybrid RE system for power generation (Nwosu et al, 2012; Mbakwe et al, 2011; Abatcha et al,

 
2011; Agajelu et al, 2013). These were also only focused on small scale generation for remote telecom applications and also for individual buildings. Research studies on the design and economic viability of hybrid systems that can provide sustainable power for remote communities are uncommon. More so, those that capture distributed generation analyeis for potentially viable sites in Nigeria are very rare. Part of these includes the study by Ohijeagbon & Ajayi (2014). It focused the prospect and economic viability of standalone hybrid systems for rural community utilization and distributed generation at a site in North-west Nigeria. The results revealed that distributed generation was viable for wind and PV systems rated above 7.5MW in Sokoto. This study therefore focused on the techno-economic assessment of hybrid RE for rural electrification and distributed generation in six selected sites across the geopolitical zones of Nigeria. The sites are spread across the country.

Methodology and Data Collection

Data Collection

The twenty-four years (1987 — 2010) daily global solar radiation, daily wind speed data,  sunshine hours, minimum and maximum air temperature, and minimum and maximum relative humidity that were employed for this research were supplied by the Nigeria Meteorological agency (NIMET), Oshodi, Lagos, Nigeria. The solar radiation data employed for a few of the sites were consequent upon the model proposed by (Ajayi et al, 2014). This was as a result of inadequate data for some sites. The location parameters of the selected sites are as presented in Table 1. Wind turbines ranging from two to four 25 kW turbines, with single 3MW turbines in series were optimally designed for community utilization and distributed generation respectively. The cumulative solar panels employed ranged between 105 kW & 190 kW for community utilization with optimal solar arrays ranged between 25MW — 35MW for distributed generation. A diesel generator of 35 kW was utilized for the study covering conventional power systems for the communities. An econometric analysis of the diesel system is presented in Table 2.

RETScreen® software was used as a feasibility tool. This software receives average air temperature and relative humidity, which is significant, owing to the dependence of PV module efficiency on close by air temperature and relative humidity (RETScreen 4 Software, 2013; Omubo-Pepple  et al, 2013; Skoplaki et al, 2009; Fesharaki, 2011). Also, most cell types show evidence of a reduction in efficiency as their temperature rises, while an increase in relative humidity has been found to act in such a way as to diminish the magnitude of solar radiation retrievable (Hedzlin et al, 2009; Ettah et al, 2012; Hussein et al, 2013).

Table 1: Location Parameter of the Studied Sites (Ajayi Et Al., 2014)
124767-tab-1

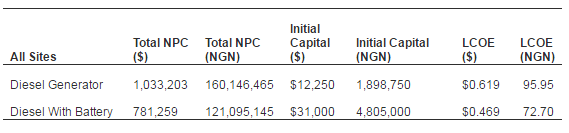
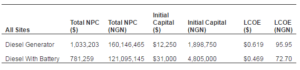
Table 2: Diesel System Econometrics for Nigeria (Rural Community Utilization)

(Ajayi Et Al., 2014)

124767-tab-2

Load Calculation

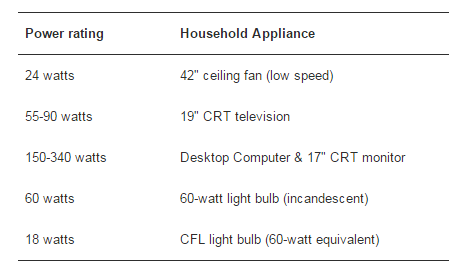
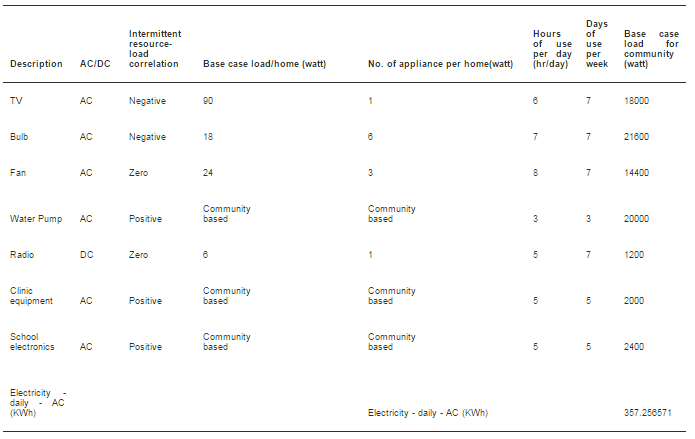
Load profiles for rural and remote communities should not be merely assumed, but must be well analyzed. Notwithstanding, they have been discovered to be a far below those of urban communities. A number of researchers discovered that characteristically on the average, 1 kWh/day per home is required in rural community homes (Clean Energy Project, 2005; Lambert et al, 2006). Nonetheless, for the intention of this study, the energy demand requirement of the rural communities were developed based on individual power rating of each appliance generally utilized in each home as presented in Table 3 and 4 (General Wattage Chart, 2013; How much electricity, 2013; RETScreen 4 Software, 2013; Ohijeagbon and Ajayi, 2014; Ajayi et al., 2014)). Consequently, each home is estimated to consume as 1.4kWh/day, based on the analysis of Tables 3 and 4, with a calculated primary peak load value of 46 kW. Fig. 1 presents the 24 hours hourly load profile for the communities.

Table 3: General Wattage Chart for Some Household Appliances

(Ohijeagbon and Ajayi, 2014; Ajayi Et Al., 2014)

124767-tab-3

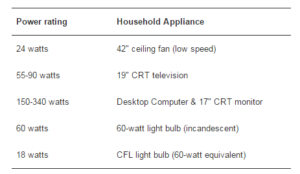
Table 4: Electricity Consumption Analysis for a Rural Community of 200 Homes 
(Ohijeagbon and Ajayi, 2014; Ajayi Et Al., 2014)

124767-tab-4

124767-fig-1

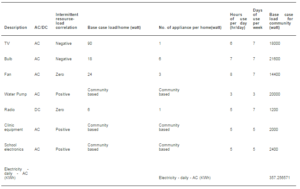
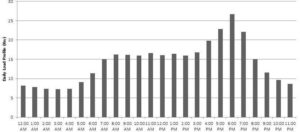
Fig 1: Average Daily Load Profile Used for Design of Hybrid Energy Systems in Rural Areas of Nigeria

(Ohijeagbon and Ajayi, 2014; Ajayi Et Al., 2014)

Modeling the Photovoltaic (PV) Project

Description of the Solar Radiation Algorithm

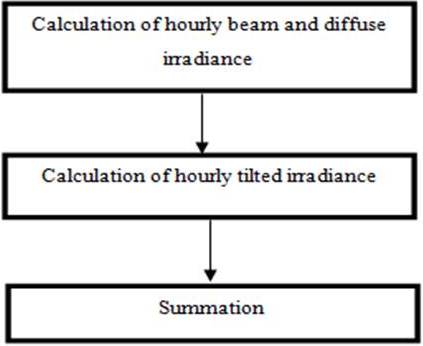
The solar radiation algorithm utilized is described as a progression of three basic

steps presented in the figure below (see Figure 2) (Ohijeagbon and Ajayi, 2014; Ajayi et al., 2014):

124767-fig-2

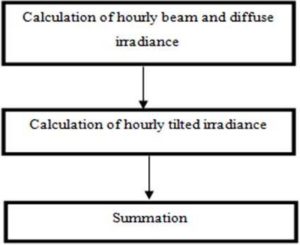
Figure 2: Flowchart for Tilted Irradiance Calculation

Calculation of Hourly Global and Diffuse Irradiance

Solar radiation can be considered to be of two parts: beam radiation, and diffuse radiation. Therefore, the tilting algorithm utilized, uses the knowledge of beam and diffuse radiation for every hour of an average day.

PV Array Model

The model created by Evans served as the PV array model (Evans, 1981).

Modeling the Wind Speed Distribution

Wind Energy Model

Since weibull probability density function (WPDF) has been found to significantly fit with experimental long-term distribution for various sites (Ajayi et al, 2011), the wind speed profile characterization and analysis for each site was carried out using the WPDF.

Cost Benefit Analysis

Economics plays a critical role in selecting potential energy sources. Renewable and non-renewable energy sources have proven to be very diverse in cost characteristics. Renewable sources are usually higher in initial capital costs and low in operating costs, while conventional non-renewable sources usually tend to be vice-versa. The life-cycle cost (or NPC) analysis consists of, costs of initial construction, component replacements, maintenance, fuel, cost of buying power from the grid, and miscellaneous costs. On the other hand, revenues include, income retrieved from sales to the grid, in addition to any salvage value occurring at the end of the project lifetime. When evaluating the NPC, costs are taken as positive and revenues are seen as negative. Therefore, a negative NPC value signifies a net present value (NPV).

The annualized cost for each component is made up of, the capital, replacement, maintenance, and fuel costs, as well as salvage value and other costs or revenues. Further to this, the annualized costs are summed for each component, plus any miscellaneous costs, thus resulting in the total annualized cost of the system.

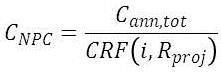
The total net present cost is:

124767-for-1  1

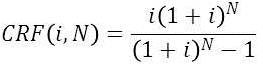
where Cann,tot= total annualized cost, the project lifetime, and CRF( â‹…) is the capital recovery factor, given by the equation:

124767-for-22

where, i, is the annual real interest rate (the discount rate) and N is the number of years.

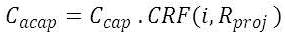
The annualized capital cost of each component is evaluated as follows:

124767-for-33

where: Ccap = initial capital cost of the component

To determine the annualized replacement cost of a system component, the salvage value at the end of the project lifetime is subtracted from the annualized value of all replacement costs that occurred throughout the lifetime. It is noteworthy that the annualized replacement cost may be negative since it includes the annualized salvage value.

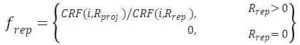
Each component’s annualized replacement cost is evaluated as follows:

124767-for-44

124767-for-15 is a factor that takes into account the fact that the component lifetime can be different from the project lifetime:

124767-for-55

124767-for-16the duration of replacement cost, is given by:
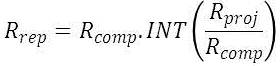
124767-for-66

Where, INT ( ) is the integer function, that returns the integer part of a real value.

The salvage value S of each component is given by:

124767-for-77

124767-for-17 is the remaining life of the component at the end of the project lifetime:
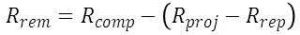
124767-for-88

124767-for-18= replacement cost of the component. 

SFF ( ) = sinking fund factor        

124767-for-19 = lifetime of the component                   

The sinking fund factor is a ratio used to calculate the future value of a series of equal annual cash flows and it is given as;
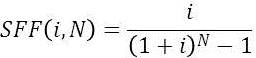
124767-for-99

The total O&M cost is a sum that comprises of: the system fixed O&M cost, any penalty for capacity shortage and penalty for emissions (if any).

The total annual O&M cost is given as:

124767-for-1010

where:

124767-for-20= system fixed O&M cost ($/yr)

124767-for-21= the penalty for capacity shortage ($/yr)

124767-for-22= the penalty for emissions ($/yr)

The capacity shortage is calculated using the following equation:

124767-for-1111

where:

124767-for-21= capacity shortage penalty ($/kWh)

124767-for-23= total capacity shortage (kWh/yr)

Therefore, the total annualized cost is:

124767-for-1212

Where124767-for-24 =annual project revenue ($/yr)

The levelised cost of energy (LCOE) is therefore:

124767-for-1313

Where,124767-for-25is the total annualized cost,124767-for-26 and 124767-for-27are the total amounts of primary and deferrable load, respectively, that the system serves per year, and 124767-for-28 is the amount of energy sold to the grid per year.

Specifications of Wind Turbines and Solar Panel Used in this Study

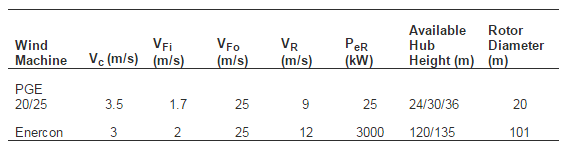
PGE turbines (HOMER Software, 2013) were cumulatively utilized for this research to study the wind standalone system (WSS), each having the specification indicated in Table 6, while the Enercon turbine is employed for edistributed generation.

It is noteworthy that when revenues from the project far surpasses other incurred costs, i.e. 124767-for-25 (the annual operating cost of the project), and the summation of 124767-for-29. It results in a negative total annualized cost, that reflects in a negative LCOE which is termed levelised value of energy (LVOE) (Ohijeagbon & Ajayi, 2015); which reveals the profitability of the project from an investors’ stance. Hence,

124767-for-14

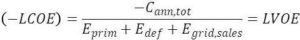
Table 6: Turbine Specification (Ajayi et al., 2014)

124767-tab-5

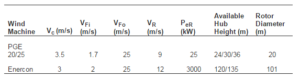
where: Vc = cut-in wind speed, VFi = low wind cut-out speed, VFo = high wind cut-out speed, VR = rated wind speed, PeR = rated power at rated wind speed.

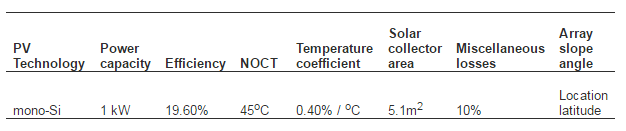
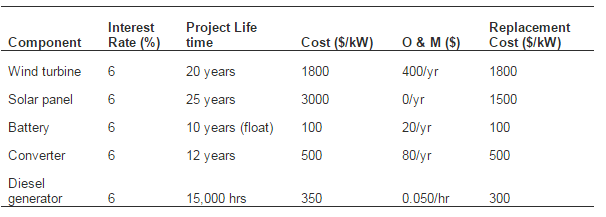
Table 7 presents the solar panel specification used in this research with a collector area of 5.1 m2 rated at 1 kW by Sunpower. Consequently,  in order to match the load demand, the solar collector area increases while other parameters in Table 7 remained constant (RETScreen 4 Software, 2013). Table 8 presents each components’ cost with their installation costs embedded used in designing the Hybrid Energy Systems (HES).

Table 7: PV System Specification (Ajayi Et Al., 2014)

124767-tab-6

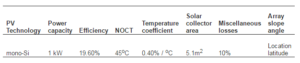
Table 8: Cost of Components Used in the Design of HES (Installation Cost Embedded in Component Cost) 
(Ajayi et al., 2014)

124767-tab-7

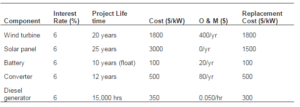
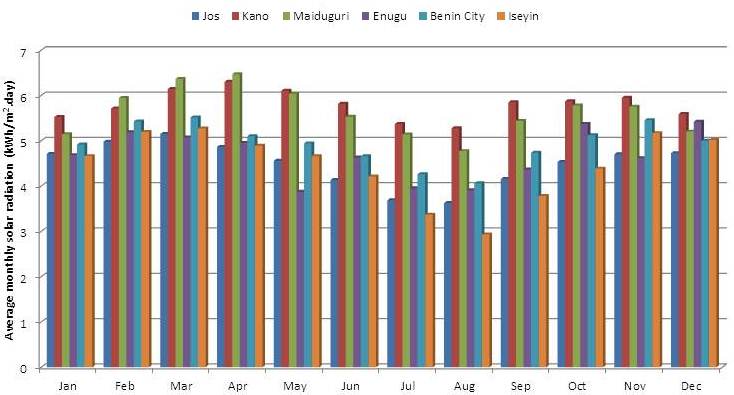
Fig. 3 shows the average monthly solar radiation profiles for a period spanning between 1987 and 2010. The figure reveals that the 24 years monthly average solar radiation varied between 2.93 (kWh/m²/d) in August for Iseyin (SW) and 6.468(kWh/m²/d) in April for Maiduguri (NE). More so, the period between July and August experienced the lowest solar radiation across the sites/states. Looking through the analyzed data, Maiduguri and Kano were found to be the sites/states with the superior solar profiles.

124767-fig-3

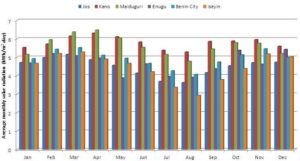
Fig 3: 24- Year Monthly Average Radiation (Kwh/M²-Day) for Sites in Nigeria

Fig. 4 reveals the average yearly solar radiation profiles for the period covering 1987 and 2010. Maiduguri (NE) is observed to have the highest yearly average radiation in 1997, while Enugu (SE) had the lowest in 2004. It was also discovered that the monthly solar data varied much more than the yearly solar radiation data. Further to this, Fig. 4 shows that the solar radiation profiles for all sites in Nigeria can be grouped broadly in two, namely; Northern Nigeria and Southern Nigeria, with very related characteristics within each group. The similarity in characteristics is a result of similar weather and climatic conditions within the same geographical region.

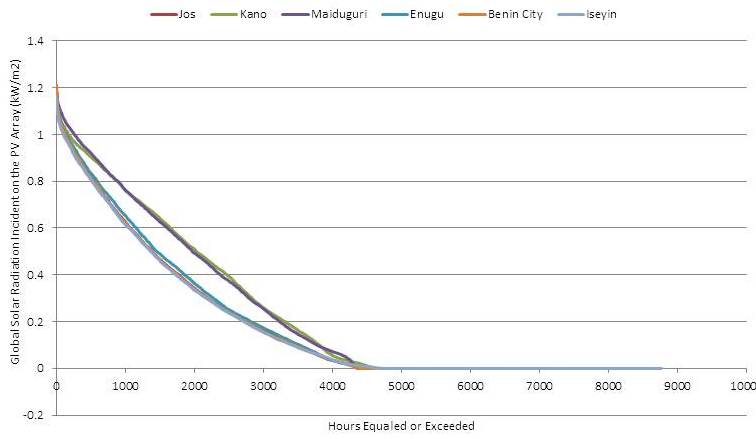
 Taking into consideration the hours equaled or exceeded for a series of mean measured solar radiation (Fig. 5) across the studied period, the study revealed that the corresponding power generated for each site from the designed PV array is between about 49.2% – 51.1% of the hourly duration in a whole year. This however is due to solar radiation occurring only at daytime, unlike wind speed. Hence, Iseyin has a twenty four year average sunshine daily duration of about 5.46 hours, while Jos has 7.33 hours.

124767-fig-4

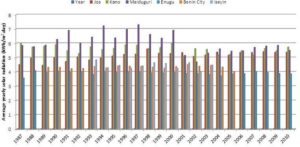
Fig 4: 24- Year Yearly Average Radiation (kWh/m²-day) for Sites in Nigeria

124767-fig-5

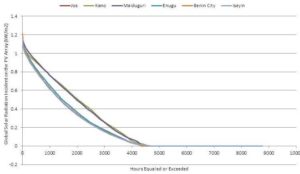
Fig. 5:  Plot of 24 Years’ Annual Average Hours Equaled or Exceeded for Nigeria

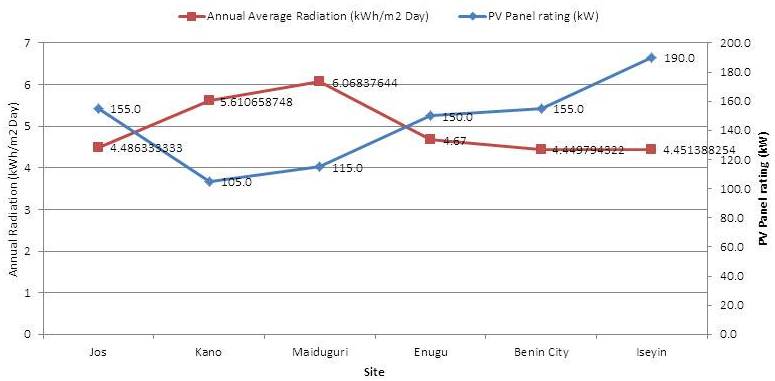
Fig. 6 correlates the annual average solar radiation and PV module size for the 6 sites studied. Upon analysis, it was found that a good correlation subsists between incident irradiation and PV size. This relationship was observed to be inverse in proportionality between the two quantities, with the PV requirement growing with decline in solar radiation intensity. This can be attributed to the prevailing weight of daily global solar radiation on the sizing of photovoltaic systems. Fig. 6 also reveals an average 24 years annual solar radiation that ranged between Iseyin (SW) – 4.45 (kWh/m².day) and Maiduguri (NE) – 6.07 (kWh/m².day) with a matching PV rating of 190 kW and 115 kW respectively.

124767-fig-6

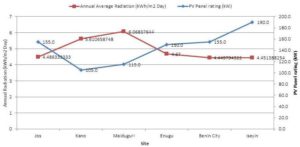
Fig 6: Correlation between the Monthly Average Solar Radiation and Solar Panel Size for Nigeria

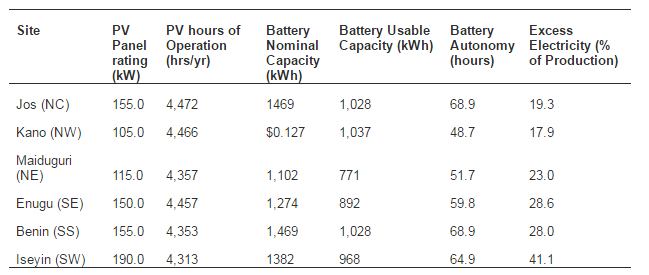
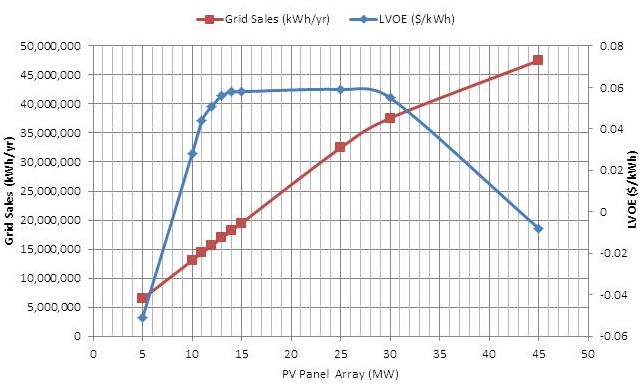
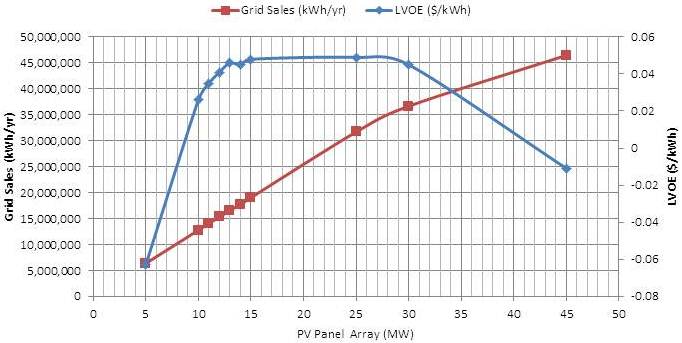
From Table 9, considering the most cost effective PV standalone system design having a Loss of Load Probability (LOLP) of 0.01 (Hontoria et al, 2005; Shen, 2009; Khatib et al, 2013), produced an average excess electricity corresponding to 26.3% of annual generation. The reason for this excess however, is due to a reduction in daily hours of sunshine during the rainy season period, when average sunshine duration ranges between 3 and 4 hours in the north and 1 to 2 hours in the south. Consequently, a design that will cater for a load profile of 200 rural homes must necessarily include a realistic battery charging requirement to account for the days of limited solar radiation. Hence, the battery days of autonomy ranged between 48.7 hours for NW and 68.9 hours for SS at a 50%  initial state of charge, which was chosen in order to extend battery life (Hund et al, 2010; Hund, 2009; Hunt, 2009; Overview of the NERC regulations, 2012; Multi-Year Tariff Order, 2011; Branker et al, 2011; Lorenz et al, 2008). However, this unequivocally gives rise to an excess in energy generated annually when the period of higher sunshine duration is balanced with those of lower duration over an entire year. This excess can easily be harnessed in the form of generation known as embedded generation, which is defined as a form of generation where excess renewable energy generated by a consumer above 1 MW may be sold to a nearby distribution network (Overview of the NERC regulations, 2012; Multi-Year Tariff Order, 2011). This sales to the grid have the advantage of reducing the LCOE, as revealed by equation 13. It is also noteworthy that the excess may not be sold to the grid at all times, as it will be wasted when lower than 1 MW, if the optimum battery capacity by design could not take care of this excess. The battery specification employed in the study is presented in table 9. It reveals the optimized rated capacity (or nominal capacity) of the battery, which is the amount of energy that could be pulled out from it at a particular constant current, starting from a fully charged state.

Table 9: Technical Requirements Employed for the PV Standalone System Design

 
124767-tab-8
The life cycle cost (NPC), which captures all the cost all through the operational life (25 years) of the system is presented in Fig. 7. Firstly, a project life of 25 years was specified in the analysis due to the average life span of solar panels. However, including replacement cost for each component within the analysis, makes design setup project beyond the required twenty five years’ module lifetime. Hence, this makes the design setup more affordable  for higher operational life cycle periods, and since each component cost is expected to reduce over the years, the LCOE is projected to further decline. This study reveals that the influence of solar panel on the total NPC is approximately 52% for the Kano site, 73.4% for Maiduguri, 51% for Enugu, 54% for Benin, 75% for Iseyin, and 53% for Jos. The residual costs are then borne by the battery and converter’s initial, maintenance and replacement costs. With the recent rate of decline in prices of solar panels (Branker et al, 2011; Lorenz et al, 2008; Renewable Power Generation Costs, 2012), their influence on life cycle cost is projected to progressively decline, thus making PV systems much more competitive with grid electricity. Fig. 7 presents a comparison between total NPC and initial capital cost, and it reveals a similar pattern for both costs. However, this similarity is due to the use of the same technology by all sites, though the initial costs are less than NPC for each site.
124767-fig-7

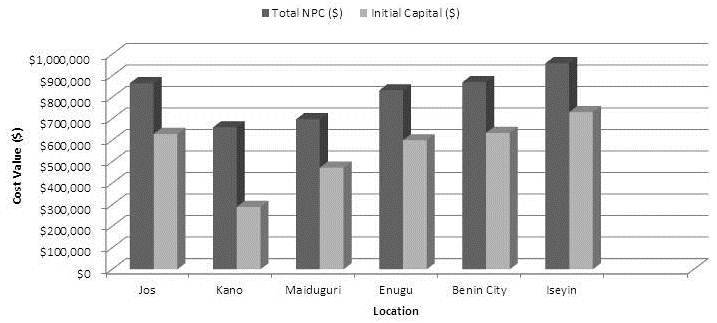
Fig 7: Comparison between Net Present Cost (NPC) and Initial Capital for PV Standalone System

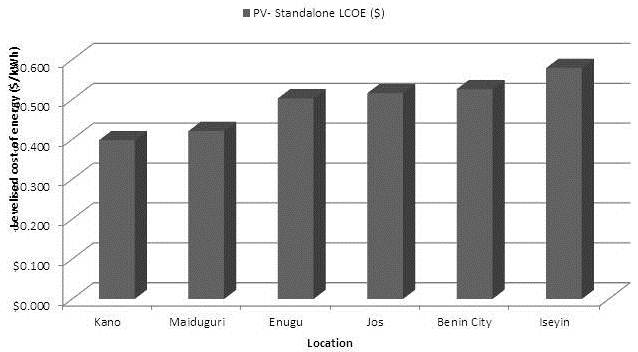
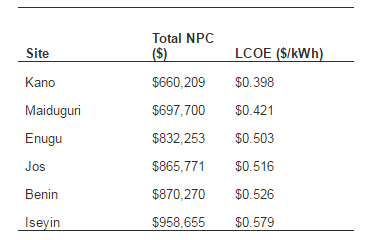
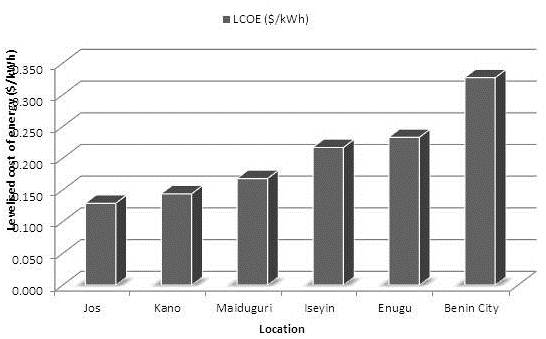
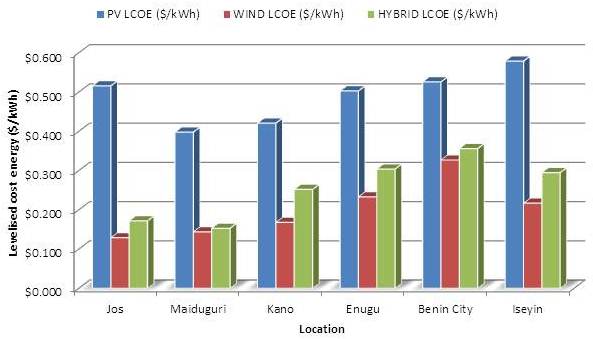
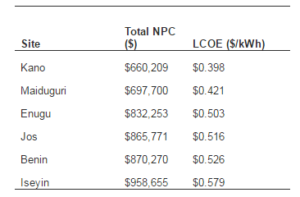
An econometric ranking for all studied sites is presented in Table 10. The PV economics reveals that the LCOE is directly proportional to total NPC for all sites. More so, Fig. 8 shows the most excellent location in Nigeria by LCOE. It reveals that Iseyin is the poorest in terms of LCOE at $0.579/kWh and Kano is the finest with $0.398/kWh. Hence, the use of PV standalone systems equates to savings of 7.1% and 56% respectively on an equivalent DSS that will cover the same load for this communities, with the added advantage of savings in 279 tons of CO2 green house gas emissions (GHG).

124767-fig-8

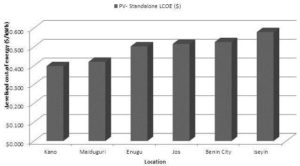
Fig 8: LCOE for PV Standalone System


Table 10: Total NPC and LCOE Values for the PV Standalone System Design

124767-tab-9

Prospect of Standalone Wind-To-Electricity Project in the Sites

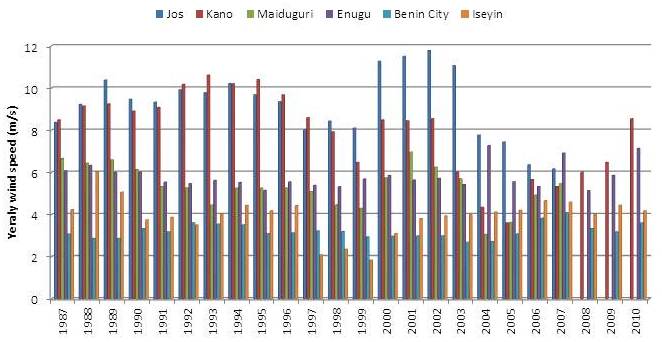
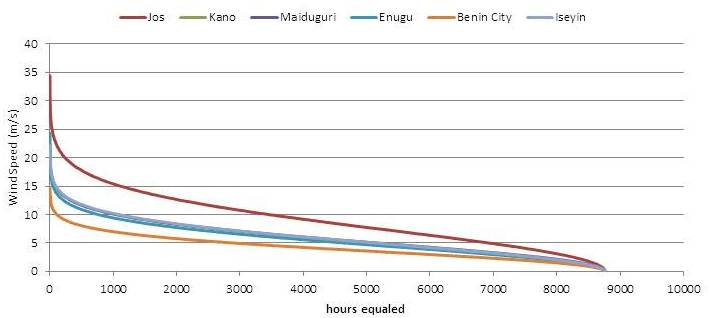
The results of wind profile analysis at the site are as shown in Figs. 9 and 10. A few of the sites have missing wind speed values for 2 to 3 years (2008-2010). Fig. 9 shows the average monthly wind speed profiles for a period spanning between 1987 and 2010. The figure reveals that the 24 years monthly wind speed varied between 3.476 (m/s) in November for Benin City (SS) and 10.062 (m/s) in December for Jos (NC). Fig. 10 reveals the average yearly wind speed profiles for the period covering 1987 and 2010. Jos  (NC) is observed to have the highest yearly average wind speed – 11.783 m/s in 1993, while Iseyin (SW) had the lowest – 1.842 m/s  in 1999. Moreover, the hours equaled or exceeded for a range of mean measured wind speeds across the period (Fig. 11) revealed that 67.2% of the data spread are values above 3.0 m/s for the poorest site in terms of wind profile, and 91.9% for the best wind profile in Jos. This discovery proves that majority of the sites are well-suited to contemporary wind turbines, since recent wind turbines for power generation have a cut-in speed of 3 m/s. Therefore, this reveals that wind power can be harnessed throughout the year with corresponding higher returns on investment.

124767-fig-9

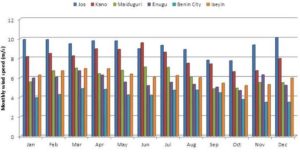
Fig. 9:  Plot of 24 Years’ Monthly Average Wind Speeds

124767-fig-10

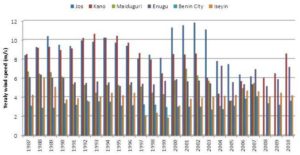
Fig. 10:  Plot of 24 Years’ Annual Average Wind Speeds

124767-fig-11

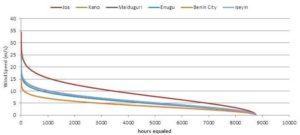
Fig. 11:  Plot of 24 Years’ Annual Average Hours Equaled or Exceeded for Different Wind Speeds

124767-fig-12

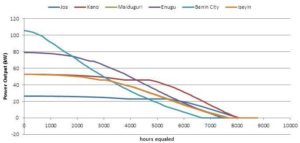
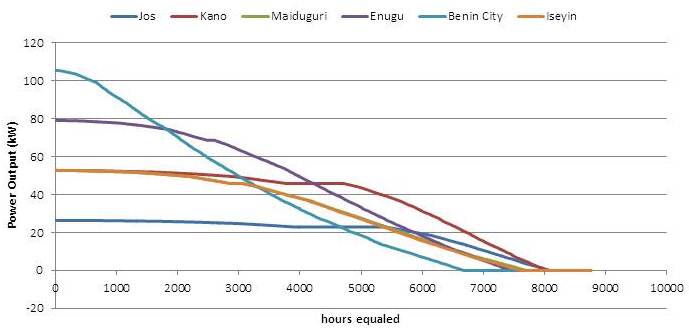
Fig. 12:  Plot of 24 Years’ Annual Average PGE 2025 Power Output Duration Curve (kW)

The hours equaled for power generated for each site from their respective turbine sizing based on particular wind speed profiles is presented in Fig. 12. The SS requires the highest turbine size of 100 kW, thereby generating more excess power than any other site, howbeit, for a very short period as it only generates power for equal or less than about 68% of the time. On the other hand, a site like Kano in the NW is sized at 50 kW because of a very favorable wind profile that makes this site consistently generate for 90% of the hourly duration in a year. As a result, Table 11 reveals that Benin city has the peak battery capacity requirement, which is to balance for approximately a third of the yearly hourly duration without turbine production.

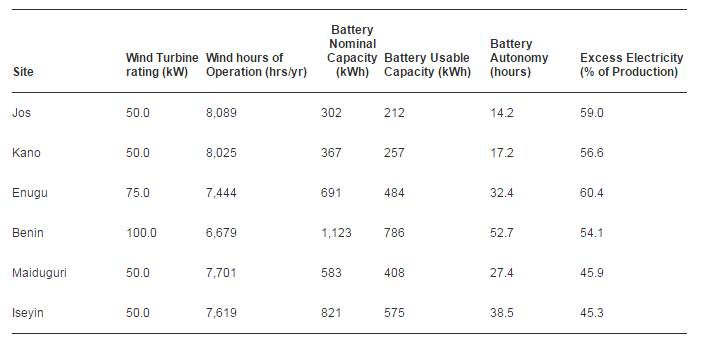
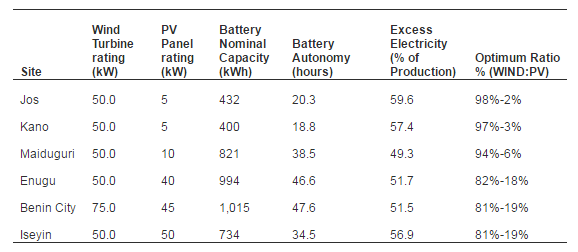
Table 11: Technical Requirements and Correlation of Electricity Consumed as a Percentage of Wind Standalone Production

124767-tab-10

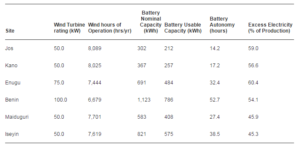
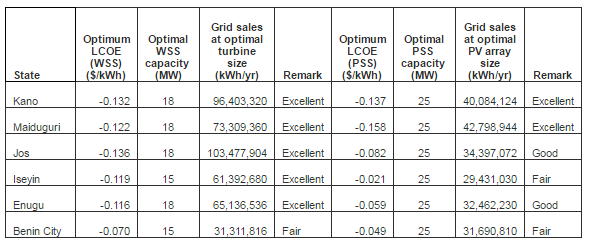
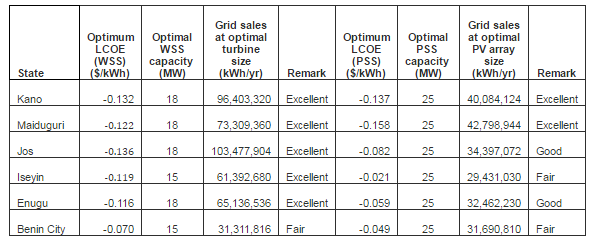
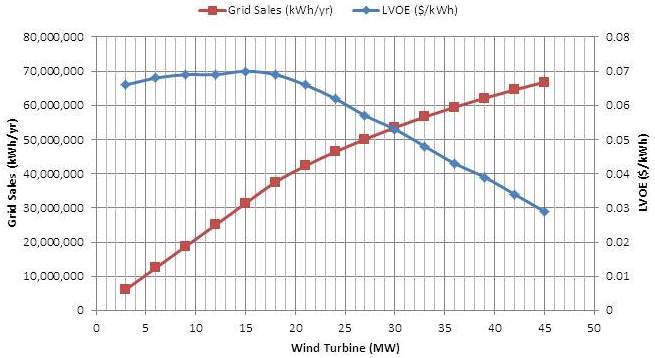
Table 11 reveals an average excess electricity equivalent to 54% of annual generation across all sites because wind power is generated on average, for about 80% of the time within the studied sites in Nigeria (see Fig. 11 & Table 11). This gives rise to wind energy generation over two-thirds of every hour of the day, thus, an average optimal battery size of 30.8 hours of autonomy suitably matches the load requirement. Also, it is revealed that for an average of about 24% of the annual hourly duration, the turbines can produce at the rated capacity since the rated speed for the PGE 20/25 turbines used in the design is 9 m/s (Fig. 11). This will certainly encourage good returns on investment and an opportunity for embedded generation (Overview of the NERC regulations, 2012; Multi-Year Tariff Order, 2011).  Fromtable 12, it is observed that Wind Standalone System (WSS) is in general, more cost efficient due to an average savings of 80% on battery requirement in comparison to PV Standalone System (PSS).

Table 12: Econometrics Analysis for Wind Standalone System

124767-tab-11


Table 12 shows the NPC of utilizing only WSS for power generation in each community, which reveals differential in NPC for all sites as a result of all sites having different wind speed profiles. This is because the wind energy resource is very close to the turbines’ rated speed at some locations, while others are a bit far off. Thus, those close in value to the turbines’ rated speed produced at the turbines’ rated speed for up to 47 % of the time in Jos, which has the best wind speed profile. Hence, this site required a lower capacity rated turbine of 50 kW in comparison to a site such as Benin city which required 100 kW to meet its load demand. After the analysis, the total NPC averaged 142% less for the WSS than that for the PSS when all sites were considered and the greatest differential of NPC by cost type was associated with capital cost.

124767-fig-13

Fig 13: Net Present Cost (NPC) Summary – Comparison between Wind Standalone Systems

Comparing the total NPC and LCOE for all sites as presented in table 12 reveals that the LCOE correlates for all sites with the NPC values. Hence, Fig. 13 comparatively ranks these sites by LCOE, with Benin city being the poorest at $0.327/kWh and Jos the best with $0.129/kWh. This values equates to 89.6% and 380% savings respectively on a comparable DSS applied to meet the same load requirement for these communities. This comes with an added advantage of an additional savings in 279 tons of CO2 greenhouse gas (GHG) emissions which is equivalent to planting 25 hectares of forest for CO2 absorption.

Evaluation of the Potential of Solar-Wind Hybrid System

The logical advantage of hybridizing renewable energy resources over each respective RE system is in the fact that the base load will be covered by the most copious and firmly available energy source, thereby sinking the technical requirements and the cost of the storage batteries. The economic costs of employing wind and PV systems, as standalone or in hybrid format are presented in Tables 13-15 and Fig. 14.

Table 13: Results of Econometrics Analysis for the Deployment of Solar-Wind Hybrid Technology 

(Ranking By Total NPC)

124767-tab-12

As revealed in tables 13 and 15, the total NPC and LCOE for solar-wind hybrid in the selected sites did not produce any considerable improvement in terms of LCOE for the hybrid system over the WSS, although it is advantageous over the PSS for all sites. Thence, the WSS proves to be the best RE generation system for all the sites, which can adequately cater for the energy needs of the rural poor. Table 14 reveals the optimum combination of hybrid systems for this study.

Table 14: Technical Requirements and Electricity Consumed As a Percentage of Wind-PV Hybrid Production

124767-tab-13

Table 15: LCOE for Different Energy Systems in Nigeria (Ranked By Hybrid System)

124767-tab-14

124767-fig-14

Fig 14: Net Present Cost (NPC) Summary – Comparison between Wind, PV and Hybrid Systems

Fig. 14 makes a comparison by LCOE for the WSS, PSS and hybrid energy system for all selected sites. Benin city was found to be the least viable site at $0.356/kWh and Kano, the most excellent with $0.153/kWh. This result equate to 74% and 305% savings respectively on a comparable DSS designed to meet the same load demand for this communities.

In addition, Table 15 reveals that the solar resource, though very much viable for all selected sites falls beneath the potential of wind energy. Nonetheless, all renewable technologies performed better than the conventional DSS without batteries for all sites. The percentage improvement ranged between 74% to 380% by LCOE.

In conclusion, for the analysis covering standalone community based designs, the most excellent renewable technology that fulfills all the technical requirements, in addition to being the most economically viable substitute for power generation at the rural community of 200 homes in Jos (NC), Maiduguri (NE), Kano (NW), Iseyin (SW), Enugu (SE), and Benin City (SS) is the wind standalone system. Also, with the government of Nigeria’s present reform of electric tariff regime with grid electricity prices rising (Owonubi et al, 2009; Overview of the NERC regulations, 2012), and also based on the fact that research is ongoing to lower the price of wind turbine materials and solar panels, the competitiveness of RE generation will be on the increase.

Econometrics of Distributed Generation

The Federal government has made available the very much needed favorable environment that encourages growth in renewable energy (RE) generation by producers and consumers alike (Ajayi, 2010) through distributed generation. Table 16 presents the results of econometrics analysis when RE resources of all six sites are utilized as standalone systems in the form of distributed (embedded) generation. 

Table 16: LCOE and Grid Sales on Distributed Generation for a 10-Year Project Life Span with the Present MYTO for Nigeria

124767-tab-15

The design adopted in Table 16 and Figs. 15 to 25, was such that all the sites utilized mono-crystalline solar panel ranging between 5 MW and 45 MW having the same specification as that in Table 7, while for the wind energy generation, the sites used different rated wind turbines in multiples of 3 MW, with Iseyin and Benin city yielding their optimum return on investment at a rated capacity of 15 MW, while the others produced optimal results when cumulative wind turbines of 18 MW were employed. Noteworthy is the fact that, although Jos optimally utilizes 18MW, same with Kano, Maiduguri and Enugu, it leads in terms of return on investments as a result of higher grid sales which is directly proportional to Jos being the city having the most favorable wind speed amongst all sites. It is important to note that, in order to meet up with the renewable national policy, an excess electricity of ³ 1 MW monthly average is required to activate sale to a distribution network. The analysis carried out using the present policy on renewable energy distributed generation spanned a ten year project lifespan in line with the National Electricity Regulatory Commission’s (NERC) 5-year plans (Multi-Year Tariff Order, 2011). As can be observed from Table 16 both technologies (PSS and WSS) yielded negative LCOE’s, which equates to profits per year for all the sites. This further shows the immense potentials and opportunities in the renewable energy sector in Nigeria.

Tables 17 and 18 presents the current reform of electric tariff regime ongoing in Nigeria by government in terms of growth rates of forecasted electricity prices for 2012-2017 (Multi-Year Tariff Order, 2011).

Table 17: Wholesale Feed-in-Tariff for Land Mounted Wind Power Plant

124767-tab-16

124767-fig-15

Fig 15: Techno-Economic Analysis Showing Grid Sales and LVOE for WSS Distributed Generation for Kano

124767-fig-16

Fig 16: Techno-Economic Analysis Showing Grid Sales and LVOE for PSS Distributed Generation for Kano

124767-fig-17

Fig 17: Techno-Economic Analysis Showing Grid Sales and LVOE for WSS Distributed Generation for Maiduguri

124767-fig-18


Fig 18: Techno-Economic Analysis Showing Grid Sales and LVOE for PSS Distributed Generation for Maiduguri

124767-fig-19

Fig 19: Techno-Economic Analysis Showing Grid Sales and LVOE for WSS Distributed Generation for Jos

124767-fig-20

Fig 20: Techno-Economic Analysis Showing Grid Sales and LVOE for PSS Distributed Generation for Jos


124767-fig-21

Fig 21: Techno-Economic Analysis Showing Grid Sales and LVOE for WSS Distributed Generation for Iseyin

124767-fig-22

Fig 22: Techno-Economic Analysis Showing Grid Sales and LVOE for PSS Distributed Generation for Iseyin

124767-fig-23


Fig 23: Techno-Economic Analysis Showing Grid Sales and LVOE for WSS Distributed Generation for Enugu

124767-fig-24

Fig 24: Techno-Economic Analysis Showing Grid Sales and LVOE for PSS Distributed Generation for Enugu

124767-fig-25

Fig 25: Techno-Economic Analysis Showing Grid Sales and LVOE for WSS Distributed Generation for Benin City

124767-fig-26

Fig 26: Techno-Economic Analysis Showing Grid Sales and LVOE for PSS Distributed Generation for Benin City

Conclusion

Renewable energy systems covering PV and wind energy resources were assessed for six meteorological locations within the six geo-political zones of Nigeria as standalone and in hybrid format for sites in these regions for remote community utilization as well as for distributed generation. Since the DSS is the only conventional means of generating power for these remote locations, due to their isolation from the national grid, it was taken as the basis of comparison. This study showed that the most economically feasible substitute for power generation at these rural communities of 200 homes in Jos (NC), Maiduguri (NE), Kano (NW), Iseyin (SW), Enugu (SE), and Benin City (SS) is the wind standalone system. This is in comparison to the present cost of grid electricity, at a cost of about $0.09/kWh, which makes the WSS, PSS and hybrid system quite competitive. Consequently, RE systems of PV and wind should become a priority for government in providing clean and non-depleting renewable energy to the rural poor so as to reduce the level of energy poverty in these communities. This will help meet the millennium development goals (MDG’s), as these goals are notably hinged on tolerable access to energy. This venture may also serve as a profitable business enterprise for socially responsible businesses if they take advantage of the provision made by government for embedded generation in Nigeria. Grid sales were discovered to range between 29,431,030 kWh per year to 103,477,904 kWh per year achievable from a 25MW Solar panel and 18MW wind turbine in Iseyin and Jos respectively. Therefore, the private sector can take advantage of this, while also aiding the growth and development of the rural populace through the instrumentality of adequate supply of energy to boost the socio-economic well-being of rural dwellers, which in no little way will help drive the attainment of the MDGs.

References

  1. Abatcha, H. G., Jumba, A. M.Y. & Maijama, L. (2011) ‘Design and Simulation of a Hybrid PV/FUEL Cell Energy System,’ Continental Journal of Engineering Sciences, Vol. 6 (1): pp.37-45.
    Google Scholar            
  2. Adekoya L.O.; Adewale A.A. (1992) “Wind energy potential of Nigeria,” Renewable Energy, 2(1): pp.35-39
    PublisherGoogle Scholar

    3. Agajelu, B. O., Ekwueme, O. G., Obuka, N. S. P. & Ikwu, G. O. R.  (2013) “Life Cycle Cost Analysis of a Diesel/Photovoltaic Hybrid Power Generating System,” Industrial Engineering Letters ISSN 2224-6096 (Paper) ISSN 2225-0581 (online), Vol.3, No.1, Reprinted pp.1-13
    PublisherGoogle Scholar

  3. Ajayi, O.O. (2010) “The Potential for Wind Energy in Nigeria,” Wind Engineering 34(3): 303-311.
    PublisherGoogle Scholar
  4. Ajayi, O.O. (2013) “Sustainable Energy Development and Environmental Protection: Implication for Selected States in West Africa,” Renewable and Sustainable Energy Reviews: 26, 532 – 539
    PublisherGoogle Scholar
  5. Ajayi, O.O. & Ajayi, O.O. (2013) “Nigeria’s Energy Policy: Inferences, Analysis and Legal Ethics towards RE Development,” Energy Policy: 60, 61-67.
    Publisher
    Google Scholar
  6. Ajayi, O.O. Fagbenle, R.O. & Katende, J. (2011) ‘Wind Profile Characteristics and Econometric Analysis of Wind Power Generation of a Site in Sokoto State, Nigeria,’ Energy Science and Technology, 1 (2), 54-66

    8. Ajayi, O. O., Fagbenle, R. O., Katende, J. & Okeniyi, J. O. (2011) “Availability of Wind Energy Resource Potential for Power Generation at Jos, Nigeria,” Front Energy, 5(4), 376—385.
    PublisherGoogle Scholar

  7. Ajayi, O. O., Fagbenle, R. O.; Katende, J., Okeniyi, J. O. & Omotosho, O.A. (2010) “Wind Energy Potential for Power Generation of a Local Site in Gusau, Nigeria,” International Journal of Energy for a Clean Environment, 11(1—4), 99—116
    PublisherGoogle Scholar
  8. Ajayi, O.O., Ohijeagbon, O.D., Nwadialo, C.E. & Olasope, O. (2014) “New Model to Estimate Daily Global Solar Radiation over Nigeria,” Sustainable Energy Technologies and Assessments, 5,Pages 28—36.

PublisherGoogle Scholar    

  1. Ajayi, O.O., Ohijeagbin, O.D., Ajanaku, K.O., Aasa, S.A. & Omotosho, O.A. (2014) “Techno-Economic Assessment of Renewable Electricity for Rural Electrification and IT Applications in Selected Sites Across the Geopolitical Zones of Nigeria,” Proceedings of the 23rd International Business Information Management Association Conference (23rd IBIMA) on Vision 2020: Sustainable Growth, Economic Development, and Global Competitiveness, Valencia, Spain 13-14, May 2014, pp 2216 – 2247
    PublisherGoogle Scholar
  2. Akella A.K., Sharma M.P. & Saini R. P. (2007) “In: Optimum Utilization of Renewable Energy Sources in a Remote Area,” Renewable and Sustainable Energy Reviews, 11, pp. 894—908
    Publisher – Google Scholar
  3. Bayod-Rujula, A. A. (2009) “Future Development of the Electricity Systems with Distributed Generation,” Energy, 377-383.
    Publisher
    – Google Scholar
  4. Branker, K., Pathak, M. J. M. & Pearce, J. M. (2011) “A Review of Solar Photovoltaic Levelised Cost of Electricity:,”Renewable and Sustainable Energy Reviews, 15, 4470—4482.
    Publisher – Google Scholar
  5. Chineke, T. C. & Igwiro, E.C. (2008) ‘Urban and Rural Electrification: Enhancing the Energy Sector in Nigeria Using Photovoltaic Technology,’ African Journal Science and Technology, Vol. 9, No. 1, pp. 102 — 108
    Google Scholar
  6. Clark II, W. W. & Eisenberg, L. (2008) “Agile Sustainable Communities: On-Site Renewable Energy Generation,”Utilities Policy, 262—274
    Publisher – Google Scholar
  7. Clean Energy Project Analysis, RETScreen Engineering & Cases Textbook,’ (2005) pp 91-116,173-216,316, Third Edition September 2005. Minister of Natural Resources Canada 2001-2005
  8. Duffie, J. A. and Beckman, W. A. (1991) “Solar Engineering of Thermal Processes 2nd ed.,” Wiley, New York.
    Publisher – Google Scholar
  9. Energy For All – Financing access for the poor (2011). ‘Special Early Excerpt of the World Energy Outlook 2011,’ The International Energy Agency (IEA), pp. 12
  10. Ettah, E. B., Udoimuk, A. B., Obiefuna, J. N. & Opara, F. E. (2012) “The Effect of Relative Humidity on the Efficiency of Solar Panels in Calabar, Nigeria,” Universal Journal of Management and Social Sciences, Vol. 2, No.3.   
    Publisher – Google Scholar
  11. Evans, D.L. (1981) “Simplified Method for Predicting Photovoltaic Array Output,” Solar Energy, 27, 6, 555-560.
    Publisher – Google Scholar
  12. Fagbenle, R.O. & Karayiannis, T.G. (1994) “On the wind energy resources of Nigeria,” International Journal of Energy research, 18(5):pp. 493-508
    Publisher – Google Scholar
  13. Fagbenle, R.O. Katende, J. Ajayi, O.O. & Okeniyi, J.O. (2011) “Assessment of Wind Energy Potential of Two Sites in North-East, Nigeria,” Renewable Energy, 36, 1277-1283
    Publisher – Google Scholar
  14. Fesharaki, V. J., Dehghani, M. & Fesharaki, J. J. (2011) “The Effect of Temperature on Photovoltaic Cell Efficiency,”Proceedings of the 1st International Conference on Emerging Trends in Energy Conservation-ETEC Tehran, Tehran, Iran, 20-21 November 2011, pp. 1-5
    Publisher – Google Scholar
  15. General Wattage Chart [Online], [Retrieved, 24th June, 2013], http://powersurvival.com/info.htm
  16. Gupta, A., Saini, R.P., & Sharma, M.P. (2010) In: “Steady-State Modelling of Hybrid Energy System for off Grid Electrification of Cluster of Villages,” Renewable Energy, Vol. 35, pp. 520-535.
    Publisher – Google Scholar
  17. Hiester, T.R. & Pennell, W.T. (1981) ‘The Siting Handbook for Large Wind Energy Systems,’ Wind Books, New York, NY, USA.
  18. HOMER Software [Online], [Retrieved, 18th March, 2013], http://homerenergy.com/
  19. Hontoria, L., Aguilera, J. & Zufiria, P. (2005) “A New Approach for Sizing Stand Alone Photovoltaic Systems Based in Neural Networks,” Solar Energy 78, 313—319. pp. 135
    Publisher – Google Scholar
  20. How Much Electricity Do Household Items Use? [Online], [Retrieved, 24th June, 2013],http://michaelbluejay.com/electricity/howmuch.html
    Publisher
  21. Hund, T. (2009) ‘Large Format Carbon Enhanced VRLA Battery Test Results,’ EESAT-2009, Seattle, Washington.
    Google Scholar
  22. Hunt, G.(2009) ‘Achievements of an ABSOLYTE Valve Regulated Lead-Acid Battery Operating in a Utility Battery Energy Storage System (BEES) for 12 Years,’ EESAT-2009, Seattle Washington.
    Google Scholar
  23. Ipakchi, A. & Albuyeh, F. (2009 “Grid of the Future,” IEEE Power & Energy Magazine 7, no. 2): 52—62;
    Publisher – Google Scholar
  24. Kaabeche, A., Belhamel, M. & Ibtiouen, R. (2011) “Sizing Optimization of Grid-Independent Hybrid Photovoltaic/Wind Power Generation System,” Energy Vol. 36, pp.1214-1222
    Publisher – Google Scholar
  25. Kanase-Patil A.B. Saini R.P. & Sharma M.P. (2010) “Integrated Renewable Energy Systems for off Grid Rural Electrification of Remote Area,” Renewable Energy, Vol. 35, pp. 1342-1349
    Publisher – Google Scholar
  26. Khatib, T., Mohamed, A. & Sopian, K. (2013) “A Review of Photovoltaic Systems Size Optimization Techniques,”Solar Energy Research Institute: Renewable and Sustainable Energy Reviews, Volume 22, Pages 454—465
    Publisher – Google Scholar
  27. Lambert M., Gilman P. & Lilienthal P. (2006) “Micropower System Modeling with HOMER,” chap. 15, John Wiley & Sons, Inc.
    Publisher – Google Scholar
  28. Lorenz, P., Pinner, D. & Seitz, T. (2008) “The Economics of Solar Power,“ pp.1-10
    Publisher – Google Scholar
  29. Mamo, X. Mallet, S. ; Coste, T. and Grenard, S. (2009) ‘Distribution Automation: The Cornerstone for Smart Grid Development Strategy,’ presented at the IEEE Power & Energy Society General Meeting, Calgary, Canada, July 26—30, 2009.
    Google Scholar
  30. Manwell, J.F. & McGowan, J. G. (1993) “Lead Acid Battery Storage Model for Hybrid Energy Systems,” Solar Energy, Vol. 50, pp. 399—405
    Publisher – Google Scholar
  31. Markvart, T. (1996) “Sizing of Hybrid PV-Wind Energy Systems,” Solar Energy Vol. 59, pp: 277—281
    Publisher – Google Scholar
  32. Mbakwe, S. N. & Iqbal, M. T.; (2011) ‘Amy Hsiao: Design of a 1.5kW Hybrid Wind / Photovoltaic Power System for a Telecoms Base Station in Remote Location of Benin City,’ Nigeria. Pg 1-7
  33. Meier, P.; Tuntivate, V.; Barnes, D.F.; Bogach, S.V.; Farchy, D. (2010) “Peru: National Survey of Rural Household Energy Use,” Energy and Poverty: Special Report,” The International Bank for Reconstruction and Development (The World Bank Group), pp. 20, 23
    Publisher – Google Scholar
  34. ‘Multi-Year Tariff Order for the determination of the cost of Electricity Generation,’ (2011)- Nigerian Electricity Regulatory Commission, period 1st June 2012 to 31st May 2017, pp.1-37
    Google Scholar
  35. National Energy Policy (2003) ‘The Federal Republic of Nigeria- The Presidency,’ Energy Commission of Nigeria, pp. 12-13
  36. Neha Sengupta, Kaushik Das, T.S. Jayram, Deva P. Seetharam (2012) ‘Optimal Allocation of Land Area for a Hybrid Solar Wind Power Plant IBM Research’ India pp.1-7
  37. Nwosu, C., Uchenna, U. C. & Madueme, T. (2012) “Wind-Solar Hybrid Power System for Rural Applications in the South Eastern States of Nigeria,” Journal of Electronics, Communication and Instrumentation Engineering Research: 2(2), 304-316
    Publisher – Google Scholar
  38. Ohijeagbon, O.D. & Ajayi, O.O. (2014)Potential and Economic Viability of Standalone Hybrid Systems for a Rural Community of Sokoto, North-west Nigeria,“ Frontiers in Energy (Springer), DOI 10.1007/s11708-014-0304-z
    Publisher – Google Scholar
  39. Ohijeagbon, O.D. & Ajayi, O.O. (2015)Solar Regime and LVOE of PV Embedded Generation Systems in Nigeria, “Renewable Energy 78 (2015) 226-235.
    Publisher – Google Scholar
  40. Omubo-Pepple, V. B., Tamunobereton-ari, I.7  Briggs-Kamara, M. A. (2013) “Influence of Meteorological Parameters on the Efficiency of Photovoltaic Module I Some Cities in the Niger Delta of Nigeria,” Journal of Asian Scientific Research, 3(1):107-113
    Publisher – Google Scholar
  41. Onyebuchi E.I. (1989) ”Alternative Energy Strategies for the Developing World’s Domestic Use: A Case Study of Nigerian Household’s Final Use Patterns and Preferences,” The Energy Journal, 10(3):121-138,
    Publisher – Google Scholar
  42. Overview of the NERC Regulations on Embedded Generation & Independent Electricity Distribution Networks, (2012), [Online], [Retrieved, 2nd July, 2013],
    http://www.businessdayonline.com/NG/index.php/law/legal-culture/38733-overview-of-the-nerc-
    regulations-on-embedded-generation-a-independent-electricity-distribution-networks
  43. Owonubi, O., Bammeke, G., Adelakun, A., Onwah, E., Solanke, A., Equere, U., & Oyegunle, O. ‘Meeting the Power Target–Executive Summary,’ 2009—08—28, © 2009 Vetiva Capital Management Limited. All rights reserved. [Available online, https://www.google.com.ng/url?sa=t&rct=j&q=&esrc=s&source=web&cd=1&cad=rja&uact=8&ved=
    0CBwQFjAA&url=http%3A%2F%2Fwww.proshareng.com%2Fnews%2Fdownload.php%3Fitem
    %3DPowerSectorUpdateMeeting%2BthePowerTarget.pdf&ei=2LTYVJvGGcS4UfSrhKgJ&usg=
    AFQjCNGQ_HqiBgyGiLnvj_FIIrbu8tTbyw&bvm=bv.85464276,d.d24, retrieved on 09/02/15.]
  44. Promoting Renewable Energy and Energy Efficiency in Nigeria (2007) ‘The Report of a one-day Conference by Community Research and Development Centre (CREDC),’ pp.1-35
  45. Rajoriya, E. F (2010) “Sustainable Energy Generation Using Hybrid Energy System for Remote Hilly Rural Area in India,” International Journal of Sustainable Engineering, pp.1-9
    Publisher – Google Scholar
  46. Renewables Global Status Report, (2014): REN21 Renewable Energy Policy Network for the 21st Century. Available online,[http://www.ren21.net/Portals/0/documents/Resources/GSR/2014/GSR2014_full%20report_low%20res.pdf, retrieved on 09/02/15]
  47. RETScreen 4 Software: The RETScreen Clean Energy Project Analysis Software – Natural Resources Canada[Online], [Retrieved, 18th March, 2013], http://www.retscreen.net/ang/home.php
  48. Rogers, J. C., Simmons, E. A., Convery, I., & Weatherall, A. (2008) “Public Perceptions of Opportunities for Community-Based Renewable Energy Projects,” Energy Policy, 4217—4226
    Publisher – Google Scholar
  49. Setiawan, A. A., Zhao, Y. & Nayar, C. V (2009) “Design, Economic Analysis and Environmental Considerations of Mini-Grid Hybrid Power System with Reverse Osmosis Desalination Plant for Remote Areas,” Renewable Energy, Vol. 34, pp. 374—383.
    Publisher – Google Scholar
  50. Shen, W. X. (2009) “Optimally Sizing Of Solar Array and Battery in A Standalone Photovoltaic System in Malaysia,”Renewable Energy, vol. 34, no. 1, pp. 348—352,
    Publisher – Google Scholar
  51. Skoplaki, E. & Palyvos, J. A. (2009) “On the Temperature Dependence of Photovoltaic Module Electrical Performance: A Review of Efficiency/Power Correlations,” Solar Energy (2009), 83, 614—624
    Publisher – Google Scholar
  52. Summary for Policy Makers: Renewable Power Generation Costs,’ (2012). International Renewable Energy Agency(IRENA), pp. 1-11
  53. Thomas, D. Hund, Gonzalez, S. & Barrett, K. (2010) ‘Grid-Tied PV System Energy Smoothing, Sandia National Laboratories,’ PO Box 5800, Albuquerque, New Mexico, USA, pp.1-5
  54. Walker, G. (2008) ”What are the Barriers and Incentives for Community-Owned Means of Energy Production And Use?,” Energy Policy, 4401—4405.
    Publisher – Google Scholar
  55. Wustenhagen, R., Wolsink, M., & Burer, M. J. (2007) “Social Acceptance of Renewable Energy Innovation: An Introduction to the Concept,” Energy Policy, 2683—2691.
    Publisher
    – Google Scholar
  56. Zainuddin,A., Shaari, S., Omar, A. M., Zain,Z. Md., Soumin, J. & Surat, Z. (2009) “Preliminary Investigations on the Effect of Humidity on the Reception of Visible Solar Radiation and the Effect of Humidity and Wind Speed on PV Module Output,” AIP Conference Proceedings,Volume1250,  pp. 55-58.
    Publisher – Google Scholar
  57. Zhou, W., Lou, Z., Li, Z., Lu, L. & Yang, H. (2010) “Applied Energy journal Applied Energy”, Vol. 87, pp. 380—389
    Publisher – Google Scholar


Shares