Introduction
In the modern-day discussions on sustainable economic development, the real sector is among the sectors that have been considered as major drivers of economic performance (Adeusi and Aluko, 2015). In the past few years in Nigeria, there has been a deliberate effort by the governments, where they have focused more on the sector, to complement and save the country from frequent economic shock from oil. The Nigerian economy has over the years been tied to its crude oil. This resulted in neglect of the real sector that was the pride of the nation and major source of foreign exchange before and after independence, until the discovery of oil. Monetary and fiscal policies have always been the major tools used by the governments across the globe, including Nigeria, to improve economic performance, and studies have been carried out to assess their effects on the economy (Oboh, 2017; Ajayi and Aluko, 2017 and Adegoriola, 2018).
The Nigerian government, through the monetary authority, has embarked on a series of policy actions, which are targeted at reviving the sector. Among these is the transmission of credit to the real sector, by influencing the banking system, through appropriate monetary policy instruments. This has not yielded the expected result, if the recent circulars of the Central Bank of Nigeria (CBN) to the deposit money banks are anything to go by (CBN Circular July 03, 2019; CBN Circular July 10, 2019). In July 2019, the CBN increased the minimum loan to deposit ratio of the deposit money banks from 58.5 percent to 60 percent to mandate them to increase lending to the real sector. This came with a penalty of additional cash reserve requirement of 50 percent of the lending shortfall of the target loan to deposit ratio, for banks that fail to comply with the directives. Another circular was published by the same CBN in September 2019, where it further increased the minimum loan to deposit ratio from 60 percent to 65 percent, with a stiffer sanction for non-compliance by the deposit money banks. In the statement of the CBN, the move is to facilitate greater investment in the real sector. Evidence from all of this is that the banking system sometimes limits their credit to the real sector. One of such reasons for this is the failure of the real sector investors to meet up with their loan repayment obligations, which is called credit risk or default risk in the literature (De Guimarães and Feijó, 2011; Ahiawodzi and Sackey 2013; Doriana, 2015). This study will reexamine this process of monetary policy effects on each subsector of the real sector; considering the intervening role of credit risk in the relationship between monetary policy and the real sector. The remaining part of this paper is organized into section two to section six. Section two focuses on the review of relevant literature; section three showcases the methodology and data used for the study; while section four details the results and discussions. In sections five and six, the conclusion and recommendation for policy implications are respectively presented.
Literature Review
Ayodeji and Oluwole (2018) used Johansen co-integration and vector error correction mechanism to examine the impact of monetary policy on the economy in Nigeria. The gross domestic product, broad money supply, interest rate, liquidity rate, and exchange rate were used as explanatory variables in the model. As revealed by the study, the exchange rate and money supply had a positive but fairly insignificant impact on the economy. Further findings showed a long-run relationship between monetary policy and the economy. The liquidity ratio was included in the model to determine output growth. However, the cash reserve ratio would have been a better variable. Liquidity ratio is the ratio of deposit that banks must hold in high liquid assets; cash reserve ratio is the ratio of deposit that must be kept with the central bank, which thereby determines the capacity of banks to lend to the productive sector.
With multiple regression analysis, Ekwe, Ogbonnaya and Omodero (2017) assessed the impact of monetary policy on the Nigerian economy. Their model contained gross domestic product, credit to private sector and money supply. They found that the monetary policy had no significant impacts on the economy, and discovered that the broad money supply had not been adequately regulated. It was further established that the bank lending rate to the private sectors was so high that it adversely affected the Nigerian economy. However, Ekwe et al., (2017) used money supply and credit to private sector as the only monetary variable to explain the Nigerian economy; this was represented by GDP. The model specification may suffer error of omitted variables, as the model is more of a closed one. Nigeria is an open economy with the rest of the world, so interest rate and exchange rate are key variables that influence the output in Nigeria.
Elem-Uche, Omekara, Okereke and Madu (2019), using the variables that reveal different types of monetary policy transmission channels, employed vector error correction model to forecast real output in Nigeria. According to the co-integration result, the monetary policy variable cointegrated with its channels of transmission, while credit channel, exchange rate and money supply channel accounted for the variations in real output in the short run. In the long-run, real output values adjusted speedily to the changes in the money supply, credit channel, interest rate and exchange rate channel. Taking some variables into account, the authors noted that the success and growth of the real sector depend on the efficacy of the monetary policy to forecast its policy outcome. They concluded that the influence of monetary policy channels is significant to stabilize Nigeria’s economy Abuka, Alinda, Minoiu, Peydro and Presbitero (2019) studied the monetary policy and bank lending in developing countries. According to the authors, a statement of weak or nonexistent bank lending channel in developing countries has existed for a long time, and they tried to revisit it, using Uganda as a case study. Their results showed that monetary policy contraction caused a reduction in bank credit supply to firms and affected economic activity, and they concluded that monetary policy can be an effective macroeconomic tool in developing countries. However, using only one country’s result to generalize the experience of all the developing nations is doubtful. More data from more than one developing country should have been included in the model for balanced and more inclusive research outcomes.
CBN (2014) studied the effect of monetary policy on the Nigerian real economy at a disaggregated level with SVAR econometric technique. Using a quarterly data from the period of 1993Q1 to 2012Q4 to show how the outputs from the various subsectors respond to unanticipated monetary policy shocks, the study’s result showed evidence of heterogeneous response of sectoral output to contractionary monetary policy shock. As further revealed by the forecast error variance decomposition, the most important variable that explains the variation in sectoral output is money supply, which represents the credit channel. The variations in sectoral real output are not significantly explained by monetary policy rate and exchange rate.
Patrick and Akanbi (2017) used Zambia as a case study to assess the relative importance of the channels of monetary policy transmission in a developing country. Using vector autoregressive econometric method to estimate the variables in the model, the authors found the exchange rate and credit channels to be effective monetary policy transmission channels. Further findings showed that interest rate channel was weak and asset price channel was not important. However, broad money supply was among the variables in the model specification on page 155, but what was eventually used by the authors in their analysis on page 157 and 159 was a narrow money supply. Broad money supply is a better representation of the stock of money in circulation. Patrick and Akanbi (2017) replaced it with narrow money supply without justification. This may have biased the results.
Herradi and Leroy (2019) used twelve advanced economies which included Australia, Canada, Germany, France, Italy, Denmark, Japan, United Kingdom, Sweden, Netherlands, Norway, United States, and Netherlands to assess the implication of monetary policy from a long-run perspective. Using local projections and a panel vector autoregressive method, they considered consumer price index, real gross domestic product, stock prices, national income, and nominal short term interest rate. According to the results, the expansionary monetary policy strongly increased the share of national income held by these countries, but contractionary monetary policy behaved in the opposite direction. This effect of monetary policy was caused by higher asset prices. However, few of the monetary policy transmission channels were considered; only variables that captured exchange rate, interest rate, and asset price channels were captured in their model. For instance, credit channel was not accounted for and no justification was given for this. Even if previous studies had established a weak credit channel in these countries, the authors should have mentioned it.
Ahiawodzi and Sackey (2013) conducted a study on the reasons for the credit rationing behavior of DMBs to the private sector, even when interest rates were liberalized to ensure credit allocation. According to the study, banks consider other factors in determining how they allocate their funds to borrowers. One of such variables is credit risk, which increases borrowers’ rate of default, including the real sector investors. They concluded by recommending an active role by the government in the financial sector, while banks should also strengthen their loan monitoring system. This will help to control the rate of default, as against their traditional method of credit rationing. De Guimarães and Feijó (2011) confirmed in their study that the macroeconomic environment contributes significantly to banks’ credit risk.
Methodology and Data
A Structural Vector Autoregressive (SVAR) econometric approach is used for this study. All the quarterly data, which were mainly sourced from CBN statistical bulletin, were adjusted for seasonal variations, using Census X-13. These are sectoral real output data on agriculture, manufacturing, construction, trade, and services and respectively represented as yt Agriculture,yt Manifacuring ,yt Construction,yt Trade,YtServices . Other variables in the model are interest rate (r), monetary policy rate (mpr), exchange rate (ner), maximum lending rate (mlr), asset price (Pa), broad money supply (m2), and credit to real sector (crs). Tests of stability, unit root and autocorrelation were also conducted.
Model Specification and Identification
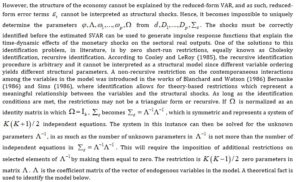
The structure of the economy is represented by the structural form in equation (1).

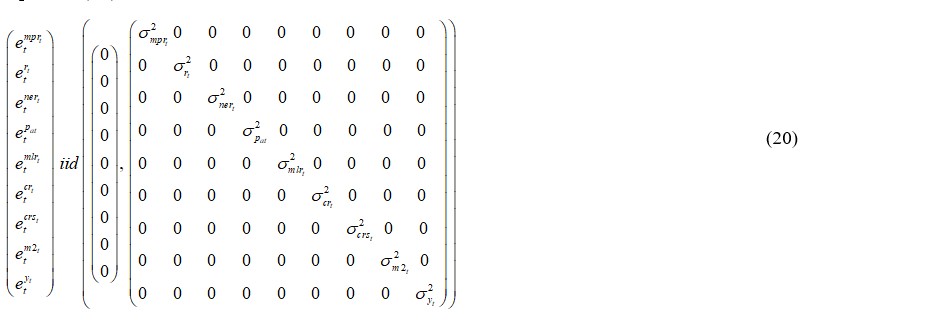
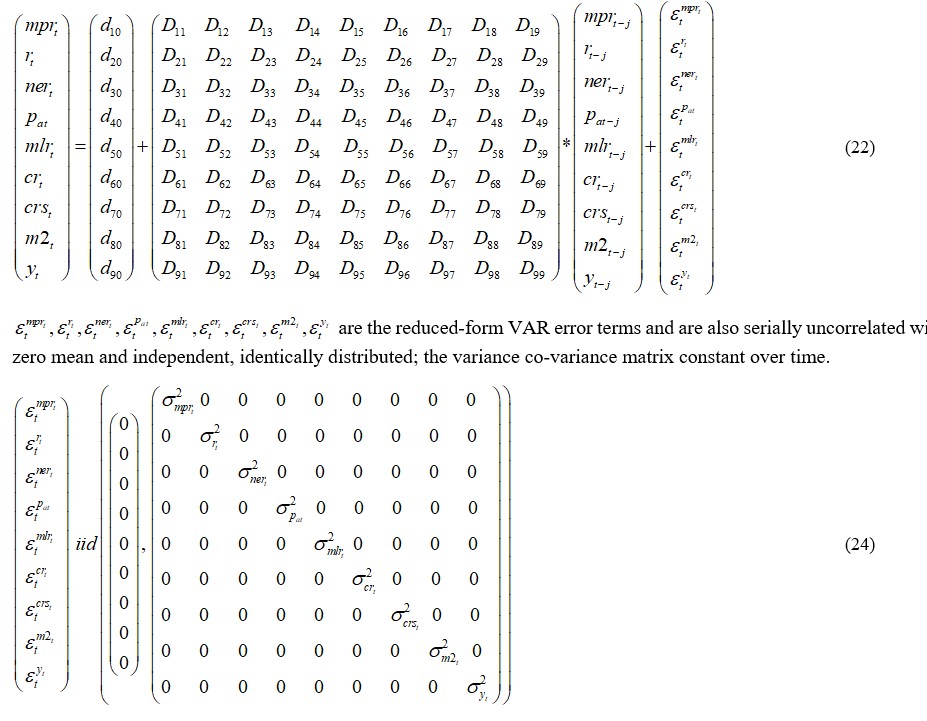
Λ is the coefficient matrix of vector of endogenous macroeconomic variable xt.φ is the vector of constants. ψ is the contemporaneous response of the variables to the shocks. ωj is the coefficient matrix of the vector of lagged values of endogenous variables, where ωj=1,…,p.xt is a vector of macroeconomic variables. is a vector of serially uncorrelated structural shocks with zero mean and diagonal variance co-variance matrix that is time invariant, represented as E⌈εtεt⌉= Ω ; where et ∼iid Nn ( 0, Ω) . This means the random variables are independent, identically distributed with the same distributions, but may be contemporaneously correlated. The structural equation is represented below in its implicit form:
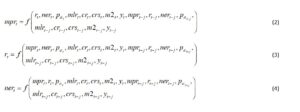
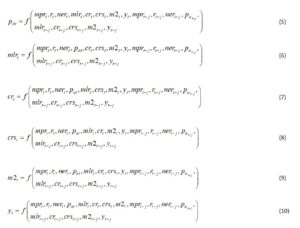
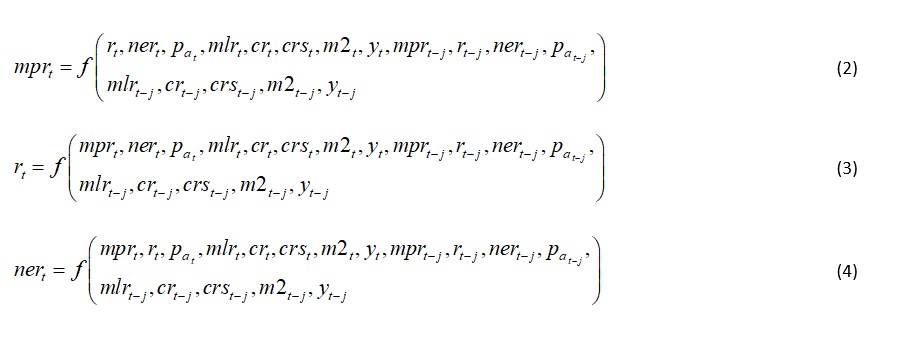
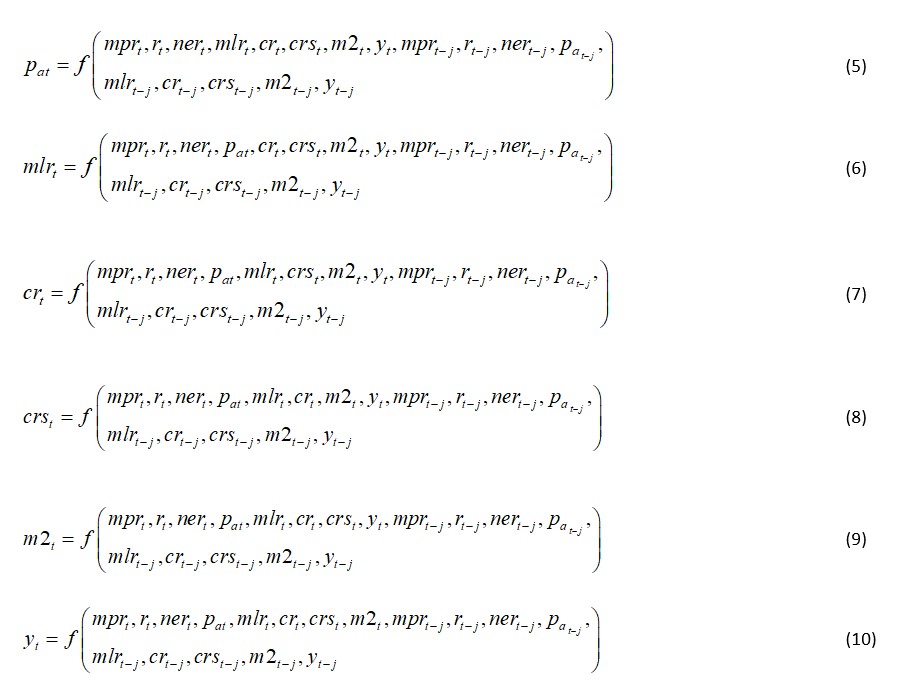
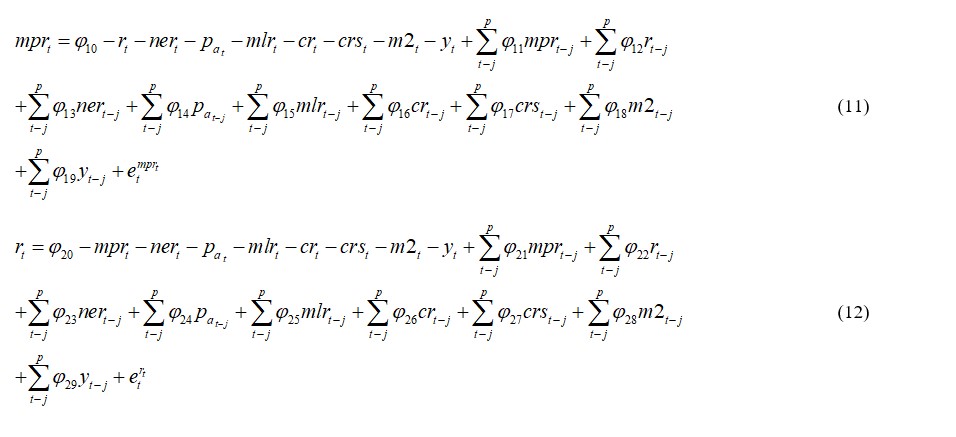
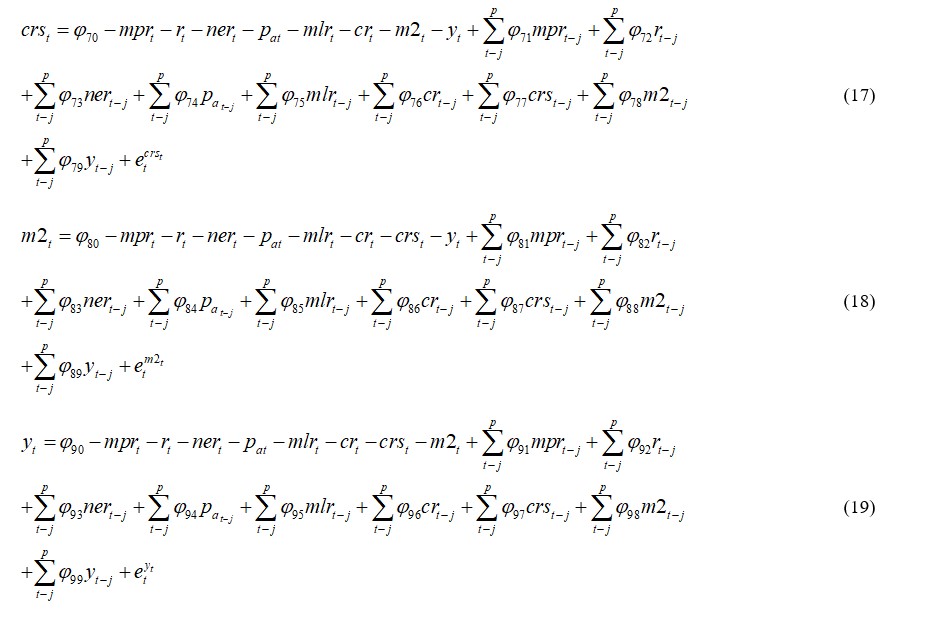
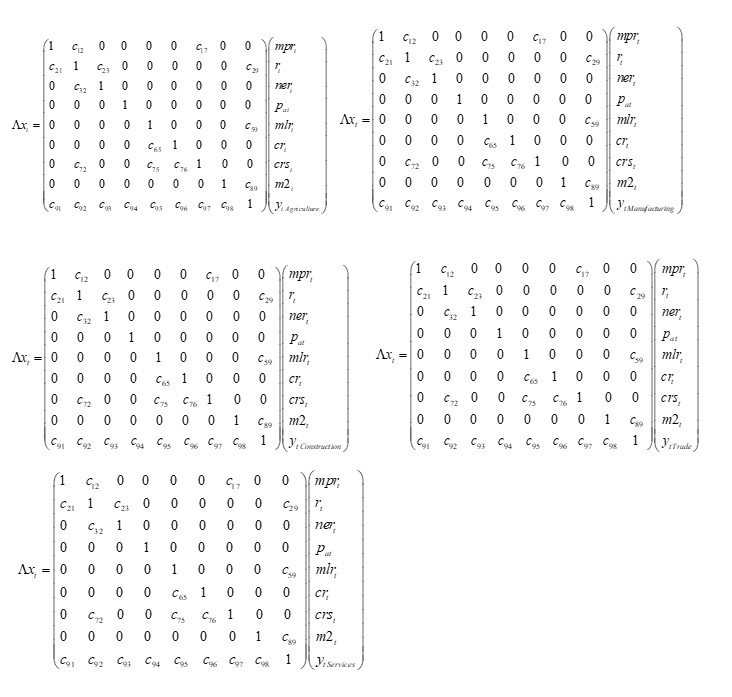
yt is the aggregate real sector. At the sectoral level yt , is respectively replaced by yt agriculture,Yt Manufacturing ,yt construction ,yt Trade and yt . In the equations, each endogenous variable is a function of all other endogenous variables and lag values of all the endogenous variables in the model. By the explicit form, the equations are represented below:
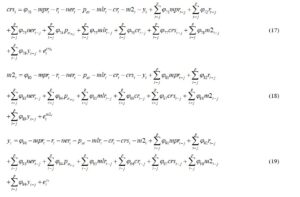
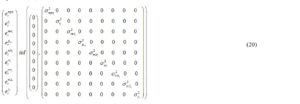
The structural shocks etmpr,ertt, etnert, etpat,etmlrt, etcrt, etcrt, etm2t, etyt are independent, identically distributed; the variance co-variance matrix is constant over time and the structural shocks are serially uncorrelated with zero mean as shown in equation (20).
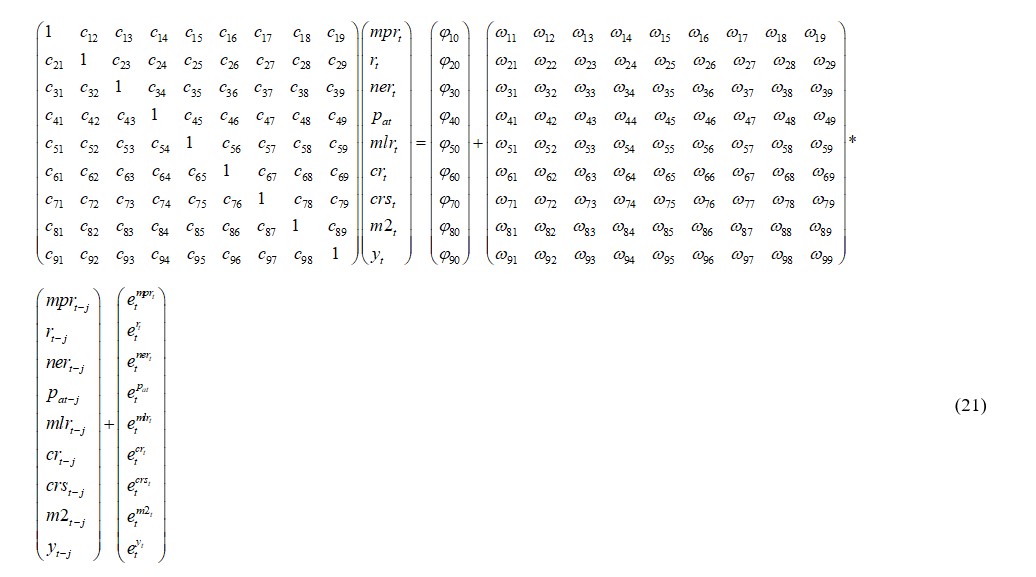
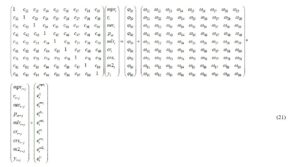
Representing equations (11) to (19) in matrix form, all the endogenous variables in each equation are expressed in terms of lag values of other endogenous variables:
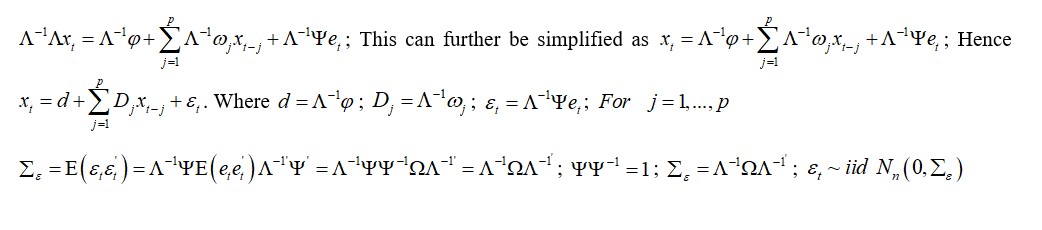
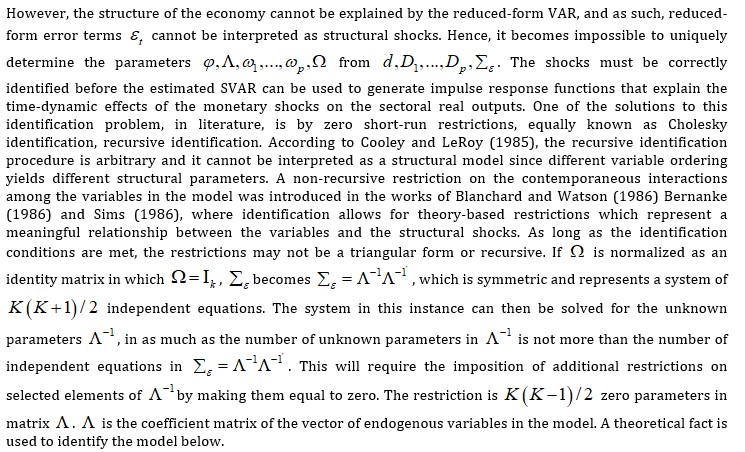
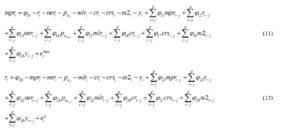
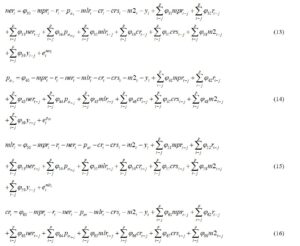
The structural form equations above cannot be estimated with OLS. This is the major problem with structural equations because the regressors are correlated with the error term and this violates an important assumption of OLS; as a result, no reliable estimates can be arrived at (Claudia and Massimiliano 2014). This problem can, however, be solved if equation (1) is considered in its reduced form VAR, by pre-multiplying the structural equation by the inverse of the coefficient matrix of the vector of the endogenous macroeconomic variables.
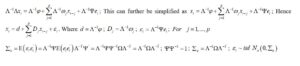
The reduced form VAR of equation (21) now becomes:

c12 represents the contemporaneous response of monetary policy rate to shocks from interest rate. This is theoretically and empirically valid as the monetary authority will adjust the monetary policy rate based on the activities in the banking system and changes in interest rate. c17 represents the contemporaneous response of monetary policy rate to shocks from credit to real sector. The bank lending rate and short-term interest rate are affected by changes in monetary policy rate; this affects credit to sectoral real sector. So, the indirect effect of the official interest rate on credit to the sectoral real sector by the banking system can be traced. c23 represents the contemporaneous response of interest rate to shocks from monetary policy rate.
In theory, changes to official interest rate lead to changes in the market interest rate. represents the contemporaneous response of interest rate to shocks from exchange rate. A fall in exchange rate will cause assets denominated in local currency to suffer exchange rate risk, making foreign investors demand for higher interest rate in investing in domestic assets. c29 represents the contemporaneous response of interest rate to shocks from sectoral real outputs. An increase in real output requires more money to purchase goods and services. This makes owners of real and financial assets offer them for sale thereby bringing down prices of these assets. This, however, leads to an increase in interest rate. represents the contemporaneous response of exchange rate to shocks from interest rate. c32 As domestic interest rate decreases, returns on domestic assets also decrease compared to foreign assets, leading to high capital outflows and depreciation of the domestic currency, which affects the exchange rate. c59 represents the contemporaneous response of maximum lending rate to sectoral real output. Perceived risky productive investors are one of the categories of banks’ customers. The maximum lending rate is the rate at which credit is advanced to this category of customers for investment purposes, which ultimately leads to an increase in real output.
c72 represents the contemporaneous response of credit to real sector to interest rate. When market interest rate declines, investment and credit to real sector are expected to increase. c75 represents the contemporaneous response of credit to real sector to shocks from maximum lending rate. Among other things, lending rate determines the quantity of credit banks give to their customers. c75 represents contemporaneous response of credit to real sector to shocks from credit risk. A high risk of default brings about higher non-performing loans, which makes banks lower credit to sectoral real sector. c89 represents the contemporaneous response of broad money supply to sectoral real output. As real output increases, all things being equal, more money will be needed to purchase more goods and services, as a result of the increase in output. c91 represents the contemporaneous response of sectoral real output to shocks from monetary policy rate. Real output responds to changes in monetary policy rate, through short term interest rates and other monetary policy channels.
c92 represents the contemporaneous response of sectoral real output to shocks from interest rate. This follows is-lm framework, where changes in interest rate will affect sectoral real output through investment. c93 represents the contemporaneous response of sectoral real output to shocks from exchange rate. This follows exchange rate channel of monetary policy impulses. c94 represents the contemporaneous response of sectoral real output to shocks from asset price. When stock prices fall, the value of financial wealth decreases which leads to a reduction in consumption and sectoral real output. c95 represents the contemporaneous response of sectoral real output to shocks from maximum lending rate. As banks lend to each subsector of the real sector, more investments are made, leading to an increase in real output. c97 represents the contemporaneous response of real output to shocks from credit to real sector. Through investment, a rise in credit to real sector will increase output. c98 represents the contemporaneous response of sectoral real output to broad money supply. An increase in broad money supply will shift the LM curve to the right, while a decrease in broad money supply will shift the LM curve to the left. In all this, sectoral real output is affected
Results and Discussions
Diagnostic Test
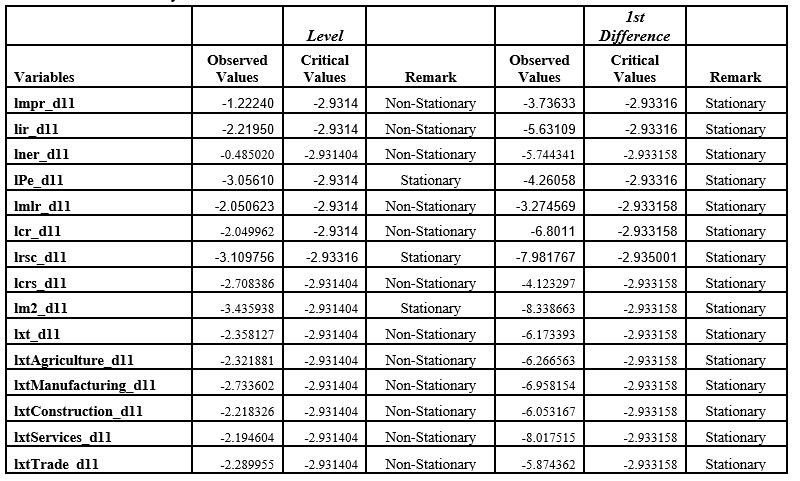
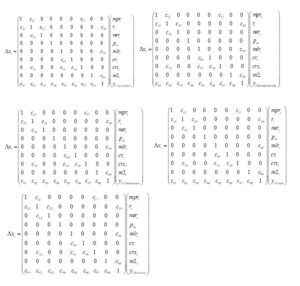
Philip Perron Unit Root Test
Table 4A: Summary of Unit Root Test
The stationarity test was conducted, using Phillips Perron unit root tests. At first difference, all the variables were stationary as detailed in table 4.A.
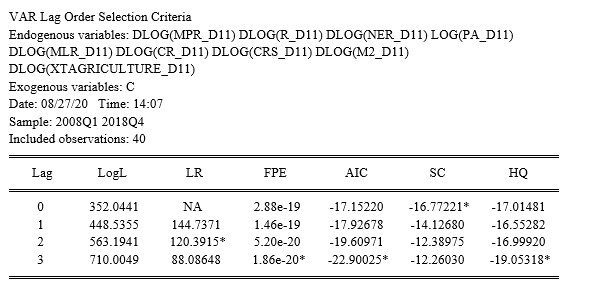
Lag Selection Criteria
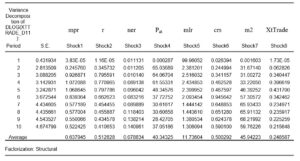
Akaike information criterion (AIC), Final Prediction Error (FPE) Hannan-Quinn information criterion (HQ) and Schwartz information criterion (SC) information criteria were used to determine the lag length. The choice of the optimum lag length used for this study is the lag which most criteria consider to be the optimum. This is indicated with an asterisk (*) in figure 4A.

Figure 4A – Lag Selection Criteria
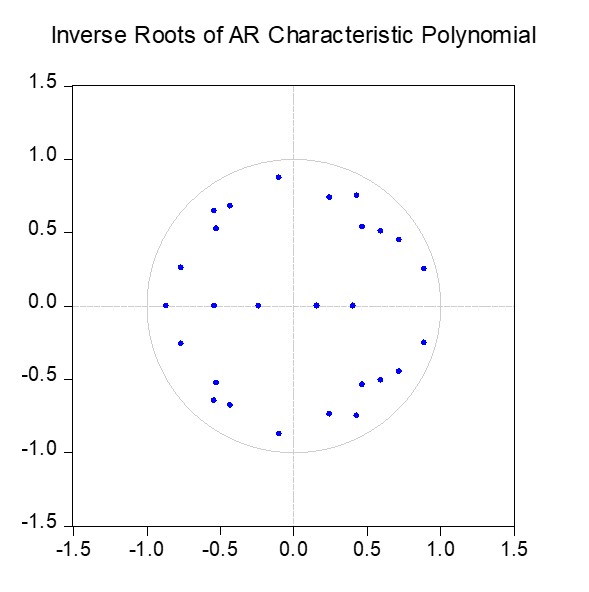
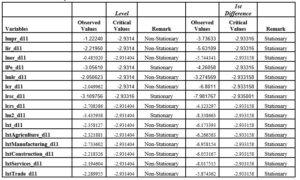
Stability and Normality Test
The reduced form VARs are stable as detailed in figure 4B; all the roots have modulus less than one and lie inside the unit circle. The normality test results in table 4B satisfy the normality condition, as the probability value corresponding to the Jarque-Bera statistics is more than 5%; meaning that residuals are multivariate normal.
Figure 4B – Stability Condition Table
Table 4B – Normality Test
Discussion of Results
Summary of SVAR Estimate of Contemporaneous Response among Variables
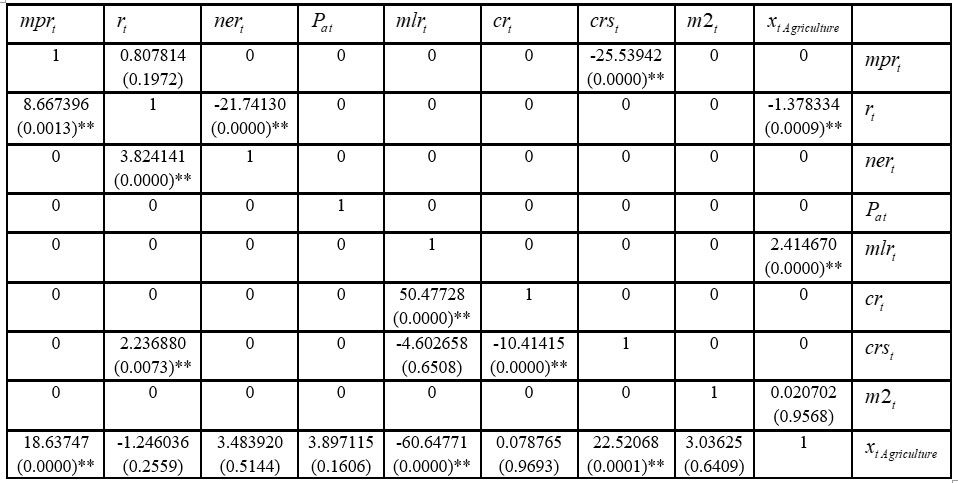
Agriculture
Table 4C – Summary of Agriculture SVAR Result
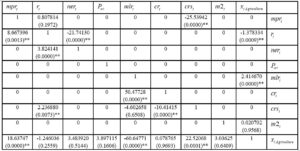
Note: ** indicates significant at 5% level, while * indicates significant at 10%
Source: Author’s computation using Eviews 10
Table 4C is the SVAR result estimates of agricultural sector, including the intervening role of credit risk. It reveals the contemporaneous response of each variable to shocks from other variables in the system. For instance, the estimate of contemporaneous response of credit to real sector to shocks from credit risk is -10.41415; which indicates a reduction in credit/funds to the real sector during the period of high credit risk.
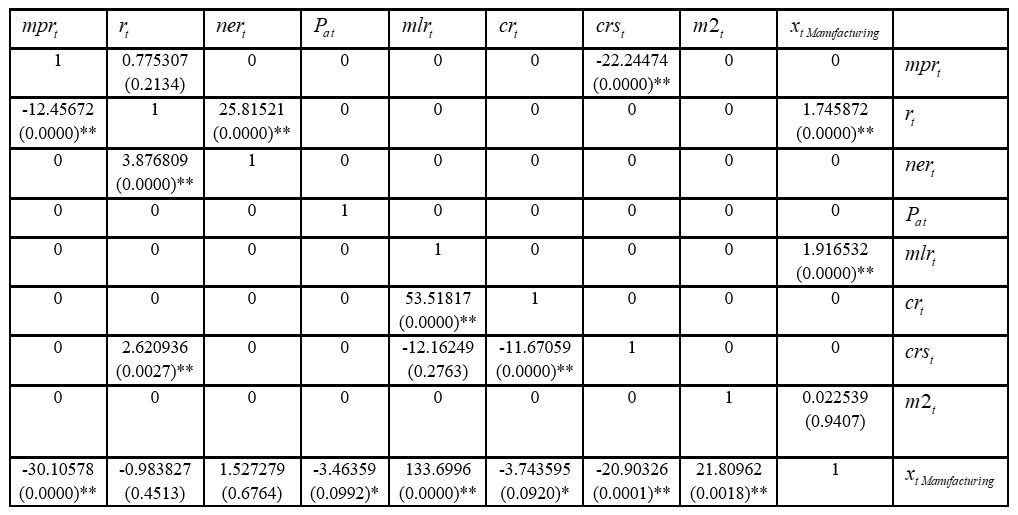
Manufacturing
Table 4D – Summary of Manufacturing SVAR Result
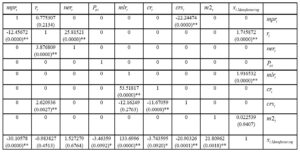
Note: ** indicates significant at 5% level, while * indicates significant at 10%
Source: Author’s computation using Eviews 10
Table 4D is the SVAR result estimates of manufacturing sector, including the intervening role of credit risk. It shows the contemporaneous response of each variable to shocks from other variables in the system. The estimate of contemporaneous response of credit to real sector to shocks from credit risk is -11.67059, which suggests a reduction in credit/funds to the real sector during the period of high credit risk.
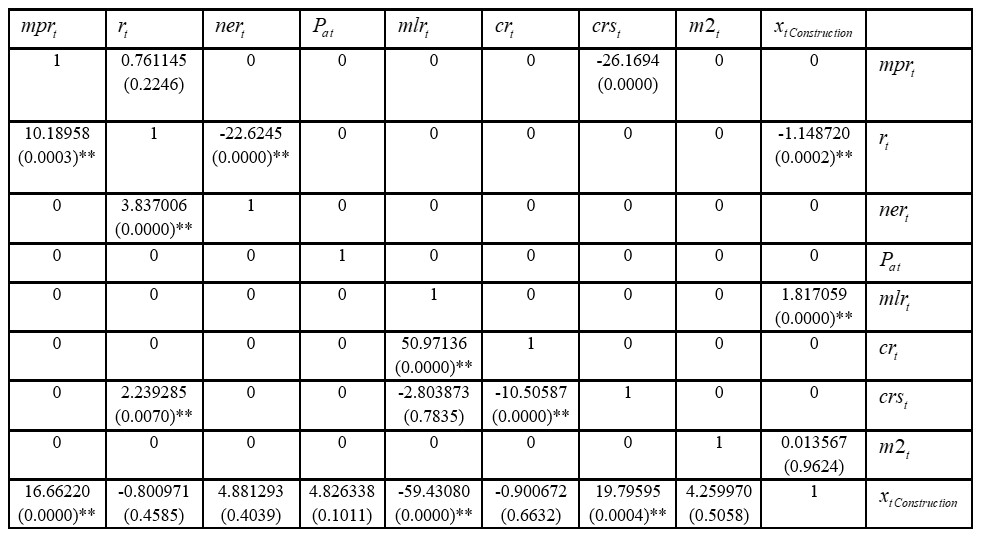
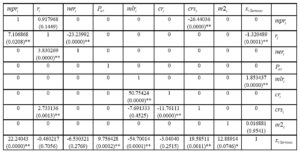
Construction
Table 4E – Summary of Construction SVAR Result

Note: ** indicates significant at 5% level, while * indicates significant at 10%
Source: Author’s computation using Eviews 10
Table 4E is the SVAR result estimates of construction sector, including the intervening role of credit risk. The contemporaneous response of each variable to shocks from other variables in the system is summarized in the table. Among these is the estimate of contemporaneous response of credit to real sector to shocks from credit risk, which is -10.50587. This indicates that credit to construction sector is reduced during the period of high credit risk.
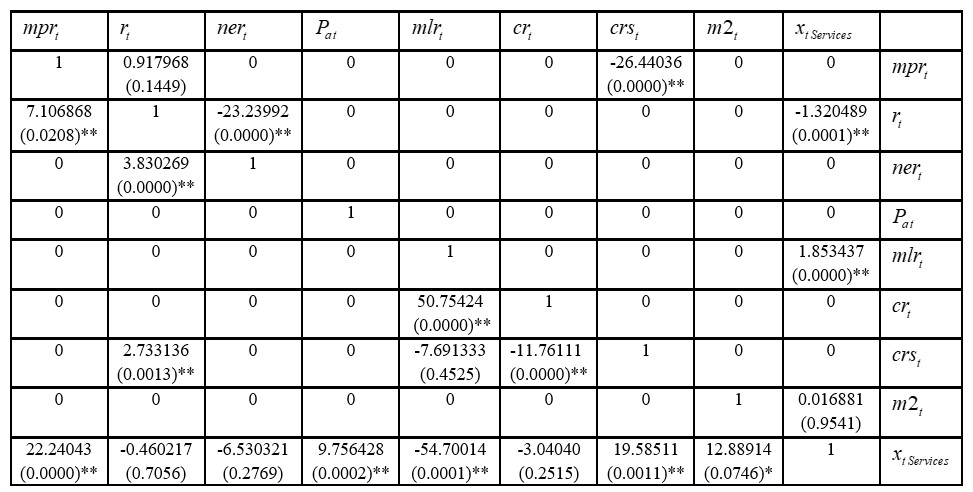
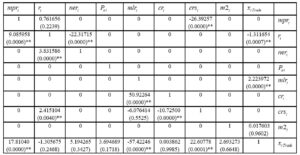
Services
Table 4F – Summary of Services SVAR Result
Note: ** indicates significant at 5% level, while * indicates significant at 10%
Source: Author’s computation using Eviews 10
The credit to the service sector, as revealed in table 4F, is also affected by high credit risk. This is evidenced by estimate of the contemporaneous response of credit to real sector to shocks from credit risk, which is -11.76111.
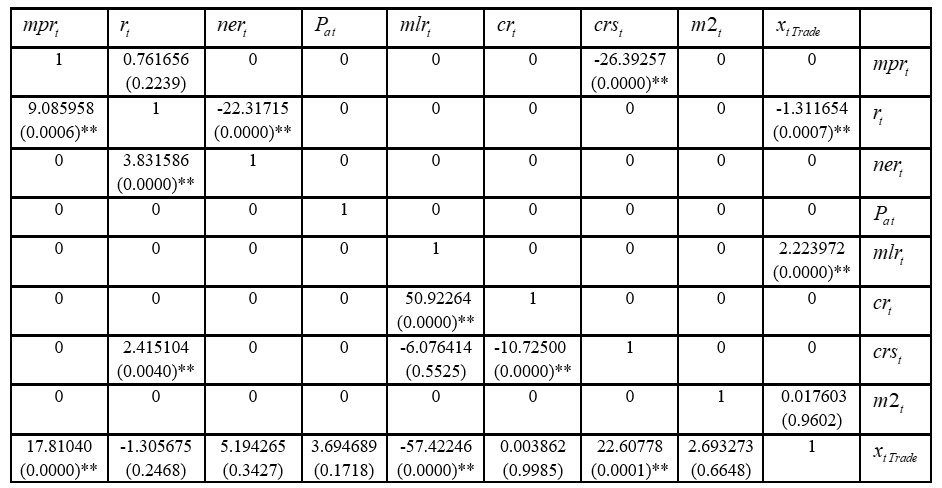
Trade
Table 4G – Summary of Trade SVAR Result
Note: ** indicates significant at 5% level, while * indicates significant at 10%
Source: Author’s computation using Eviews 10
Table 4G is the SVAR result estimates of trade sector. With the intervening role of credit risk, the credit to the sector from the banking system is reduced. This further explains the estimate of -10.72500, which is significant at 5%.
Forecast Error Variance Decomposition
Agriculture
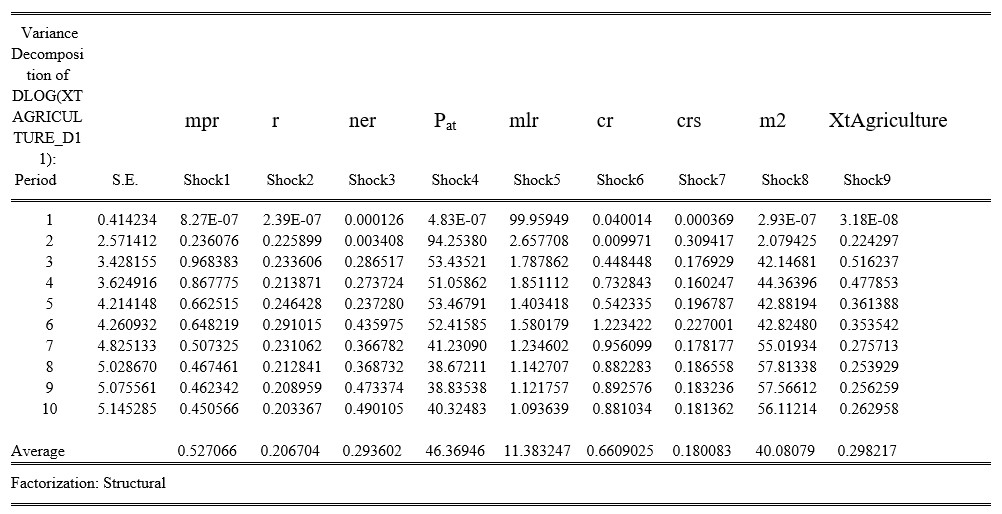
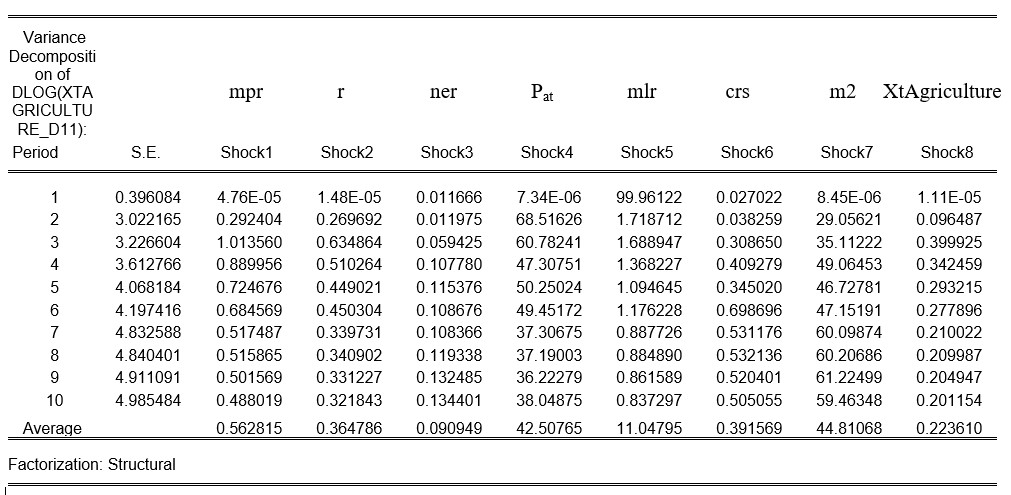
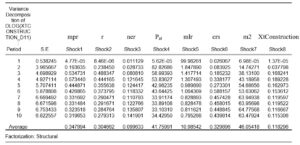
Table 4H – Variance Decomposition of Agricultural Output with the Intervening
Role of Credit Risk

Table 4H shows the variation in agricultural output as a result of shocks from other variables in the system. With the intervening role of credit risk, the contributions of shocks from the interest rate, exchange rate, asset price, and money supply are respectively 0.20%, 0.29%, 46.36% and 40.08%.
Table 4Ha – Variance Decomposition of Agricultural Output without the Intervening Role of Credit Risk
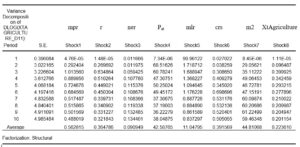
In table 4Ha, it is evidently seen that shocks from the interest rate, exchange rate, asset price, and money supply caused variations in agricultural output. These variations are respectively 0.36%, 0.09%, 42.50% and 44.81%.
Manufacturing
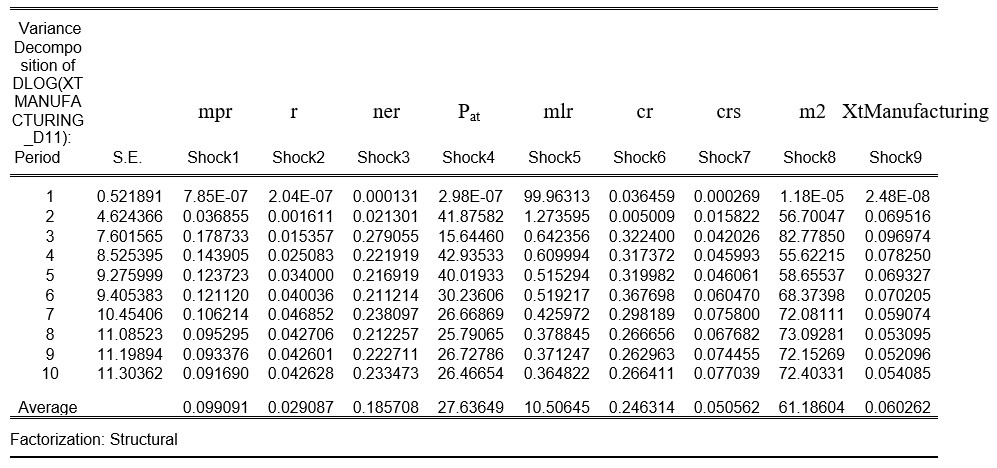
Table 4I – Variance Decomposition of Manufacturing Output with the Intervening
Role of Credit Risk
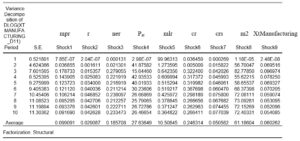
In table 4I, the respective contributions of shocks to interest rate, exchange rate, asset price and money supply, to the changes in manufacturing output are 0.02%, 0.18%, 27.63% and 61.18%. This is with the intervening role of credit risk
Table 4Ia – Variance Decomposition of Manufacturing Output without the Intervening Role of Credit Risk
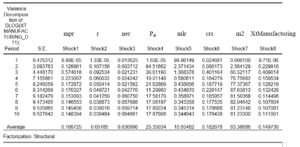
Table 4Ia contains the percentage variation to manufacturing output as a result of shocks to variables such as interest rate, exchange rate, asset price, and money supply. The contributions to variations in manufacturing output are 0.05%, 0.03%, 25.35% and 63.38%.
Construction
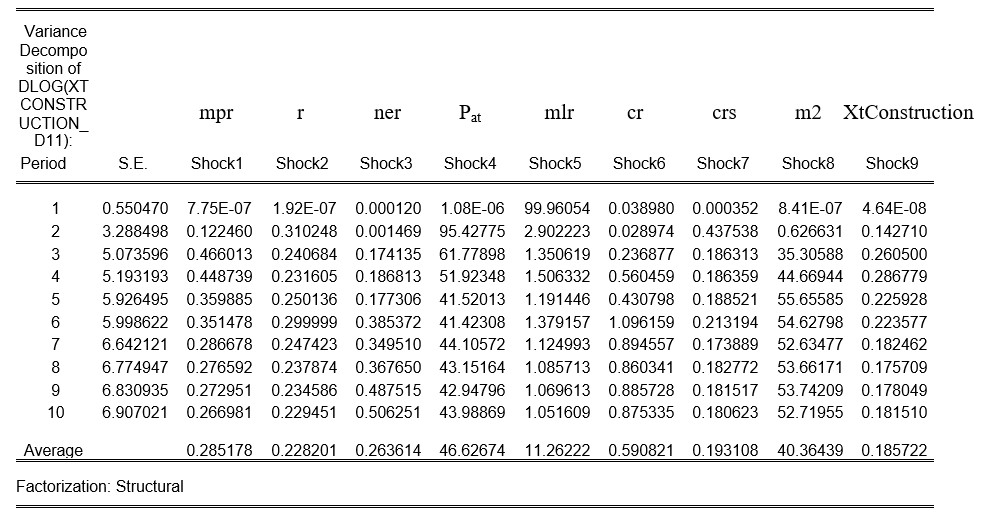
Table 4J -Variance Decomposition of Construction Output with the intervening
role of Credit Risk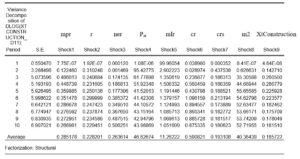
In table 4J, the variation to construction output with the intervening role of credit risk is shown. According to the result, about 0.22% variation in construction output is due to shocks from the interest rate. Shocks to exchange rate account for 0.26% variation in the output; shocks to asset price account for 46.62% variation in the output, while shocks to money supply account for 40.36% variation in construction output.
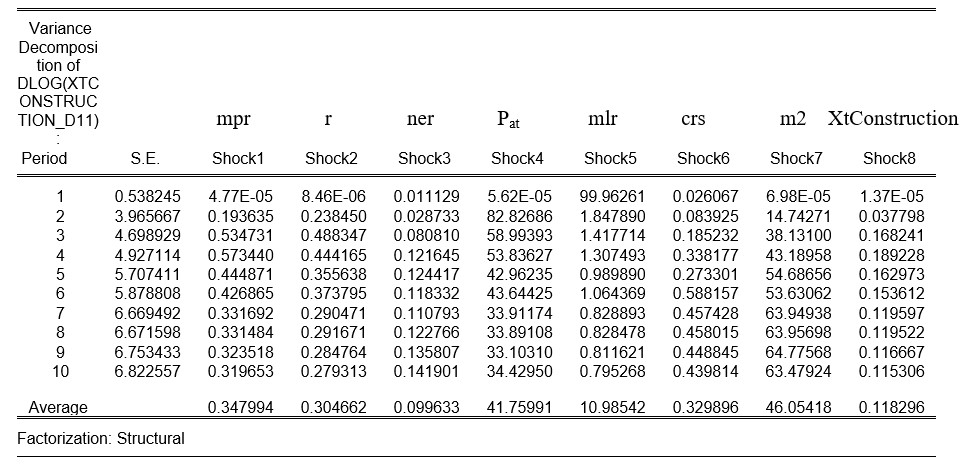
Table 4Ja -Variance Decomposition of Construction Output without the Intervening Role of Credit Risk
Without the intervening role of credit risk as revealed in table 4Ja, shocks to the interest rate are responsible for 0.30% variation in construction output. Shocks to exchange rate, asset price and money supply respectively account for about 0.09%, 41.75%, and 46.05 variation in construction output.
Services
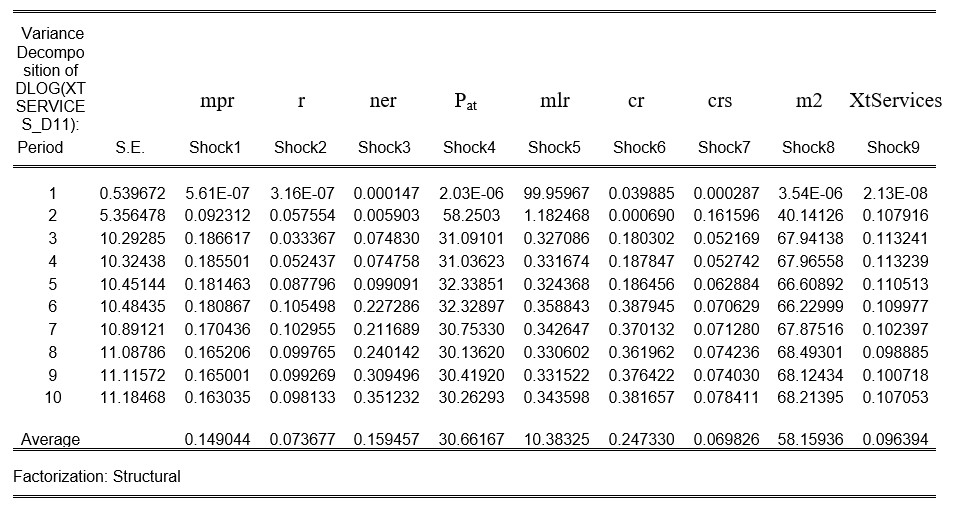
Table 4K – Variance Decomposition of Services Output with the Intervening Role of Credit Risk
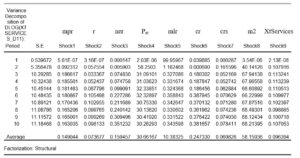
The result from table 4K reveals the percentage variation in services real output to shocks from the interest rate, exchange rate, asset price, and money supply, which are 0.07%, 0.15%, 30.66, and 58.15%.
Table 4Ka – Variance Decomposition of Services Output without the Intervening
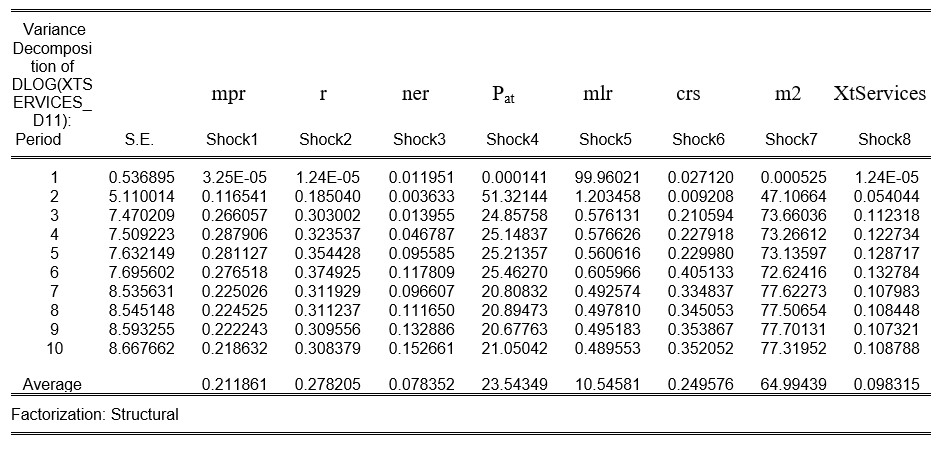
Role of Credit Risk
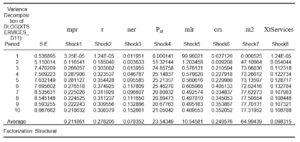
Table 4Ka reveals the contributions of shocks to interest rate, exchange rate, asset price, and money supply to the percentage variation in services real output, without the intervening role of credit risk. These variations are respectively 0.27%, 0.07%, 23.54% and 64.99%.
Trade
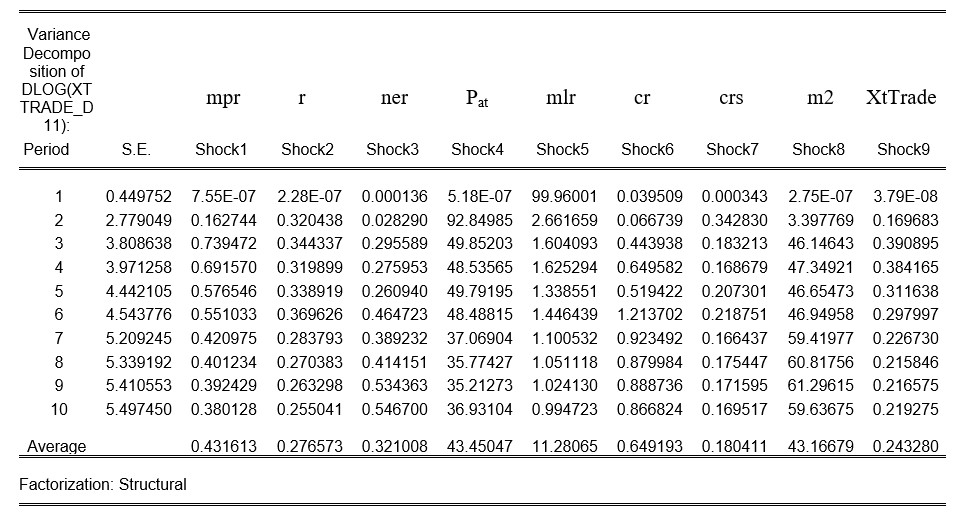
Table 4L: Variance Decomposition of Trade Output with the Intervening Role of Credit Risk
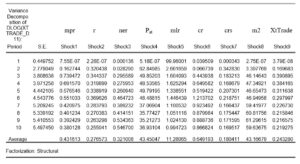
The trade variance decomposition result with the intervening role of credit risk is detailed in table 4L. While trade output variation of 0.27% is caused by shocks to interest rate, other variations of 0.32%, 43.45%, and 43.16% are as a result of shocks to exchange rate, asset price, and money supply.
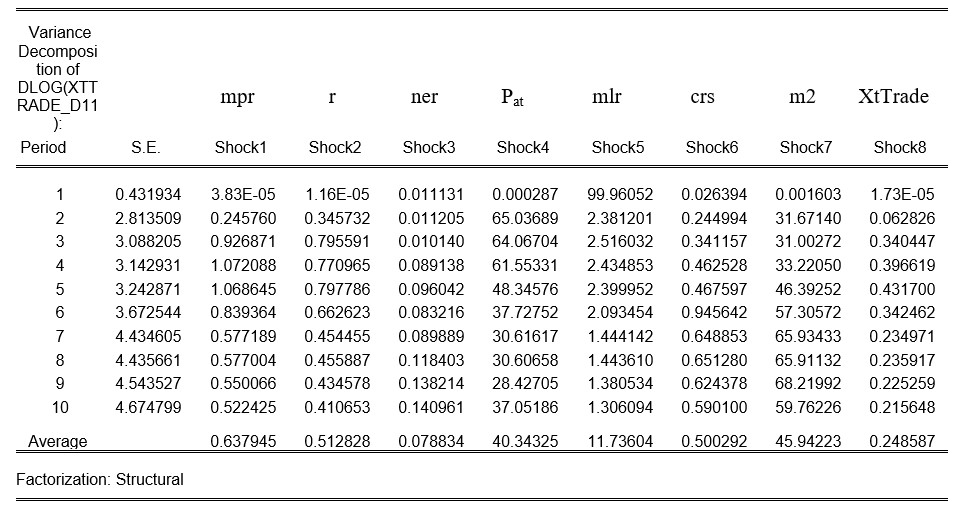
Table 4La: Variance Decomposition of Trade Output without the Intervening Role of Credit Risk
In table 4La, the variations of trade real output as a result of shocks to interest rate, exchange rate, asset price, and money supply are respectively 0.51, 0.07%, 40.34%, and 45.94%.
As shown in the sectoral SVAR result estimates in tables 4C, 4D, 4E, 4F and 4G, the interaction among the variables in the model follows the theoretical justifications that underscore the identification process. Most of the estimates are statistically significant at 5% level, including the contemporaneous response of credit to real sector to shocks to credit risk. With the role of credit risk in the relationship between monetary policy and the real sector, it is expected that in the period of high credit risk, less credit will be channelled or transmitted from the banking system to the real sector. This will eventually lead to a reduced impact on the real sector, as the effectiveness of the transmission chain is reduced by the intervening role of the credit risk. This is exactly the case, as shown in tables 4.H, 4.I, 4.J, 4.K and 4.L. These tables detail the channels through which the sectoral real outputs are affected or impacted, as a result of monetary policy actions of the CBN, with consideration for credit risk. When compared with the results in tables 4.Ha, 4.Ia, 4.Ja, 4.Ka and 4.La, it is evident that without the intervening role of credit risk, more money flows to the real sector through the money supply, which represents the credit channel, because money supply increases majorly as banks create more money through credit/deposit expansion.
For instance, without the intervening role of credit risk, about an average of 42.50% and 44.81% variation or changes to agricultural output are respectively from asset price and credit channels. With the intervening role of credit risk, the monetary policy effects on the agricultural output, through the credit channel, are reduced to 40.08%, which means that during the period of high credit risk, the monetary policy effects on agricultural subsector are majorly through the asset price channel (46.36%). For the manufacturing subsector, the monetary policy effect is majorly through the credit channel, both with and without the intervening role of credit risk. However, the effect is greater without the intervening role of credit risk (63.38%) than when the intervening role of credit risk is considered (61.18%). For the construction subsector, the effects of monetary policy during the period of high credit risk are majorly through asset price channel (46.62%), while the monetary policy effect on the subsector is majorly through the credit channel, without the intervening role of credit risk (46.05%). Similar evidence is established in the trade subsector, where an average of 43.45% changes to trade output is through the asset price channel in a period of high credit risk and 45.94% variation in the said subsector is through the credit channel, without the intervening role of credit risk. However, the credit channel in the services subsector is the major channel, both with and without the intervening role of credit risk; but the effect is lesser during the period of high credit risk. Further findings revealed that the interest and exchange rate channels are very weak in transmitting monetary policy effects to all the subsectors, as the changes to the sectoral real outputs are insignificant.
Comparing this study’s results with the result of the study carried out by the Central Bank of Nigeria (CBN, 2014), the following analysis can be arrived at: The CBN established that (a) There is evidence of heterogeneous response of sectoral output to contractionary monetary policy shock. (b) As revealed by the forecast error variance decomposition, the most important variable that explains the variation in the subsectors is money supply, which represents the credit channel. (c) The variations in sectoral real output are not significantly explained by monetary policy rate and exchange rate. This above analysis is similar to the findings of this study, without the intervening role of credit risk. The monetary policy, interest, and exchange rates’ contributions to the variations in sectoral outputs are insignificant. The variation to real output is majorly explained by money supply (which represents the credit channel) and asset price variables. However, the result is different, with the intervening role of credit risk. The asset price channel is the most effective in the agricultural, construction, and trade subsectors, during the period of high credit risk; while the effect of credit channel is reduced, in the manufacturing and services subsectors, with the intervening role of credit risk. This is one of the major contributions of this study.
Conclusion
The real sector in Nigeria has been given some level of attention in the past few years. This is a deliberate action to improve the sector and reduce overdependence on oil. This policy action includes influencing the banking system to channel more funds to the sector, through the use of monetary policy instruments. This study reexamined the sectoral effects of this process, using SVAR econometric technique with seasonally adjusted quarterly data spanning from 2008Q1 to 2018Q4. The results showed that monetary policy significantly impacts on the sectoral real sector. The credit and asset price channels are the two major channels of transmitting monetary policy effects to the agricultural, manufacturing, construction, services and trade subsectors. However, in the period of high credit risk, the credit channel transmits lesser monetary policy effects to the real sector than the asset price channel.
Recommendation
Evidence from the research findings revealed that all the subsectors of the real sector respond differently to the monetary policy actions of the Central Bank of Nigeria. Therefore, this study recommends that the monetary authority should always consider each subsector separately, by disaggregating the policy objectives to achieve the desired goals.
References
- Abuka, C., Alinda, R. K., Minoiu, C., Peydro, J. and Presbitero, A. F. (2019), ‘Monetary policy and bank lending in developing countries: Loan applications, rates, and real effects,’ Journal of Development Economics, 139, 185-202.
- Adegoriola, A. E. (2018) ‘An empirical analysis of effectiveness of monetary and fiscal policy instruments in stabilizing economy: evidence from Nigeria,’ Social Sciences, 7(3), 133-140.
- Adeusi, S. O. and Aluko, O. A. (2015) ‘Relevance of financial sector development on real sector productivity: 21st century evidence from Nigerian industrial sector,’ International Journal of Academic Research in Business and Social Sciences, 5(6), 118-132.
- Ahiawodzi, A. K. and Sackey, F. G. (2013), ‘Determinants of credit rationing to the private sector in Ghana,’ African Journal of Business Management, 7(38), 3864-3874.
- Ajayi, M. A. and Aluko, O. A. (2017), ‘Evaluating the relative impact of monetary and fiscalpolicy in nigeria using the St. Louis Equation,’ Acta Universitatis Danubius. Economica, 13(1), 40-50.
- Ayodeji, A. and Oluwole, A. (2018), ‘Impact of monetary policy on economic growth in Nigeria,’ Open Access Library Journal, 5, e4320. [Online], [Retrieved September 14, 2020], https://doi.org/10.4236/oalib.1104320
- Bernanke, B. S. (1986), ‘Alternative explanations of the money income correlation,’ Carnegie Rochester Conference Series on Public Policy, 49-100
- Blanchard, O. J. and Watson, M. W. (1986), ‘Are Business Cycles All Alike in R. Gordon, ed.,’The American Business Cycle – Continuity and Change, NBER Studies in Business Cycles, 25, Chicago, University of Chicago Press
- CBN (2014) ‘Effects of monetary policy on the real economy of Nigeria: a disaggregated analysis’
- CBN (July 03, 2019). ‘Regulatory measures to improve lending to the real sector of the Nigerian Economy,’ BSD/DIR/GEN/MDD/01/045
- CBN (July 10, 2019) ‘Circular to all banks. Re: Guidelines on accessing the CBN standing deposit facility,’ Ref: FMD/DIR/CON/OGC/12/019
- Claudia, F. and Massimiliano, M. (2014), ‘Mixed frequency structural VARs’, Norges Bank Working Paper [Online], [Retrieved September 14, 2020], https://ssrn.com/abstract=2383143or http://dx.doi.org/10.2139/ssrn.2383143
- Cooley, T. F. and Leroy, S. F. (1985), ‘Atheoretical Macroeconometrics. A Critique,’ Journal of Monetary Economics, 16, 283-308
- De Guimarães e Souza, G. J. and Feijó, C. A. (2011), ‘Credit risk and macroeconomic interactions: empirical evidence from the Brazilian banking system,’ Modern Economy, 2, 910-929.
- Doriana, C. (2015), ‘The impact of non-performing loans on bank lending behavior: Evidence from the Italian Banking Sector,’ Eurasian Journal of Business and Economics, 8(16), 59-71.
- Ekwe, M. C., Ogbonnaya, A. K. and Omodero, C. O. (2017), ‘Monetary policy and Nigerian’s economy: an impact investigation,’ International Journal of Economics and Finance, 9(11)
- Elem-Uche O., Omekara, C. O., Okereke, E. W. and Madu C. (2019), ‘Vector error correction model for forecasting real output using monetary policy transmission channel variables for Nigeria,’ American Journal of Mathematics and Statistics, 9(2), 92-99.
- Herradi, M. and Leroy, A. (2019), ‘Monetary policy and the top one percent: Evidence from a century of modern economic history,’ DNB Working Paper, 632
- Oboh, V. U. (2017), ‘Monetary and Fiscal Policy Coordination in Nigeria: A Set TheoreticApproach,’ Academic Journal of Economic Studies, 3(1), 48-58
- Patrick, C. M. and Akanbi, O. A. (2017), ‘The relative importance of the channels of monetary policy transmission in a developing country: The case of Zambia,’ African Journal of Economic Review, 5(2), 149-174
- Sims, C. A. (1986), ‘Are forecasting models usable for policy analysis?’ Federal Reserve Bank of Minneapolis Quarterly Review, 10(1), 2-1