Introduction
The conservation and restoration of artworks are included in the industries considered as creative or cultural industries (de-Miguel-Molina et al 2013). The UK Department for Culture, Media and Sports (DCMS) (2009), defined creative industries as “those industries that are based on individual creativity, skill and talent, and which have the potential to create wealth and jobs through developing intellectual property”.
The arts, heritage and recreation sectors come under the European classifications NACEs 90, 91, 92 and 93. NACEs 90 and 91 are also part of the Knowledge Intensive Services (KIS) industries, which are those related to the knowledge-based economy (de-Miguel-Molina et al. 2012; Windrum & Tomlinson, 1999; Aslesen & Isaksen, 2007a; Bishop, 2008; Strambach, 2008).
In terms of the arts and cultures sector, Bakhshi and Throsby (2010) discussed the lack of studies on innovation, which has been ignored in studies conducted about creative industries. Although there are good studies about the use of science in the restoration of specific artworks (Casadio et al. 2010, Cotte et al. 2010, Doménech-Carbó et al. 2011, Baglioni et al. 2012, Doménech-Carbó et al. 2012), the literature about the importance of open innovation and cooperation between different institutions in this subsector of creative industries is scarce. This paper tries to cover this gap.
In short, our paper’s goal is to examine cooperation between museums and other institutions in the restoration and conservation of artworks. To reach this objective, we have put forward two questions with reference to cooperation in this activity:
RQ1: Are museums in European countries important participants in cooperation with other institutions?
RQ2: Does a pattern in the cooperation between museums and other institutions exist?
Data were taken from the bibliometric analysis of scientific co-authored papers searched in Elsevier’s Scopus database. The final number of articles was 1,656. These data were cleaned through the VantagePoint software.
Important conclusions are inferred from the results. The first is that the participation of European countries for the application of science and technology in conservation and restoration of artworks is evidenced. The second is that, although many museums write papers by their own, when they co-author papers with other institutions, the latter are mainly located in their own country. These institutions are, mainly, research institutes and other museums. Results also illustrate that museums look for institutions that have different types of knowledge bases: symbolic (arts), analytical (physics and chemistry) and synthetic (engineering).
The Use of S&T in the Conservation and Restoration of Artworks
Lazzeretti (2012) has analysed the importance of cooperation between different institutions in the development of laser technology for restoring artworks. She explains how cooperation is mainly between local institutions, which can produce the development of a cluster, like the restoration cluster in Firenze (Italy). However, literature about cooperation in arts activities in an innovation framework, like the scheme explained in the Oslo Manual (2005), is scarce.
The main problem in analysing activities like conservation and restoration is that there are no data in the innovation surveys that some countries elaborate. In the subsector covered in this paper, data for patents would be collected from national surveys if they were available, but it is not the case. One solution is the use of bibliometric approach to cover this gap, and especially scientific articles. Different authors have studied technologies, knowledge and networks (Youtie and Shapira 2008, Leydesdorff and Rafols 2011, Robinson et al. 2013). Abramo et al. (2009) mention that using a bibliometric approach to studying cooperation between institutions, as universities and industries, through co-authorship of scientific articles, also allows the diffusion of knowledge and skills. Moreover, Wall and Boschma (2009) refer to knowledge networks in innovation systems where dissemination occurs both between local and abroad actors. In applying a new technology, Boschma (2005) and Rafols et al. (2010) state that actors require cognitive proximity to absorb new knowledge. These authors also ask if the networks will be local, national or global, and if the proximity will be geographic or cognitive.
Conservation is cited by authors among the main activities in a museum, and essential to preserve its heritage (Papini and Persiani 2004, Kotler et al. 2008). At the end of the XVIII century and throughout the XIX, art collections and catalogues live with research in physics and chemistry applied to artworks restoration. Museum restoration laboratories and departments were set up during the XIX century (Moreira 2008). Therefore, analytical knowledge cooperation co-exists in museums since restoration departments were created.
Method
Data
The data used to measure collaboration are scientific co-authored papers. For bibliometric analysis, we searched keywords “paint*” AND “restoration” OR “conservation” in Elsevier’s Scopus database. We obtained publications in international journals about the restoration and conservation of painting artworks. The final number of articles was 1,656. These data were imported to VantagePoint software, which was used to clean up the institutions involved in restoration and conservation, and elaborate matrixes of co-authorship among museums, restoration institutes and universities. Matrixes were elaborated depending on papers: museums with other museums, museums with restoration and conservation institutes, museums with university physics and chemistry departments, and museums with university engineering and Information Technologies departments.
The number of institutions analysed was 222: 94 museums from 26 countries, 41 conservation and restoration institutes, 49 university physics and chemistry departments and 38 university engineering and Information Technologies university departments.
Methodology
For bibliometric analysis, we used Elsevier’s Scopus database and the data were cleaned and prepared using three softwares: VantagePoint, WordStat and QDMiner. Matrixes were elaborated depending on: a) papers that were written by the museums or b) papers that were co-authored between a museum and: other museums (symbolic knowledge), restoration and conservation institutes (symbolic), physics and chemistry departments in universities (analytical), or engineering and Information Technologies departments in universities (synthetic). Moreover, institutions were defined depending on their geographical location: Europe, USA & Canada, Central & South America, Asia, Africa, and Oceania. A total of 94 museums were analysed, 26 of which were located in the United States, 53 in Europe, 7 in Asia, 3 in Africa, 2 in Central & South America and 2 in Oceania.
Networks of 2-mode were represented by means of UCINET6 and NETDRAW software. Centralisation degree for affiliation matrixes was calculated in order to determine which institutions co-authored more papers with museums.
Results
In this section, we answer the two research questions posed at the start of this paper:
RQ1: Are museums in European countries important participants in cooperation with other institutions?
RQ2: Does a pattern in the cooperation between museums and other institutions exist?
In terms of the first research question, we focus on countries and the importance they have in the science of conservation and restoration of artwork. For this purpose, we elaborate a 1-mode matrix where columns and rows are each country, included in the same order. We have used the number of papers in which every country appears as attributes. Therefore, we represent, in Figure 1, co-authorship between countries, and the size of the nodes represents how important is every country. The figure shows that Italy and the United States are the most important countries. Also, the United Kingdom and Spain are between the most important participants in explaining how to use science and technology in conservation and restoration.
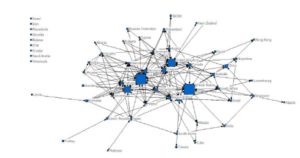
Figure 1: Ranking of countries in co-authorship of papers about conservation and restoration of artworks. Source: compiled by authors based on the Scopus database
In order to analyse in detail the countries that cooperate more in conservation and restoration, we need to eliminate those that do not cooperate. In this case, we eliminate the nodes that appear in the left side in Figure 1: Israel, Iran, Macedonia, Slovakia, Belarus, Chile, Croatia, Saudi Arabia and Venezuela. Once we had eliminated these nodes, we used social network analysis (SNA) to calculate the centrality degree, which calculated how many nodes are connected. Table 1 indicates that Italy is the country with the highest degree of cooperation in papers. The second country in order of appearance is the United Kingdom and the third is the United States. Column “Nrm Degree” indicates that each one of these three countries has more than 10% of the total connections of the network.
Table 1: Centrality measure: degree
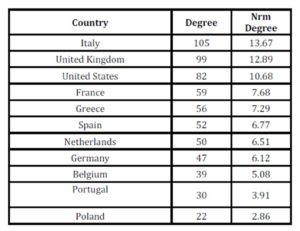
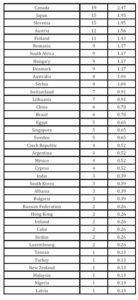
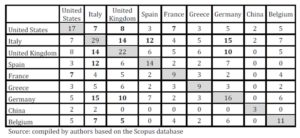
Source: Compiled by authors based on the Scopus database
Next, we calculated the cliques where there are more than three countries. We have found 47 cliques: Italy appeared in 29 cliques, the United Kingdom in 22 and the United States in 17. Moreover, Germany is in 16, Spain in 14, Belgium in 11 and France in 9 cliques. Therefore, participation of European countries in cooperation for application of the science and technology in conservation and restoration of artworks is evidenced.
1: United States Italy United Kingdom Spain France Greece Germany Netherlands Portugal
2: United States Italy United Kingdom Spain Germany Netherlands Finland
3: Italy United Kingdom Spain Germany Portugal Poland
4: Italy United Kingdom Spain Germany Poland Denmark
5: Italy United Kingdom Spain Germany Poland Finland
6: United States Italy United Kingdom France Greece Germany Belgium Netherlands
7: Italy United Kingdom Greece Germany Belgium Austria
8: Italy United Kingdom Germany Belgium Poland Austria
9: Italy United Kingdom Germany Belgium Poland Denmark
10: United States Italy United Kingdom France Netherlands Canada
11: Italy United Kingdom Canada Poland
12: Italy United Kingdom Russian Federation
13: Italy United Kingdom Greece Cyprus
14: Italy United Kingdom Greece Bulgaria
15: United States Italy China
16: Italy China Austria
17: Italy Spain France Japan Portugal
18: Italy Spain Japan Portugal Romania
19: Italy Spain Japan Portugal Slovenia
20: Italy Spain Japan Finland
21: Italy Canada Romania
22: Italy Belgium Czech Republic
23: Italy Spain Czech Republic
24: Italy Germany Portugal Poland Slovenia Hungary Lithuania Serbia
25: Italy Spain Germany Portugal Poland Slovenia
26: United States Italy Spain Germany Portugal Slovenia
27: Italy Germany Belgium Poland Slovenia
28: United States Italy Germany Belgium Slovenia
29: Italy Germany Poland Austria Hungary
30: United States United Kingdom France Canada Australia South Africa
31: United Kingdom Australia Denmark
32: United Kingdom Germany Switzerland Denmark
33: United Kingdom Canada Switzerland
34: United States India South Korea
35: United States India Singapore
36: United States United Kingdom Greece Egypt
37: United States France Belgium Brazil South Africa
38: United States Brazil Argentina
39: United States United Kingdom Argentina
40: United States United Kingdom France Belgium South Africa
41: United States China Singapore
42: Spain Greece Netherlands Portugal Sweden
43: United States France Belgium México
44: Belgium México Cuba
45: United Kingdom Spain Albania
46: Greece Austria Jordan
47: France Greece Luxembourg
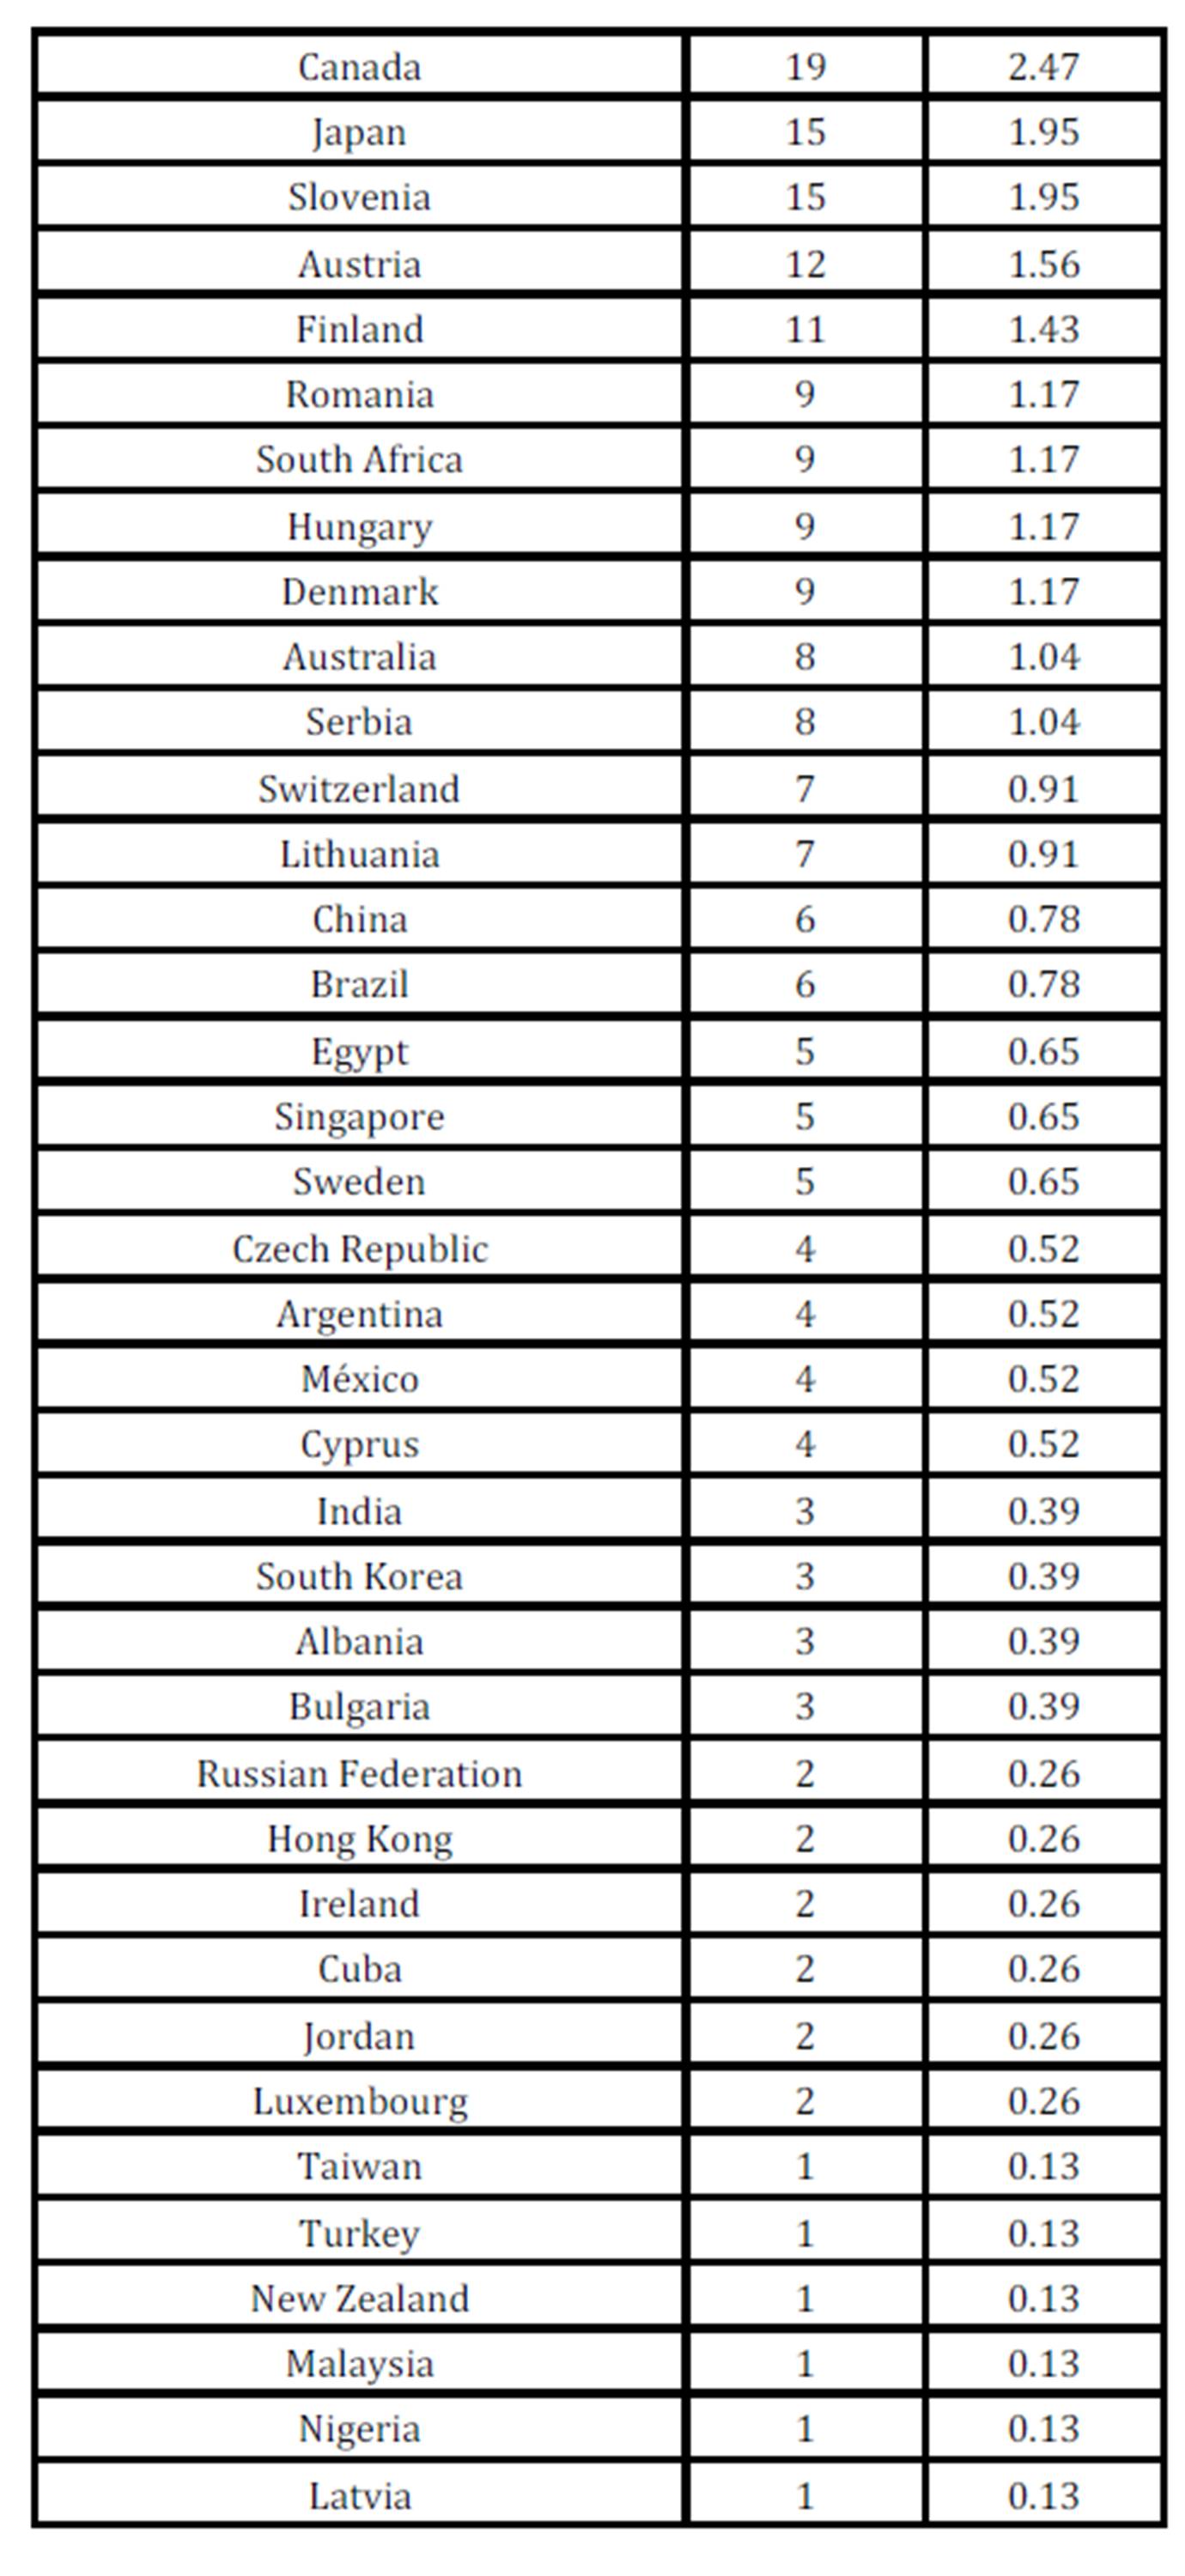
An interesting result is shown in Table 2, where we incorporate the co-membership matrix resulted from cliques. We only include, in the table, the most important countries. Results indicate the number of cliques in which every country in the diagonal participate, and the rest of cells represent in how many cliques there are coincidences between countries. For example, the United Kingdom coincides with Italy in 14 cliques; Italy and Germany are jointly in 15 cliques, and Spain and Italy concur in 12 cliques. It is evident that countries cooperated in a high rank with Italy and the United Kingdom.
Table 2: Clique co-membership matrix for the most important participants
The second objective of this paper is to detect whether there is a pattern in the cooperation between museums and other institutions. Also, the paper looks into which type of knowledge base the museums look for when they are going to undertake the conservation or restoration of any artwork that they are not able to do or they do not have the knowledge needed to do it. For this purpose, we prepare a 2-mode network, where the rows are the museums and the columns are the institutions that cooperate with museums. We have differentiated between institutions depending on where they are located, in the same country than the museum or abroad.
Firstly, we represent the entire network in Figure 2. This figure shows that museums write an important part of the papers alone. Moreover, there is no cooperation with institutions located in the left side of the Figure 2 (See Appendix for the meaning of codes). Because the main objective of this paper is to analyse cooperation, we eliminate both institutions that do not cooperate with museums and museums that write papers alone.
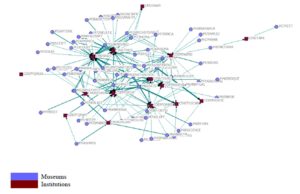
Figure 2: Museums and their cooperation with other institutions
Source: compiled by authors based on the Scopus database
Figure 3 includes the cleaned network. Looking at the figure, we may indicate that museums cooperate mainly with other museums and restoration institutes located in their own country. In order to better determine patterns of cooperation, we calculate density, degree, closeness and betweenness.
Figure 3: Cooperation between museums and institutions based on co-authorship of papers
Source: compiled by authors based on the Scopus database
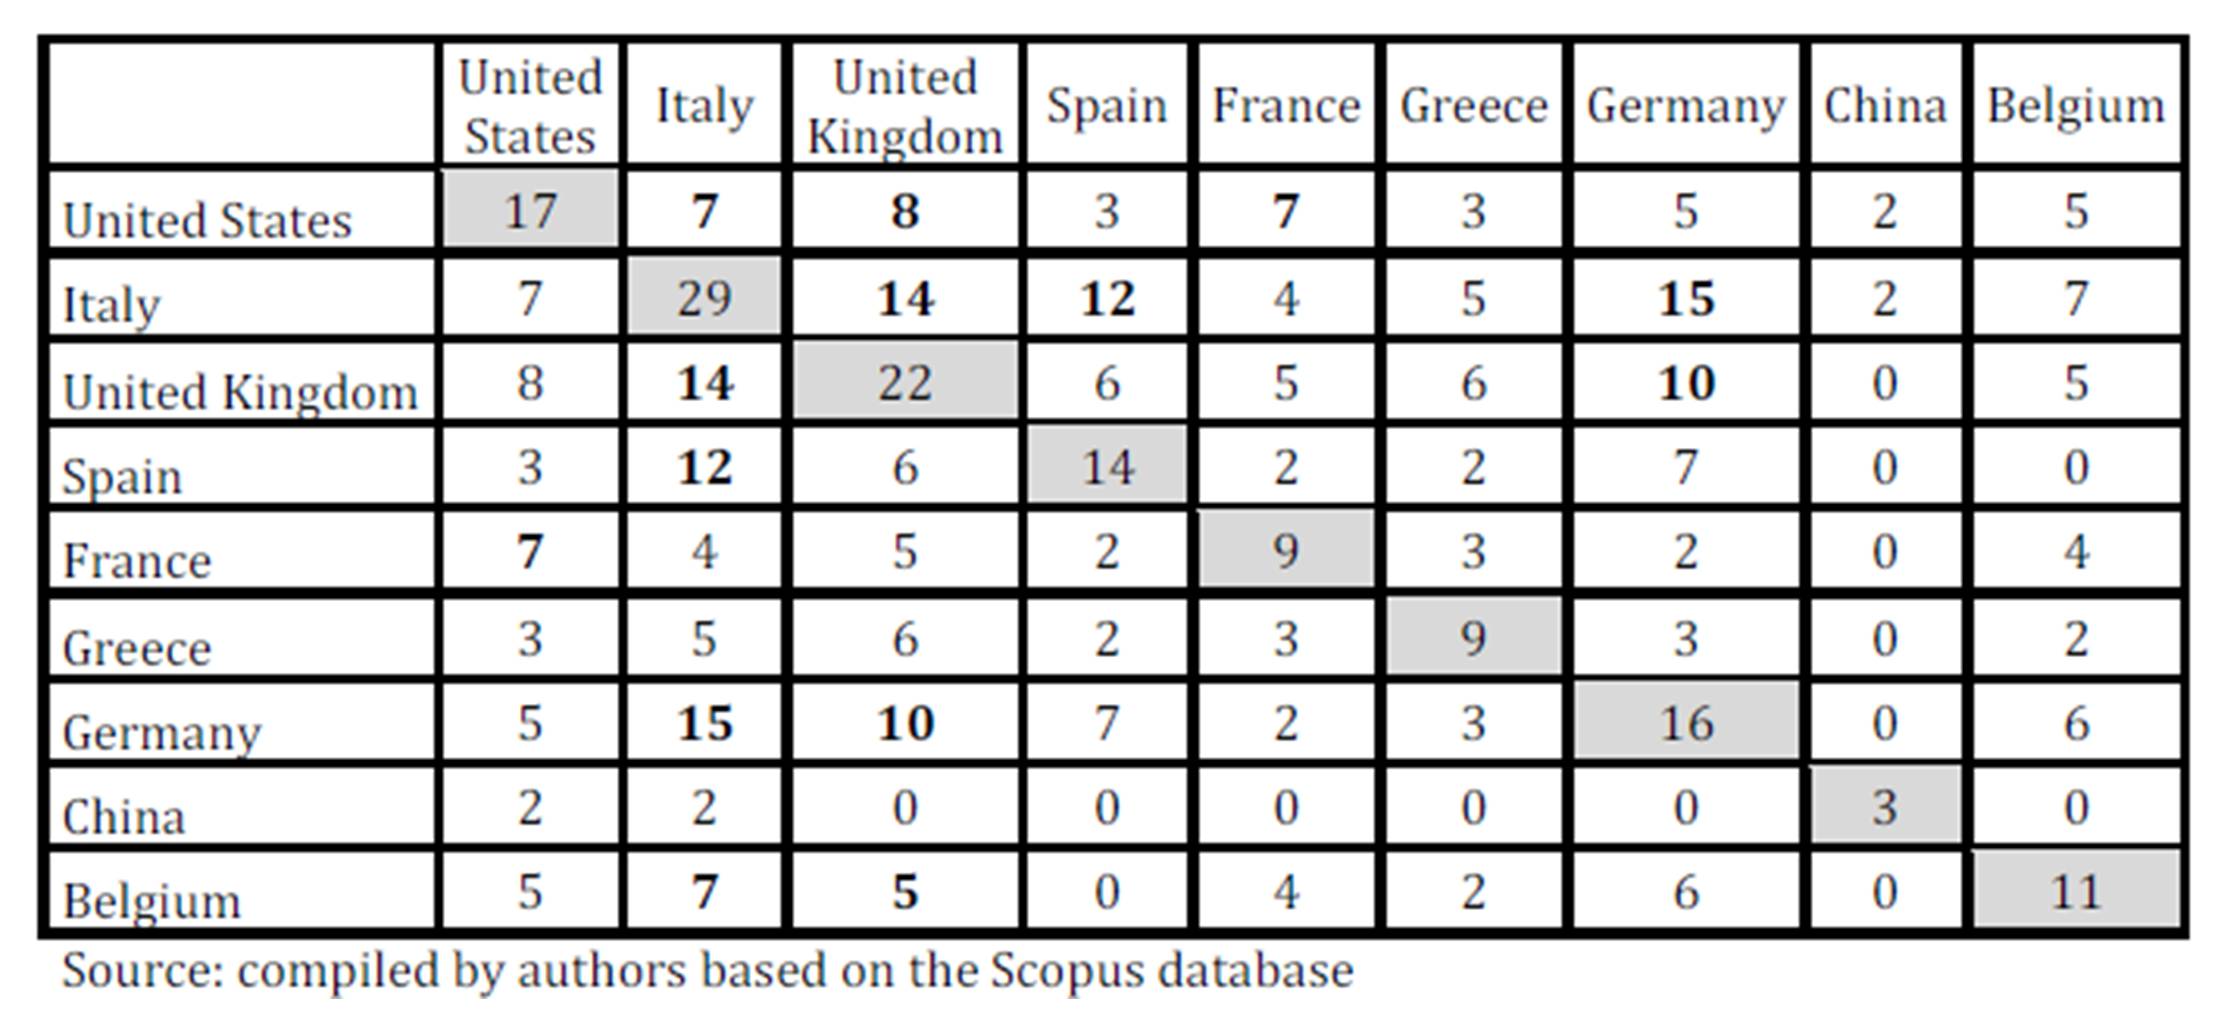
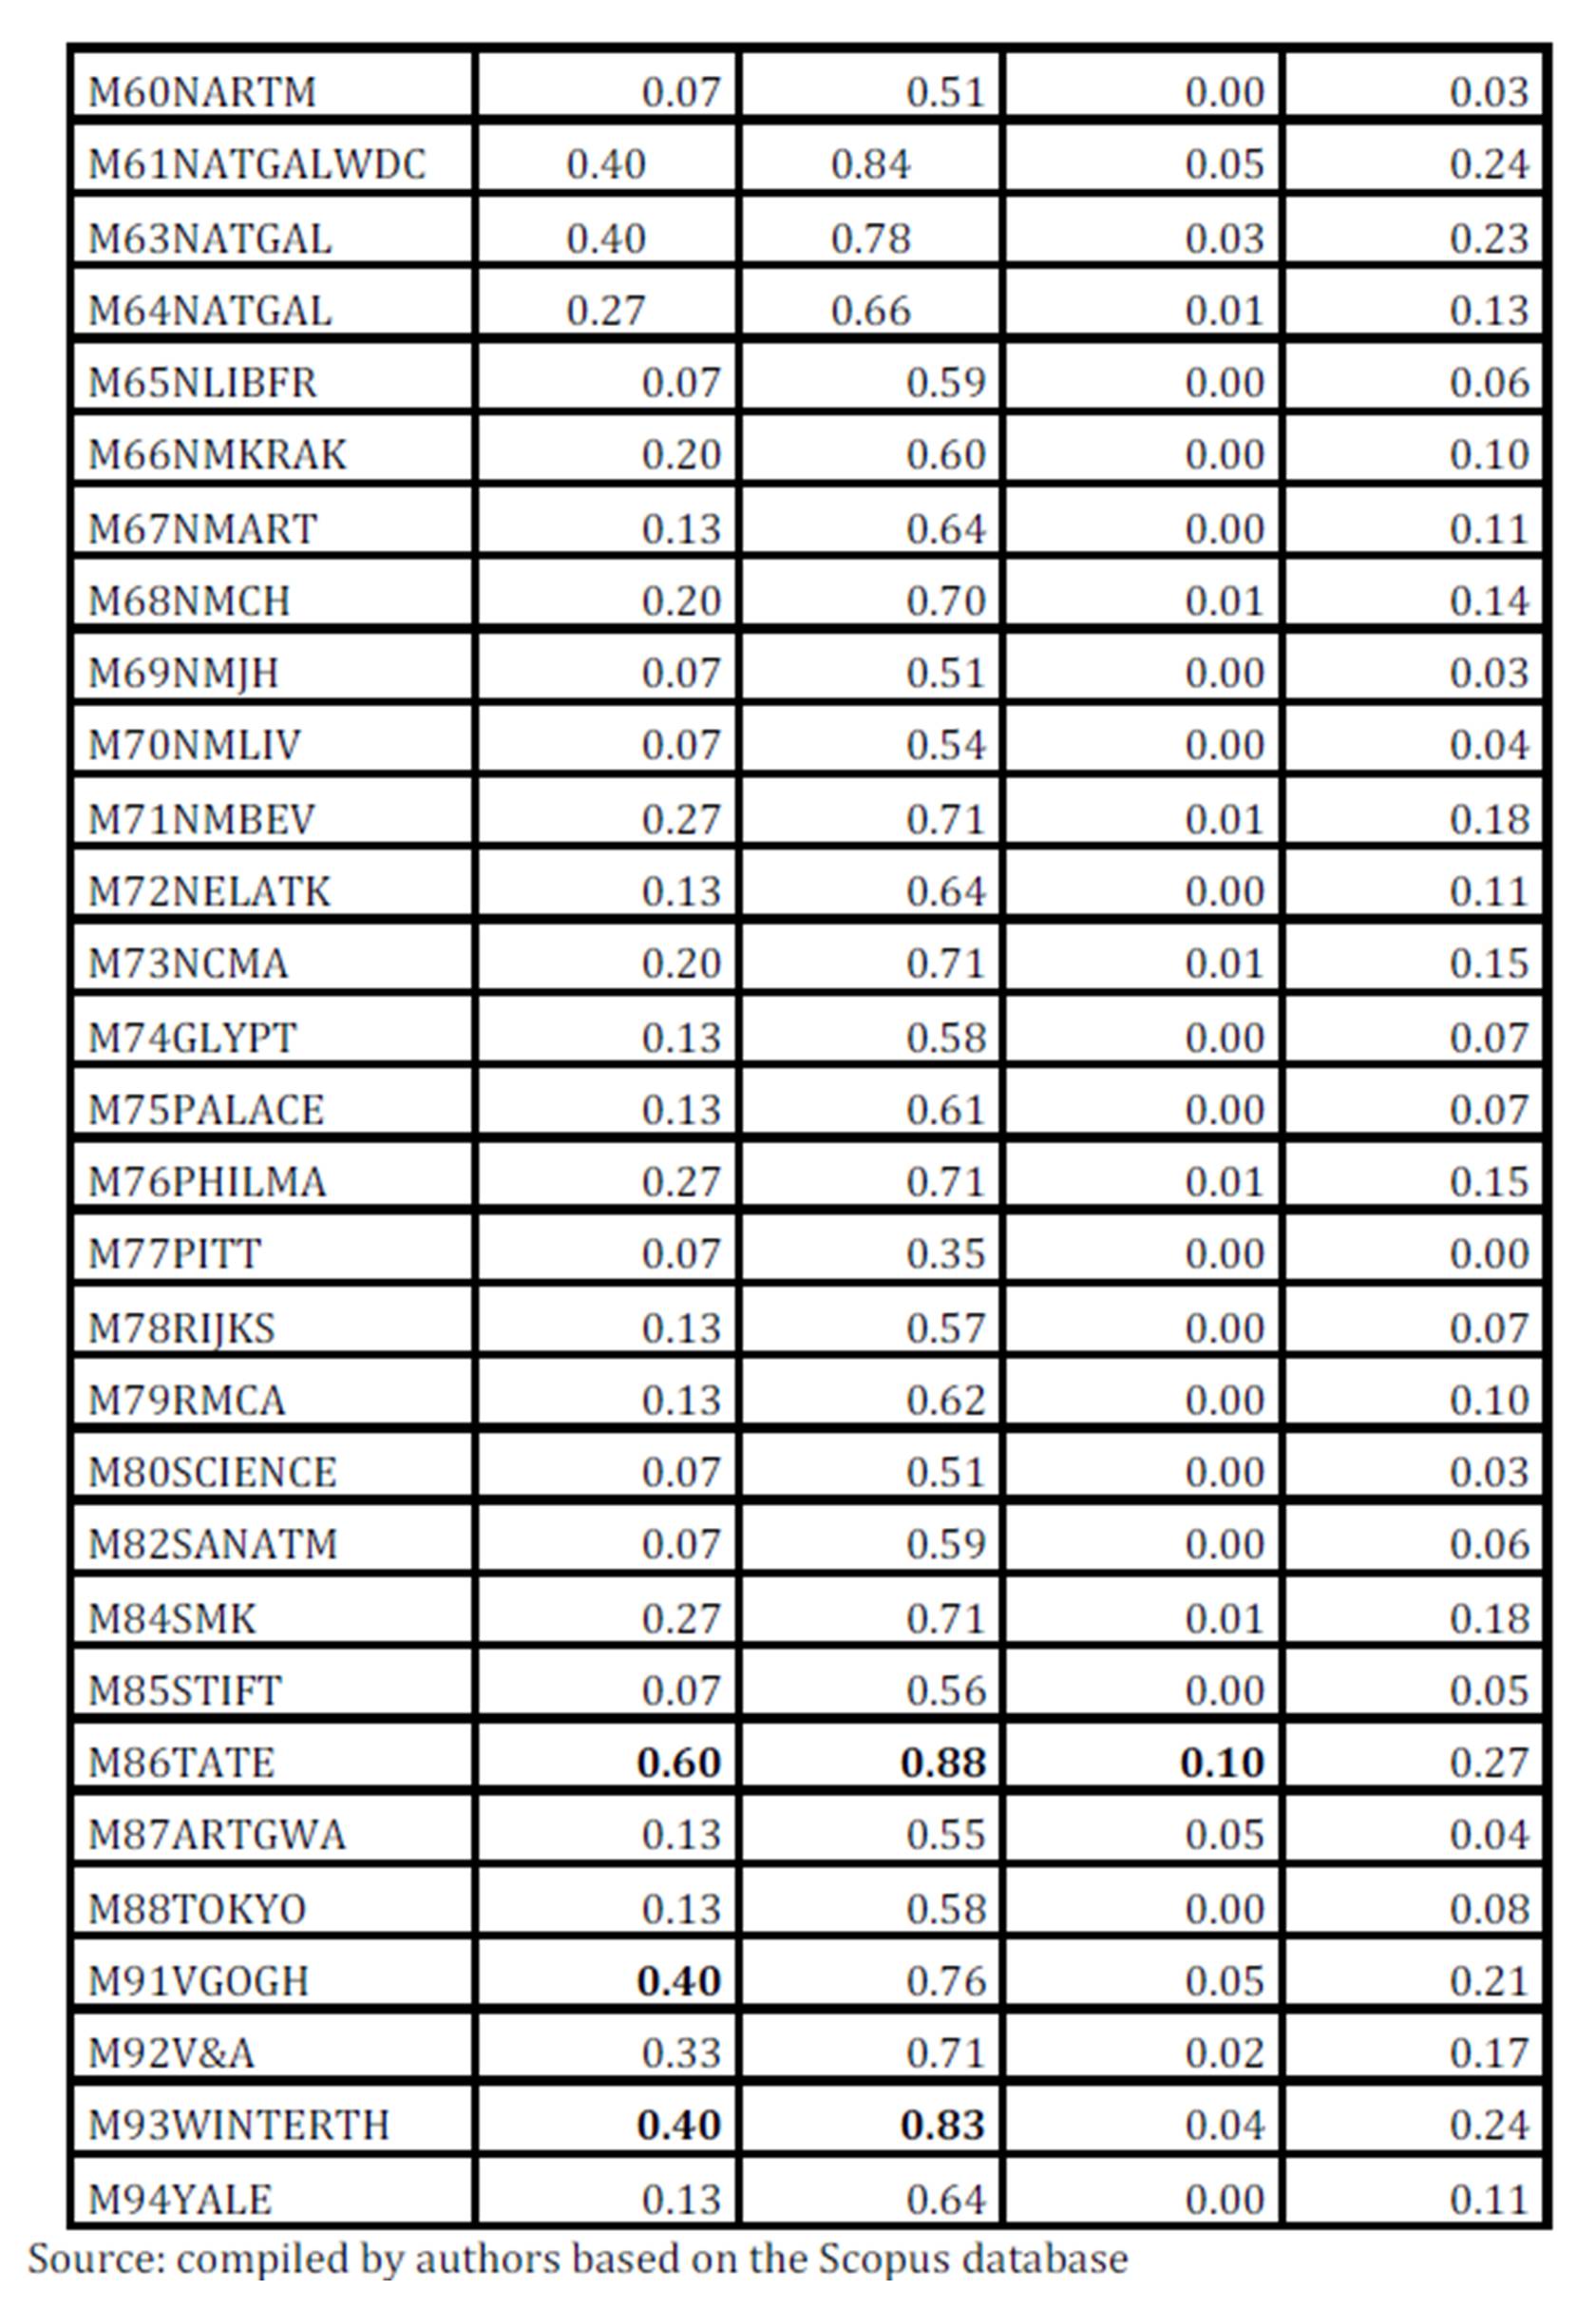
Density indicates that in this network the 17.8% of potential relations is achieved. Moreover, the standard deviation is 2.96, representing high inequality in the distribution of the relations. In the degree column, the higher values are for the important museums, like the Tate (London), the Metropolitan Museum of Art in New York, the Van Gogh Museum (Amsterdam), the National Gallery in Washington DC, the National Gallery in Athens (Greece) and the Winterthur Museum (US). These museums appear in the centre of the network in Figure 3. Concerning the closeness, museums, with more possibilities to coincide with other museums and cooperate with the same institutions, are the Tate, the National Gallery in Washington DC, and the Metropolitan Museum of Art in New York, the Winterthur Museum (USA) and the Art Institute of Chicago. With respect to betweenness, museums with higher values in the column are those that cooperate both with institutions that are important nodes and with institutions that few museums cooperate with. These museums will be in better position to get information from institutions and other museums. Examples in this group of museums are the Tate (London) and the Metropolitan Museum of Art in New York.
Table 3: Centrality, closeness and betweenness for rows (museums)
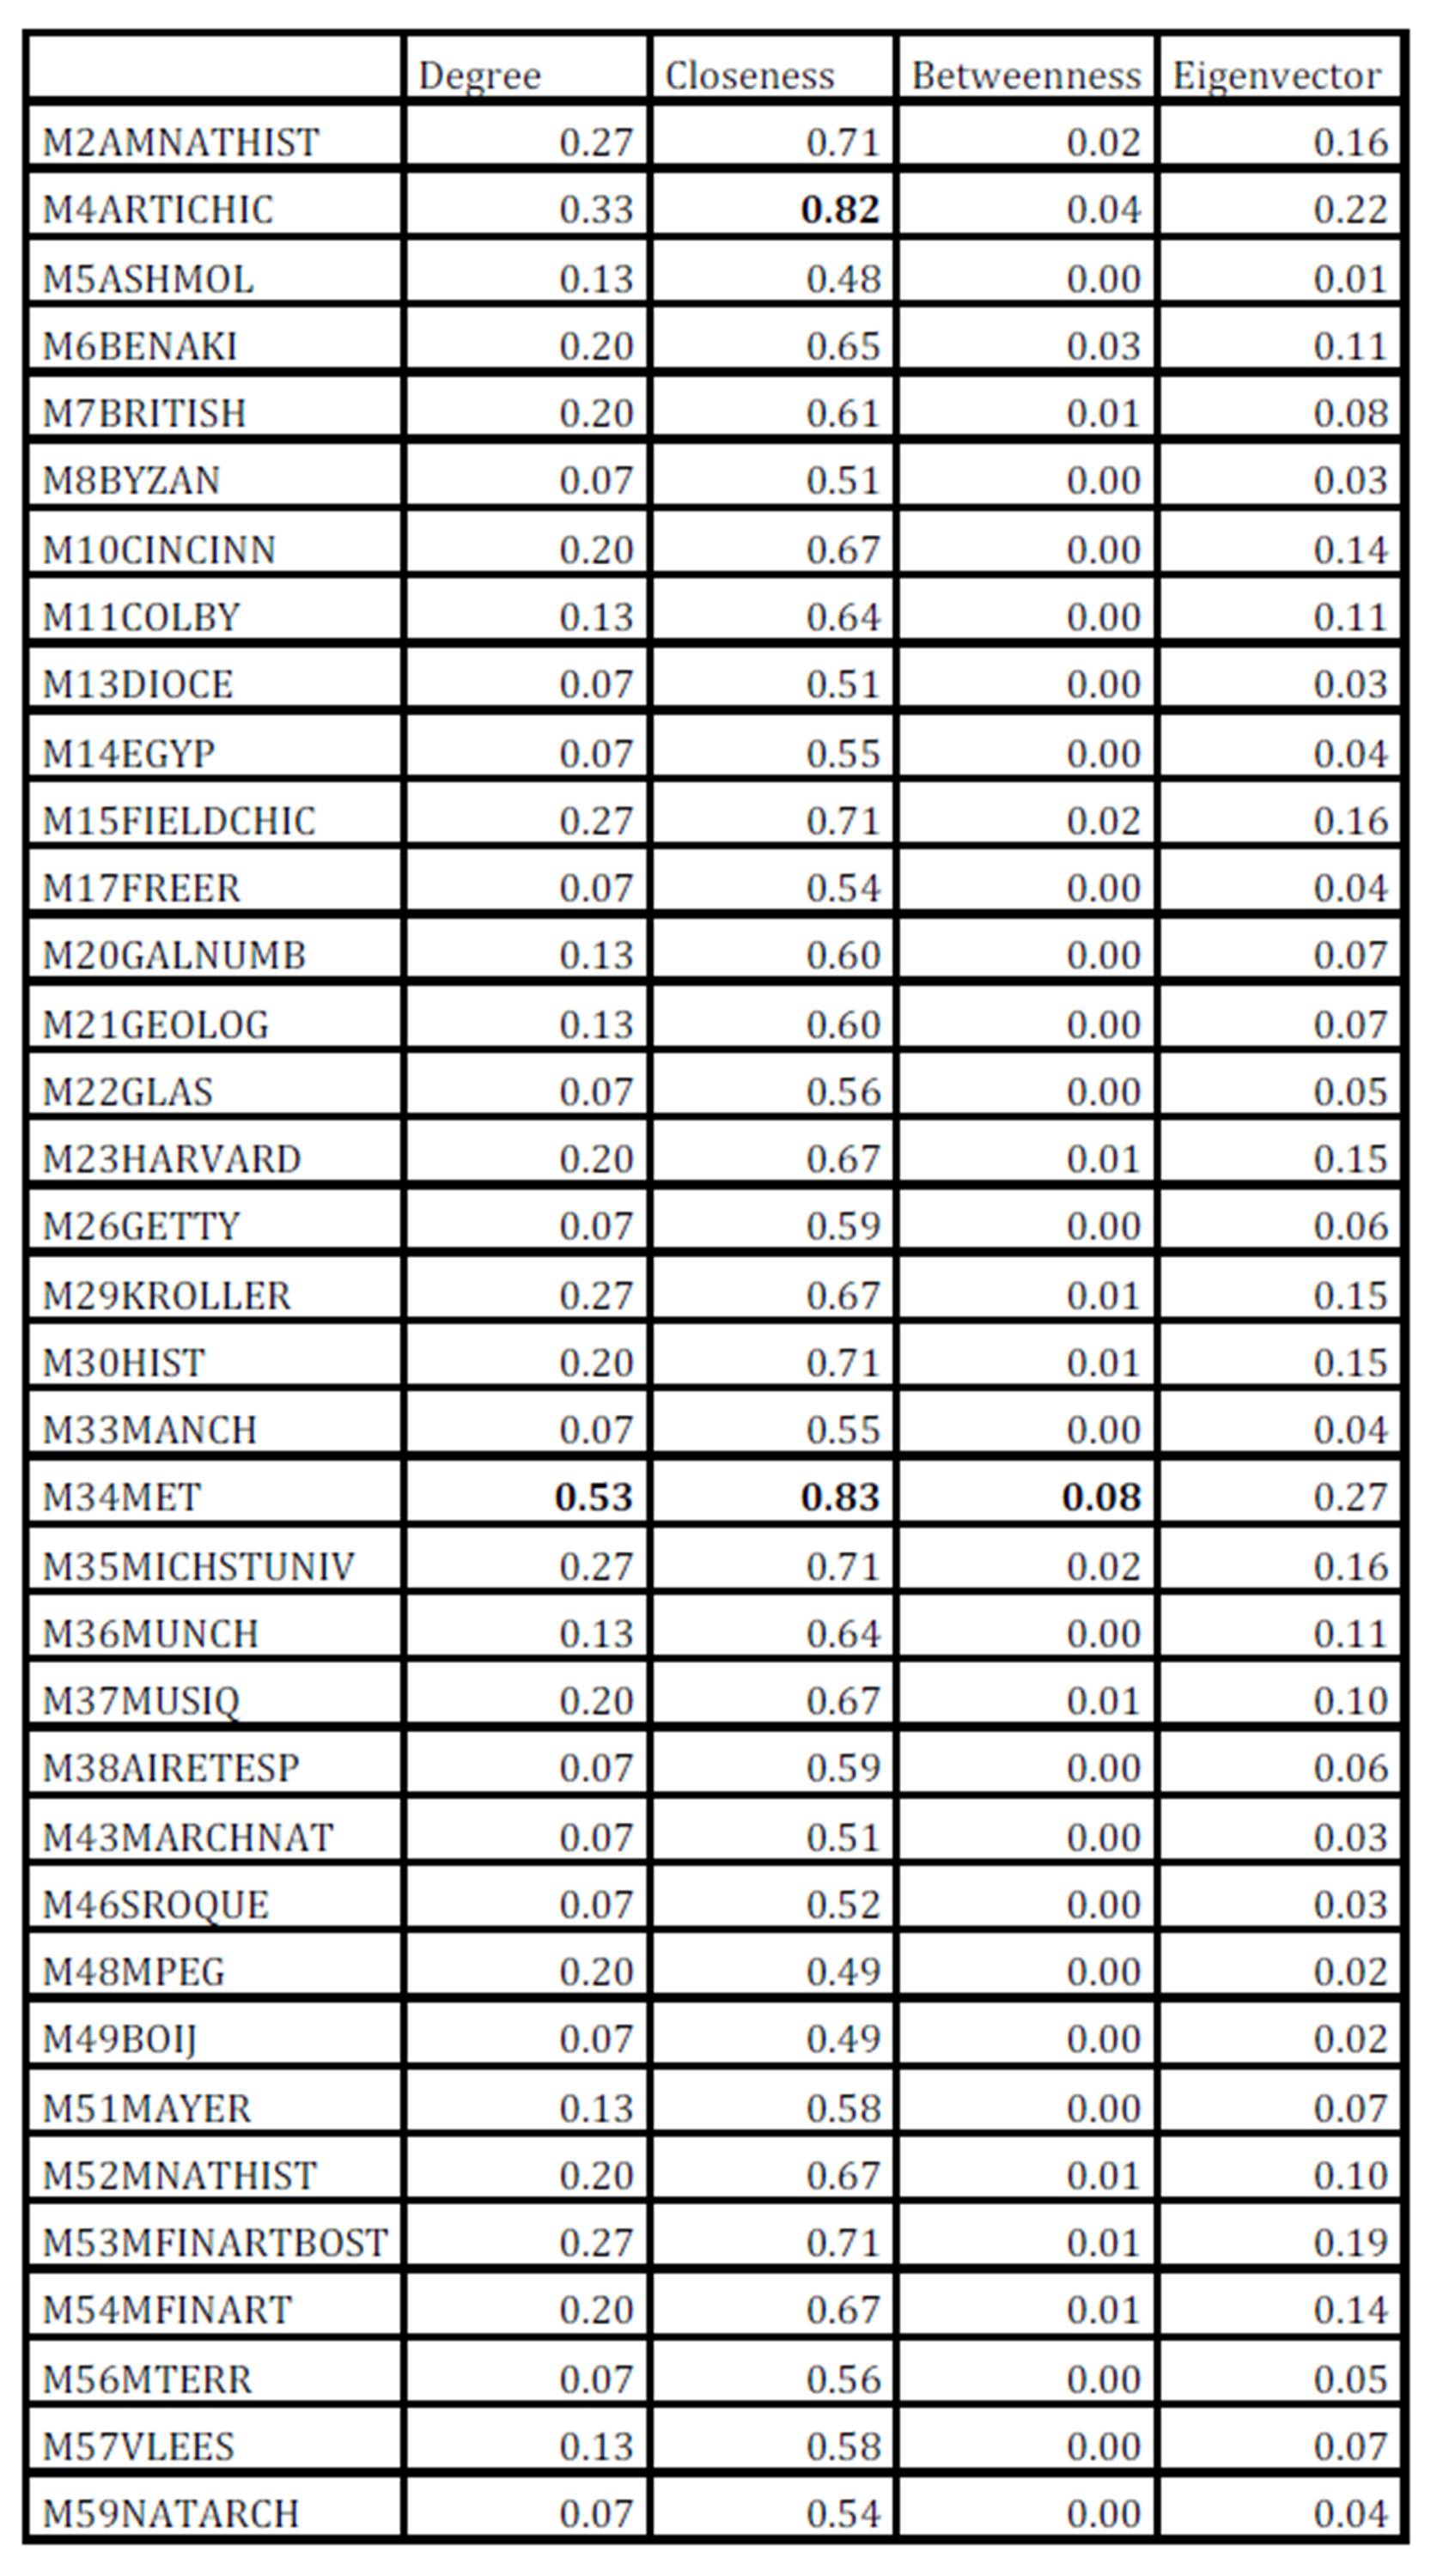
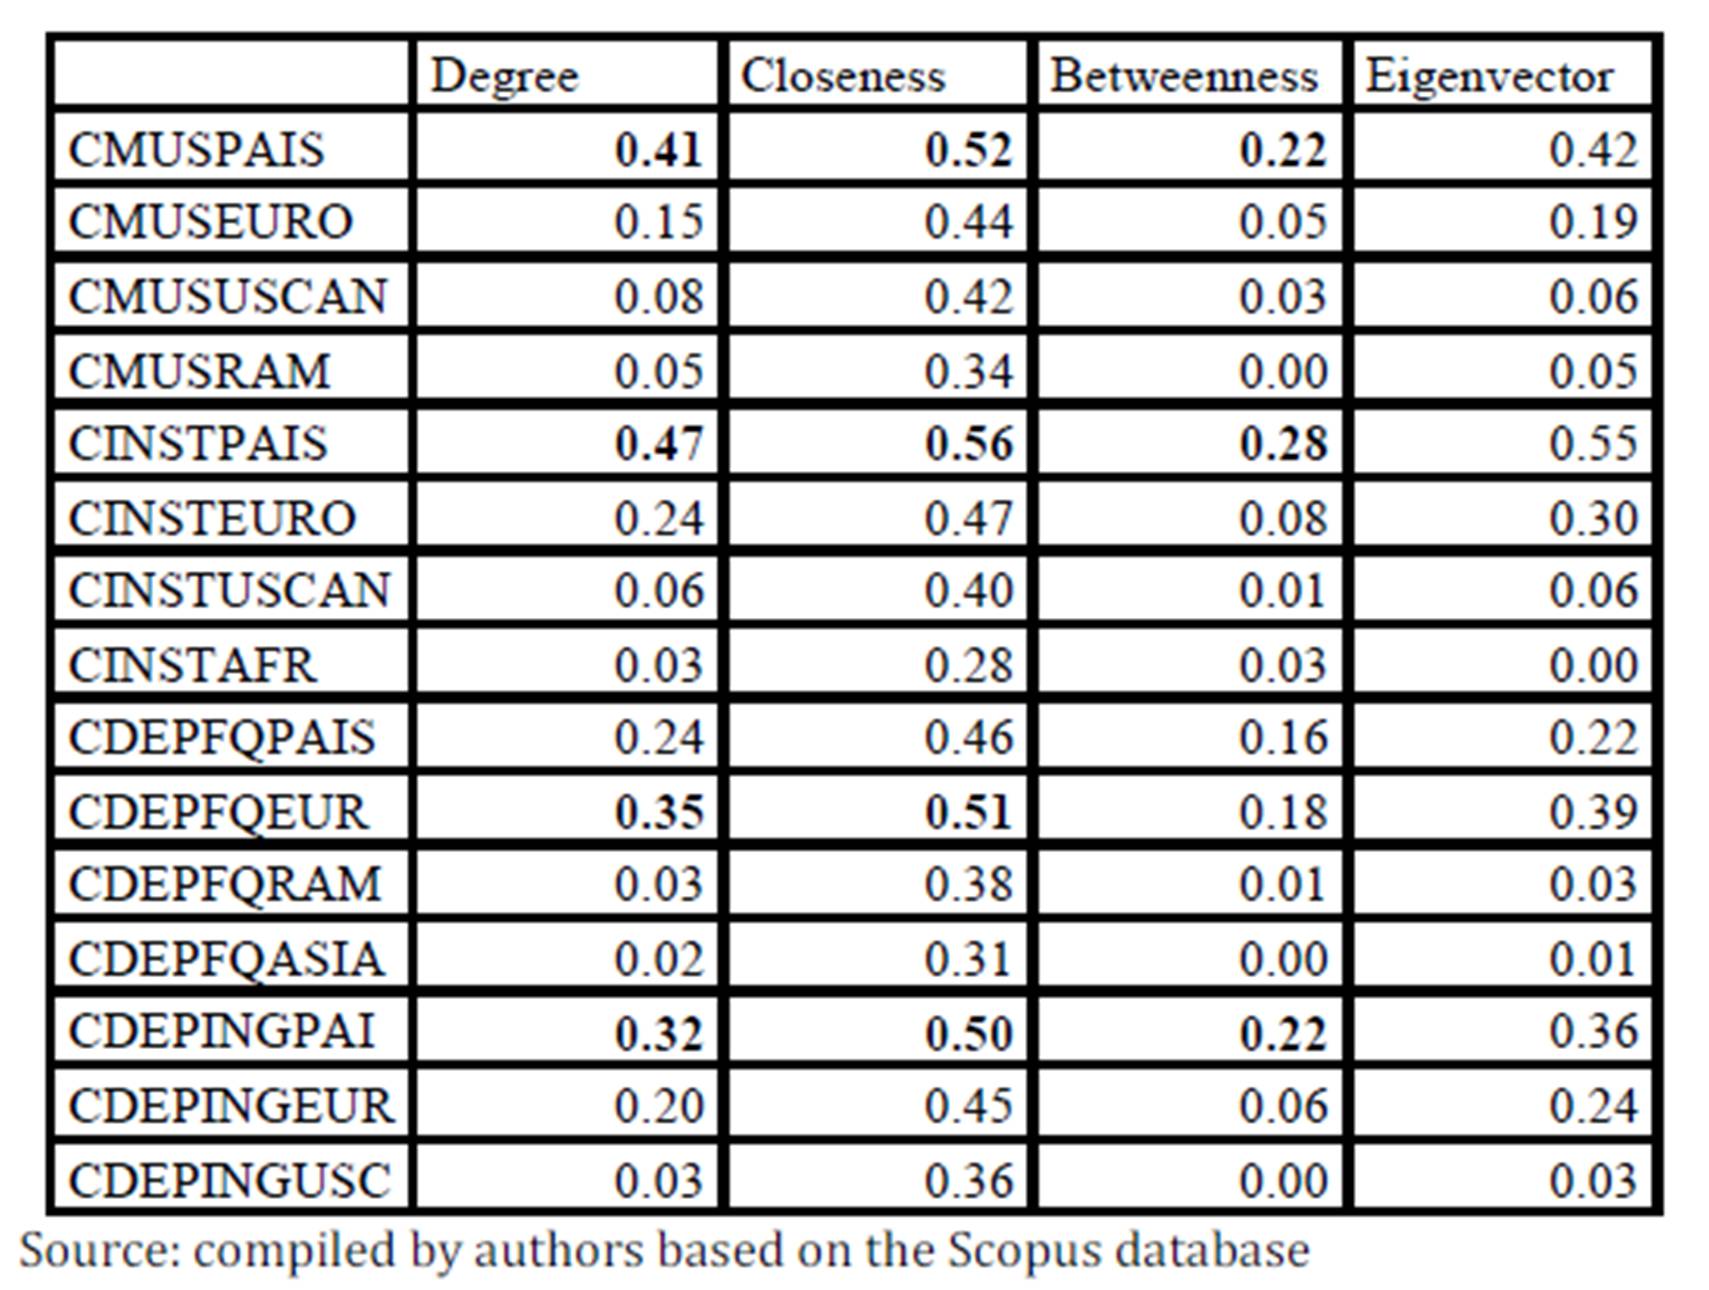
Institutions that are more demanded by museums to cooperate in restoration and conservation are included in Table 4. The higher degree, closeness and betweenness are for institutions located in the museum’s own country, being the most important restoration institutes and other museums.
Table 4: Centrality, closeness and betweenness for columns (institutions)
A broad analysis of data shows that the institutes that cooperate most with museums are the Getty Conservation Institute (Los Angeles), the Courtauld Institute of Art in London, the Centre for Research and Restoration of the Museums of France, and the Institute of Fine Arts in New York. It is important to indicate that the Getty Institute cooperates especially closely with the Tate Gallery.
In this paper, we point out that museums look for analytical and synthetic knowledge. Analytical knowledge is related to chemistry and physics, and museums cooperate with departments in universities related to this type of knowledge. Some examples about the departments which have cooperated with museums are: the Physics Department of the Politecnico di Milano (Italy), the School of Science in Birkbeck College (London), and the Department of Chemistry in Northwestern University (US). In relation to synthetic knowledge, that is, engineering skills, museums have cooperated with university departments like the Department of Material Science and Engineering in Delft University of Technology (Netherlands) or the Bioengineering and Radiology Department in the University of Washington (Seattle, United States).
Papers about the use of science and technology in the restoration and conservation of artworks tend to focus on the different applications of the spectroscopy, like gas chromatography-mass spectrometry. Other important groups of papers cover the use of the electron microscopy and the X-ray diffraction. The use of such advanced techniques explains why museums need to cooperate with other institutions.
Conclusion
This paper focuses on analysing the cooperation between museums and other institutions in the use of science and technology when they are going to restore any artwork. The literature about cooperation in creative activities is scarce, especially in relation to the use of advanced science and technology. Lazzaretti’s (2012) analysis of the restoration cluster in Firenze, Italy, is circumscribed to laser technology.
Our paper analyses the activity of restoration and cooperation in artworks in a global approach, so we are able to differentiate if networks are national or global, and which countries are more important in cooperation.
Data were obtained through a bibliometric analysis of papers’ co-authorship, which gives a wide quantity of data about cooperation in restoration. Then, we have applied network analysis to represent cooperation.
Results indicate that European countries are important participants in the cooperation with both other European and abroad countries. Moreover, there is a pattern in the cooperation between museums and other institutions. Museums tend to cooperate with research institutes and with other museums located in their own countries. Finally, there are important collaborations with university departments of physics, chemistry and engineering. This implies that museums look for analytical and synthetic knowledge out of the museum when they need to apply advanced science and technology in restoration.
Acknowledgments
The authors would like to thank the Spanish Ministry of Economy and Competitiveness and Universitat Politècnica de València (Spain) for funding this research (HAR2012-32060 Project, Research Projects no. 2677-UPV and PAID2012-487-UPV)
References
1. Abramo, G., D’Angelo, CA., DiCosta, F. and Solazzi, M. (2009), ‘University—industry collaboration in Italy: A bibliometric examination’, Technovation, 29 (6/7), 498—507.
Publisher – Google Scholar
2. Aslesen, HW. and Isaksen, A. (2007), ‘Knowledge intensive business services and urban industrial development’, The Service Industries Journal, 27(3), 321—338.
Publisher – Google Scholar
3. Baglioni, M., Giorgi, R., Berti, D., and Baglioni, P. (2012), ‘Smart cleaning of cultural heritage: a new challenge for soft nanoscience’, Nanoscale, 4, 42-53.
Publisher – Google Scholar
4. Bakhshi, H. and Throsby, D. (2010), ‘Culture of Innovation An economic analysis of innovation in arts and cultural organisations’. NESTA. London, UK, http://www.nesta.org.uk/sites/default/files/culture_of_innovation.pdf
Publisher – Google Scholar
5. Bishop, P. (2008), ‘Spatial spillovers and the growth of knowledge intensive services’, Tijdschrift voor Economische en Sociale Geografie, 99(3), 281—292.
Publisher – Google Scholar
6. Boschma, RA. (2005), ‘Proximity and Innovation: A Critical Assessment’, Regional Studies, 39(1), 61—74.
Publisher – Google Scholar
7. Casadio, F., Leona, M., Lombardi, JR., and van Duyne, R. (2010), ‘Identification of organic colorants in fibers, paints, and glazes by surface enhanced Raman Spectroscopy’, Accounts of Chemical Research, 43(6), 782-791.
Publisher – Google Scholar
8. Cotte, M., Susini, J., Dik, J., and Janssens, K. (2010), ‘Synchrotron-based X-ray absorption Spectroscopy for art conservation: looking back and looking forward’, Accounts of Chemical Research, 43(6), 705-714.
Publisher – Google Scholar
9. DCMS (2009), Creative industries economic estimates statistical bulletin. https://www.gov.uk/government/publications/creative-industries-economic-estimates-january-2009
Publisher – Google Scholar
10. De-Miguel-Molina, B., Hervás-Oliver, JL., Boix, R., and de-Miguel-Molina, M .(2012), ‘The importance of creative industry agglomeration in explaining the wealth of European regions’, European Planning Studies, 20(8), 1243-1262.
Publisher – Google Scholar
11. De-Miguel-Molina, B., Hervás-Oliver, JL., de-Miguel-Molina, M. and Hedderich, B. (2013), ‘Do Museums innovate in the Conservation and Restoration of Artworks? Differences between countries’, Dirección y Organización, 50, 17-30.
12. Doménech-Carbó, MT., Silva, MF., Aura-Castro, E., Fuster-López, L., Kröner, S., Martínez-Bazán, ML., Más-Barberá, X., Mecklenburg, MF., Osete-Cortina, L., Doménech, A., Gimeno-Adelantado, JV., and Yusá-Marco, DJ. (2011), ‘Study of behaviour on simulated daylight ageing of artists’ acrylic and poly (vinyl acetate) paint films’, Analytical and Bioanalytical Chemistry, 399(9), 2921- 2937.
Publisher – Google Scholar
13. Doménech-Carbó, A., Doménech-Carbó, MT., Peiró-Ronda, MA., Martínez-Lázaro, I., and Barrio-Martín, J. (2012), ‘Application of the voltammetry of microparticles for dating archaeological lead using polarization curves and electrochemical impedance spectroscopy’, Journal of Solid State Electrochemistry, 16(7), 2349-2356.
Publisher – Google Scholar
14. Kotler, NG., Kotler, P. and Kotler, WI. (2008), Museum Marketing & Strategy, 2ª Ed, Jossey-Bass, Wiley, USA.
Google Scholar
15. Lazzeretti, L. (2012), Cluster creative per I beni culturali, Firenze University Press.
16. Leydesdorff, L. and Rafols, I. (2011), ‘Local Emergence and Global Diffusion of Research Technologies: An Exploration of Patterns of Network Formation’, Journal of the American Society for Information Science and Technology, 62(5), 846—860.
Google Scholar
17. Moreira Teixeira, JC. (2008), La teoría en la práctica de la conservación / restauración del arte contemporáneo, 9ª Jornada de Conservación de Arte Contemporáneo, Museo Nacional Centro de Arte Reina Sofía, Madrid, p. 209-218.
18. OECD (2005), ‘Oslo Manual, 3rd ed. The measurement of scientific and technological activities. Proposed guidelines for collecting and interpreting technological innovation data’. www.oecd.org/dataoecd/35/61/2367580.pdf
19. Papini, F. and Persiani, N. (2004), ‘The enhancement of art assets through the establishment of foundations: the case of the Marino Marini foundation in Florence’. Art Cities, Cultural Districts and Museums. Lazzeretti, L. (ed), Firenze University Press, Italy, p. 139-161.
20. Rafols, I., Porter, A. and Leydesdorff, L. (2010), ‘Science Overlay Maps: A NewTool for Research Policy and Library Management’, Journal of the American Society for Information Science and Technology, 61(9), 1871—1887.
Google Scholar
21. Robinson, DKR., Huang, L., Guo, Y., and Porter, AL. (2013), ‘Forecasting Innovation Pathways (FIP) for new and emerging science and technologies’, Technological Forecasting & Social Change, 80(2), 267-285.
Publisher – Google Scholar
22. Strambach, S. (2008), ‘Knowledge-intensive business services (KIBS) as drivers of multilevel knowledge dynamics’,International Journal of Services Technology and Management, 10(2/3/4), 152—174.
Publisher – Google Scholar
23. Wall, A. and Boschma, RA. (2009), ‘Applying social network analysis in economic geography: framing some key analytic issues’, The Annals of Regional Science, 43(3), 739—756.
Publisher – Google Scholar
24. Windrum, P. and Tomlinson, M. (1999), ‘Knowl- edge-intensive services and international com- petitiveness: A tour country comparison’, Technology Analysis and Strategic Management, 11(3), 391—408.
Publisher – Google Scholar
25. Youtie, J. and Shapira, P. (2008), ‘Mapping the nanotechnology enterprise: a multi-indicator analysis of emerging nanodistricts in the US South’, Journal of Technology Transfer, 33(2), 209—223.
Publisher – Google Scholar