Introduction
It is increasingly suggested that ‘Big Data’ generated by social media holds the key to understanding problems that involve macro-scale interactions between people and services. For example, there has been a number of studies that have sought to monitor and predict the spread of disease epidemics, attracting not only sensationalist headlines (“Twitter Revealed Epidemic Two Weeks Before Health Officials”), but also the serious attention of professionals; see (Chunara, 2012). This has led to the view that there is a wide range of scenarios in which social media data can assist planning including the public transport realm. For example, The Institute for Public Transport Studies at Leeds University has a ‘Disruption’ study exploring Twitter-based research methods in relation to mobility disruption (Barber, 2013). This paper provides a detailed examination of the problems involved in disruption monitoring/planning in the UK rail industry, and an assessment of the ability of social media data to assist in such process. We also present the technology used for dissemination of disruption information, and a brief assessment of the suitability of Cloud provisioning.
Broadly speaking, there are many elements to consider when looking to present genuinely useful transport disruption information to users of public transport – and in particular, rail users. Nexus Alpha has been working in this area for approaching twenty years, developing the first software that made London Underground disruption information available as an XML feed (during the 1990s) right through, to recently developing wireless (GPRS) solar powered information displays for use on rural stations, where the provision of power and fixed line communications is prohibitively expensive.
We first focus on the different types of disruption information, including some information about data sourcing. In particular, we explain the different data sets that need to be considered and their relevance to train users. This primarily includes “formally released” disruption information from the train operator and industry, but there is also reference to the use of social media which many people are increasingly utilising. There is detail about the technology deployed to present this information, and then examples are provided around some of the existing presentation styles. Our key focus is thus on the explanation of the relevance and connection between the different types of data, as without an understanding of this any technical approach and service for customers would be flawed.
Types of Rail Disruption Data/Information
Before determining data source, aggregation method or presentation style, it is critical to understand the different types of information that may affect a passenger’s journey. Before that though, let us rebrand “the passenger” as “the customer” – the term used by the privatised railway. There is a contract here – a supplier (the Train Operating Company, or “TOC”) and a consumer (the customer who pays for the ticket and uses the service), and hence there is a level of service expectation and customer care. Customers “deserve” real time information about train services.
Real Time Information (or “RTI”) is the term generally used to describe (train) “movement data”. This is the type of information that will inform customers that a train is 8 minutes away from their station. The train will have been detected at some point on its journey, and compared against the scheduled time, it should have crossed that point to generate this information. This prediction is of course an informed guess, as the event has not yet happened (the suggestion being that the train will arrive in the future – in 8 minutes time). That is of course only true if nothing happens to the train in terms of disruption in the meantime. The train could be further delayed, or be forced to stop. Or it may have to be diverted and could miss the station entirely.
This predicted guess works well for transport networks that are generally reliable and running well. But what if there is a tree on the track between the train and the customer? Clearly, it was predicted to be 8 minutes away, but in this scenario in 8 minutes time it will still be stationary on the tracks behind the fallen tree.
Therefore, in addition to pinpoint accurate information (at the actual point of detection), we require other information sources to fully inform the customer of what “may” yet happen.
Route Disruption tends to be more “general”, and is not train-centric. Examples could be:
- “train services between and are being delayed by up to minutes because of ”, or
- “train services through are subject to cancellation because of ”.
Comparing these two information types, one is instantaneously accurate (at that point of detection), but remains a guess until the next detection points (admittedly, this is improving as trains are slowly being equipped with GPS tracking equipment providing continual positioning information, but that remains relatively uncommon across UK rolling stock, and even so, is only an affirmation of where the train is “right now”; any future prediction remains a guess, albeit a guess based on instantaneous rather than slightly out of date data); the Route Disruption statements are, by definition, wholly true, yet relatively vague. You “may” be delayed. But we are used to this. By way of analogy, the price of your Vodafone share is currently up 1.6p at 212.03p, but it may go up or down. Right now it’s worth 212.03p (if you ignore the bid/offer spread), but in 3 minutes time? In 3 days time? And what if the market is volatile? Does that help predict the future price? If you have just heard that Lehman Brothers have gone into liquidation, this is probably more useful than knowing the spot price is 212.03p. This is the “real time movement” data, and the “route disruption” information of the markets by way of analogy.
Train positioning details delay, but only if the trains are running and adhering to their planned calling pattern (or “schedule”). There is therefore a third set of data that is useful – Train Disruption (as opposed to train “delays”). To differentiate (for a delay is also “disruptive” to the journey of course), this data set includes whole cancellations where the train doesn’t run at all and part-cancellations, where some of the calling pattern (the stations the service is scheduled to stop at) is altered. The train might “run fast” (miss out stops to catch up time), or might “terminate early” – miss out the final stops. It also includes trains that stop at additional stops (the train will take longer).
The decisions to change the calling pattern of the train (referred to as an “alteration” as well as a “part-cancellation”) is taken by staff in Operation Controls, either as a result of a problem with the train, or to assist returning the train service to the planned services reflected by the published timetable after or during disruption. This is the goal – “service recovery” as it is referred to – to return the network to scheduled operation, so that capacity is maximized again, and “normality” and “predictability” restored.
We therefore have movement data (automated – delivered by signalling systems or on-board GPS over GPRS or 3G/4G), train disruption (decisions taken by TOC staff to mitigate overall disruption), and route disruption (reports of problems often caused by infrastructure and thus generally the responsibility of Network Rail). Sitting behind this data set is a published national annual timetable, added to periodically with both planned and short term unplanned engineering works. Thus, STP (Short Term Planning) and VSTP (Very Short Term Planning) information sit as a layer on the planned timetable data. The disruption information detailed above (the snapshot, the decisions, and the problems) reflects the “VVSTU” information or Very Very Short Term Unplanned information.
These reflect official information sources. In the Twitsphere and Blogsphere, there is now a mass of unstructured, unprocessed, unverifiable information being shared proactively and almost instantaneously between customers when they experience disrupted train service. This is “experience” information, and sometimes it complements what is being reported. Equally, it can often contradict information being presented “officially”, if only through it being available before industry-generated information is disseminated.
Whilst a TOC may be reporting “no problems”, a customer may be on a train that has just stopped because there is livestock on the line. “So much for no problems – they are not being honest”, they may Tweet. But it takes time for any information to be gathered and communicated. If there is GPS on the train, then the train will soon be reported as being 1 minute late, and then 2 minutes late as it continues to sit behind the herd of cows gently ambling across the track. But in this information society, we expect to know why we are being delayed, and how long we will be delayed. We have put our journey in the hands of others. Should a member of staff ask the cows how long they will be? With Big Data, perhaps we can provide information relating to bovine meanderings and guess how long they will take to cross; or with tracking devices on the cows perhaps this information will be available in real time. Or perhaps the farmer should just close the gate. In this scenario, perhaps knowing how far away the farmer is, would be far more useful than knowing that you are currently 2 minutes late.
What looks like a train on fire might be a fire extinguisher going off. What seems like an initially unexplained delay on a train with no guard and only a driver might be as a result of a person tragically being hit by a train, with the driver instantaneously traumatised. In an environment where safety is at the very heart of the industry and all operations, time to solve problems and determine the safest thing to do often takes time. Actions will not be instant or knee-jerk. But increasingly, expectation is that the information flow needs to be accurate and near instantaneous. And just to remember lest we forget – what is being attempted here is give customers a view of a future that is yet to unfold. Clarity becomes mist and fog relatively quickly in the future, and out of all this, the customer must somehow be presented with “the facts”, and be (or feel) empowered enough to potentially make a different journey decision.
Stay at the office for a bit longer, or go down the pub? Stay at home with the family for an extra 10 minutes in the morning. These data (and the information it generates) have significant social and personal impact and benefit. They deserve care.
Sourcing the Data
Tyrell IO (NexusAlpha#5, 2013) systems are used by the TOCs to transmit route disruption and train disruption information, as well as planned engineering works and issues with station facilities. (Station facilities are particularly important for those who may be visually impaired or have particular accessibility requirements – it’s all very well knowing that the train is on time, but if you are a wheelchair user and the lifts are currently out of order to reach your platform, the services may as well all be cancelled for the use that they will be.)
Timetables are available from Network Rail, and under their Open Data initiative, other data sources such as movement data are becoming increasingly available. (To date, the movement data in this context does not include industry agreed prediction – just the snapshot positioning, and so make up times – there is sometimes some spare time built into off-peak and longer running services – and estimates about likely final arrival times derived by those consuming this data could contradict the “industry view”, which is published by National Rail Enquiries – itself, owned by ATOC Ltd – a commercial arm of the Association of Train Operating Companies.) The DARWIN CIS project (a cross-industry initiative) is designed to provide a uniform cross-industry view of disruption to eliminate differences between localised systems, although it will necessarily provide data at a higher already-integrated level in order to eliminate these potential information disparities, and will not feed back into Network Rail signalling systems.
Data sent through Tyrell IO are highly structured and can be automatically processed and interpreted for filtered presentation. Network Rail sends out structured data as well, which is increasing the level of detail that the TOCs have regarding how long incidents will most likely last, and thus how long service disruption is likely to continue for. The logistics involved in moving rolling stock and crew to the locations that they need to be in after major disruption are very significant.
In terms of social media, the current view is that it is very challenging (though not technically) to aggregate customer-generated data from the Twitsphere and the Blogsphere into the “official” data sets. The issue is that without manual moderation (which is very human-intensive), anything that anybody posts could be presented as an official data source. This information – which as well as being just plain “wrong”, could also be offensive – and thus “institutionally damaging”. Thus, when the TOCs post information on Twitter, it is differentiated from other information presentation, and to some extent, at arms length in terms of the published replies that are likely.
The approach being worked on is therefore to make Tweets from the public readily available for integration with official output in a convenient way, so that members of the public are adding richness and useful content; this can be made available to the large numbers of people signed up to the TOC Twitter accounts. Thus, the official stamp of recognition (a re-Tweet) can be given to high quality and useful updates. A second tier of crowd sourced, or rather crowd-published data – for the public are making use of a media channel owned by the train operator – will still add a potentially valuable layer of content. Whilst it won’t be endorsed, and a “layer down” in terms of default Twitter presentation, it’ll be present – there is now no avoiding such. Publish on an “open media channel”, and others will join in.
Facebook is not considered particularly relevant for real time disruption information distribution. It tends to be a slightly “softer” output rather than the hard hitting “facts” of Twitter, reflecting less instantaneous information.
Data Aggregation and Presentation
A key differentiation here is “presentation integration” as opposed to “data aggregation”. Presenting an aggregated view of these different types of information allows neural networks (our brains) to read it, assimilate the content, and work out the likely impact on our own personal journey. For different people, the result will be different given the same information presented. If you are picking up a child from school, you have to arrive on time so if there is major disruption, an alternative travel plan might be the only option.
However, if you are on the train working (hypothetically) on, say, a paper about travel disruption, having completed the Great North Run in 1:22:42 (actually, not hypothetically – a new “personal best” for the author) and the train is delayed by thirty minutes (theoretical – it was on time), does it really matter?
JourneyCheck (NexuuAlpha#1, 2013), JourneyCheck Alerts (NexuuAlpha#2, 2013) and JourneyCheck Rainbow Boards (NexuuAlpha#3, 2013) offer the delivery and presentation of this information in different ways.
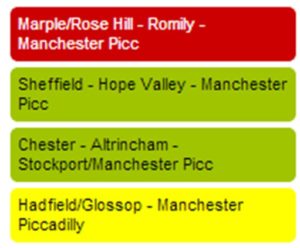
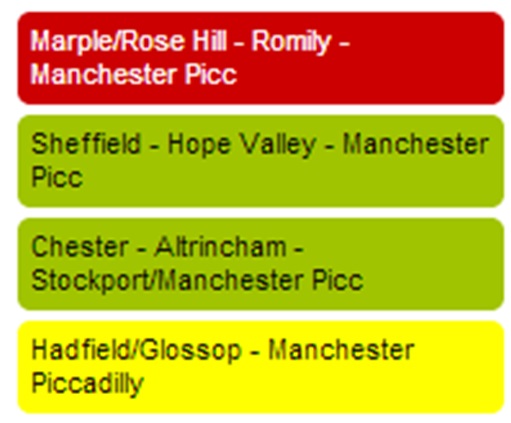
Figure 1: Sample Journey Check Rainbow Board Output for Northern Rail
Rainbow Boards take route disruption information, movement data and train disruption, and compare the service frequency and disruption against the timetable on a rolling 60-minute basis. Depending on the level of route disruption, or the proportion of train disruption against the planned service, different disruption levels are determined – generally, good service, minor delays, and major disruption – green, amber and red, if you like. Thus, the very detailed aggregation and calculation of key criteria against thresholds results in just three outputs. It’s a top level overview – a “heads up”. It is useful if you are travelling “soon” and want to know if the journey is likely to be as expected. But it doesn’t tell you if your next train is delayed or not.
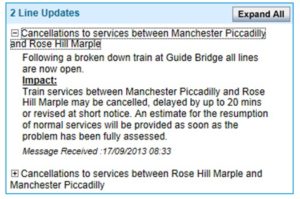
Figure 2: Route Disruption corresponding to the Rainbow Board as shown in Figure 1.
For detail, there is JourneyCheck which presents the data used to calculate the route disruption level indicated on the Rainbow Boards. An example of route disruption message is shown in Figure 2.
This indicates that there “may” be cancellations and delays of up to 20 minutes. This increases the granularity of information available to the customer, giving them an additional set of information to influence decision making. This is a future view.
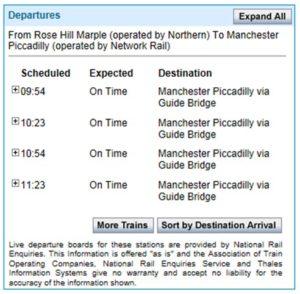
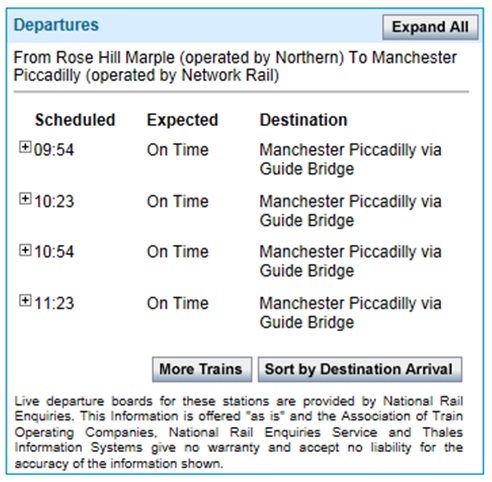
Figure 3: Live Departure Boards corresponding to the Route Disruption in Figure 2.
Finally, there are the actual Live Departure Boards showing the best guess as to what is expected. An example is shown in Figure 3. This is generally quite accurate on the basis that trains already delayed tend to continue to the end of their journey with approximately the same level of delay, although as pointed out earlier in this paper, it remains a total guess, albeit probably an accurate one – unless the network remains heavily disrupted in which case delay information (in particular) is often useless.
The information shown in Figure 3 is sourced from National Rail Enquiries DARWIN system rather than the Open Data Network Rail source, and thus the information is presented as a view of the timetable with integrated train disruption (Tyrell IO also feeds DARWIN directly so the information corresponds to any train disruption explicitly shown in JourneyCheck rather than merely via the live departure boards). Whilst all of these trains are expected “On time”, the line of route information above suggests that it is likely that they may be delayed on route.
Technical Delivery
Delivering these services to customers reliably is not without its challenges, and has required careful design. On a quiet day when the network is undisrupted and services are running to time, there may be relatively few enquiries. Yet, on a day with severe disruption (for example, nationwide snowfall), many millions of page requests can be received. The balance is to provide a service which offers good value, yet is highly scalable. Whilst The Cloud offers huge scalability opportunities, resilience and availability are outsourced, a potential cause for concern in terms of guaranteeing service delivery. There are clearly commercial challenges with providing “infinite scalability”.
JourneyCheck & JourneyCheck Rainbow Boards
The systems use the following technologies:
- Round robin DNS configuration distributing load to apache servers over two locations.
- Apache servers configured to serve static content directly, and proxy dynamic content requests to multiple load balanced Tomcat servers using MOD_JK.
- Tomcat servers are configured in a cluster allowing for session sharing and therefore fault tolerance.
- Tomcat runs the Java based JourneyCheck web application;
- The application makes heavy use of Spring frameworks relying on Spring IOC, MVC, RPC, Security and its Hibernate integration (Deinum, 2012).
- Hibernate is used to store runtime configuration data directly in to an MS SQL Server 2008 R2 database.
- Distributed EHCache caches are used to synchronously share data.
- JourneyCheck sources its data from a secondary set of applications via Spring RPC (HTTP Invokers), which are themselves Java/Spring based; (Ho, 2012)
- These applications together receive data from multiple sources and communicate with a central repository via Apache CXF based JSON/RESTFul web services where data are aggregated and stored (Richardson, 2007).
- Storage at this level is again achieved using hibernate and is on more MS SQL Server 2008 R” Database servers.
- Transient data storage which provides a contingency against communication failure between applications is achieved using locally run Mongo DB instances.
JourneyCheck Alerts
Fronted by JourneyCheck, the JourneyCheck Alerts functionality is provided by a number of interconnected applications distributed across multiple servers. Most applications, categorised by the role they play in the overall process are duplicated allowing for redundancy and therefore a level of fault tolerance. Each application performs a distinct role which when combined together allows for the monitoring of user journeys and production of associated disruption alerts.
Each module of the system uses a different set of technologies to perform its individual role, along with core technologies used across the application as a whole. These include JMS messaging (using Open MQ) for the posting and queuing of alerts to be processed, Spring RPS for intra process communications, Spring JDBC and Hibernate as appropriate for database communications.
All modules utilise PostgreSQL databases (Obe, 2012). SOAP (Simple Object Access Protocol) based web services are interfaced to for third party data sources and Freemarker templating is used for the construction of alert messages. A Spring MVC/Spring Security based web application provides monitoring and administration functions and uses EXT JS coupled to AJAX services to provide the User Interface (Deinum et al, 2012).
Future Services and Concluding Comments
The services developed to date utilize the UK Rail Geographical Data Model data set (NexusAlpha #4, 2013) developed by Nexus Alpha. This holds topological information relating to the connectivity of the whole of the UK rail infrastructure, and allows train disruption to be mapped to route disruption, and thus users of JourneyCheck and JourneyCheck alerts to view only (ore receive) information that is likely to affect their particular journey. This personalisation is key when drilling down in the information.
As more data become freely available via Open Data initiatives and through enhanced technical provision, there becomes much more opportunity for closer data integration within the presentation layer. Here, now that some earlier restrictions on the presentation style of live departure boards appear no longer applied (the boards are now presented in many different styles on the Internet and mobile Internet), there is again, the increased opportunity to present more tightly aggregated data. Thus, information provision will continue to improve, with a seamless journey-centric temporal view of the future possible through the geographical coupling of data, and the ability to combine timetables with real time disruption.
Paramount to service disruption presentation is an understanding of the actual types of disruption information. Crowd-sourced customer-reported disruption clearly has a key role within the information space which it is already fulfilling. However, to upgrade this information to “approved” status automatically without manual moderation could ultimately undermine confidence in the “official” data sources as there could be conflicting reports. There is also the potential for institutional damage should certain content – including images – be seen as being published by the transport operator.
To conclude, it is likely that there will remain two disaggregated data sets for some time. A view of what is happening and what will most likely happen published by the TOCs (those providing the service), and a view of what is happening published by the travelling public (those consuming the service). It is very possible that information about the “hear and now” from the public will add value – but the TOCs are likely to have a better view of the future, albeit with a warning attached – it is a view of the future which is yet to happen.
The next generation of JourneyCheck systems will be released in 2014.
(adsbygoogle = window.adsbygoogle || []).push({});
References
Barber H, Shires J, Ferreira A and Marsden G (2013) “Exploring Twitter-based research methods: A critical review focused on mobility disruptions”, Online, Leeds University, Last Accessed 10/09/2013, http://tsh.leeds.ac.uk/wp-content/uploads/Holly-Ann-Twitter-Mobility-Disruptions.pdf
Chunari R, Andrews J and Brownstein J (2012) “Social and News Media Enable Estimation of Epidemiological Patterns Early in the 2010 Haitian Cholera Outbreak”, American Journal of Tropical Medical Hygiene 2012 vol. 86 no. 1 39-45.
Deinum M, Serneels K, Yates C, Ladd S and Vanfleteren C (2012), Pro Spring MVC: With Web Flow, Apress Media LLC, U.S.A.
Ho C and Harrop R (2012), Pro Spring 3, Apress Media LLC, U.S.A.
NexusAlpha#1, JourneyCheck, available at http://www.nexusalpha.com/index.php?location=4.1, last accessed on 25/9/2013
NexusAplha#2, JourneyCheck Alerts, available at http://www.nexusalpha.com/index.php?location=4.2, last accessed on 25/9/2013
NexusAlpha#3, JourneyCheck Rainbow Boards, at http://www.nexusalpha.com/index.php?location=4.4, last accessed on 25/9/2013
NexusAlpha#4, UK Rail Geographical Data, at http://www.nexusalpha.com/index.php?location=3.8, last accessed on 25/9/2013
NexusAlpha#5, Tyrell IO, available at http://www.nexusalpha.com/index.php?location=3.1.2, last accessed on 25/9/2013
Obe, R. and Hsu, L., (2012), PostgreSQL: Up and Running, O’Reilly Media, USA.
Richardson, L. and Ruby, S., (2007), RESTful Web Services, O’Reilly Media, USA.
Notes
Unplanned information: This is not a published acronym, merely illustrative.
JourneyCheck (NexuuAlpha#1, 2013): See examples at http://www.journeycheck.southwesttrains.co.uk/southwesttrains, and
http://www.journeycheck.com/northernrail
JourneyCheck Alerts (NexuuAlpha#2, 2013): See registration example; see https://www.journeycheck.com/southeastern/registration
JourneyCheck Rainbow Boards (NexuuAlpha#3, 2013): Example TOC home pages at http://www.arrivatrainswales.co.uk/Home.aspx, http://www.greateranglia.co.uk/ and http://www.scotrail.co.uk/