Introduction
Taxation convergence within the European Union has long been one of the main goals of the fiscal policy decision making factors. The main reason for this ever growing interest in fiscal convergence is the fact that the greater part of the revenues of all the member states of the European Union come from fiscal revenues. With laws to facilitate the migration of companies from one member state to another and as each country strives to attract foreign investors, tax competition has become a major issue in the European Union. One way of avoiding further controversies on weather tax competition is legal or moral, is to ensure tax convergence among the member states.
There are numerous studies on the matter, focusing either on convergence regarding the VAT, or indirect taxes in general, or talking about converging fiscal pressure in the EU and the need for tax competition that some member states still fell. However, most of these studies focus on the 15 member states up until 2004. And this is a major problem because with the enlargement in 2004 and 2007, the EU has almost doubled its number of members. Therefore, none of the results obtained for a research sample including just the previous 15 member states can be extrapolated for the entire European Union as it looks today.
This is why we believe a new study on the matter of tax convergence in the EU is both necessary and useful. All the studies done previously for the EU-15 are now only relevant as a benchmark for comparisons, but they are no longer reliable as far as decision making and policy analysis are concerned. Our study is intended as a small step in filling this gap.
Literary Review
In the area of fiscal convergence, Esteve, Sosvilla and Tamarit (2000) find evidence of convergence of total fiscal pressure in the European Union for the period 1967-1994. They use sigma and beta convergence with a convergence rate of 2.4% and set Germany as a benchmark in order to study the existence of a catching-up effect for the rest of the member states. Sosvilla, Galindo and Alonso (2001) study the tax burden in the EU for the period during 1967 and 1995. Their conclusion is that convergence has not been continuous and took place only in the periods between 1967-1974 and 1984-1995.
Most of the existing studies on taxation convergence use techniques of sigma or beta convergence, as they were presented in earlier economic convergence literature such as Barro and Sala-i-Martin (1992). In a more recent study on the matter using the same two techniques mentioned earlier and adding gamma convergence to the study methods used, Delgado Rivero (2006) also states that his results suggest the existence of convergence of the tax structure and of fiscal pressure in the overall period during 1965-2003, but that the process has not been a constant one, reaching a climax of convergence between 1975 and 1990 with no major progress made afterwards. Avi-Yonah (2010) writes about the existence of tax convergence between 1980 and 2010 among the OECD member states, basing this on the fact that more and more countries have adopted the VAT in recent years. However, this is not an empirical study and a considerable part of it is dedicated to explaining the advantages of tax convergence.
Bearing in mind that all of the mentioned research was conducted only for a European Union with 15 member states, our current study aims to analyze fiscal convergence in the European Union as it is today, with all its’ 27 member states. We will use the technique of cluster analysis, which allows objects (countries, in our case) defined by more than one characteristic (fiscal pressure and indicators that describe the tax structure, in our case) to be classified in groups (clusters of converging fiscal systems, in our case) based on the similarities of their characteristics.
The remainder of this article is structured as follows: section 2 describes the database used and the way in which the analysis was conducted, including reasons for the selected characteristics and their method of quantification; section 3 presents the results obtained by describing each cluster in terms of member states included in that cluster as well as the characteristics that they have in common; section 4 presents the overall conclusions and the implications of the results we obtained.
Research Methodology
The database used in this study contains information regarding the fiscal system and fiscal pressure in all of the 27 member states of the European Union, starting from 1965 and ending in 2010. Data from 2010 is the most recent information currently available for the indicators we are interested in. We have used data from the OECD Revenue Statistics for 2011 and from the Eurostat database. It was necessary to combine the two because the OECD statistics did not include six of the European Union’s newest member states: Cyprus, Malta, Latvia, Lithuania, Bulgaria and Romania.
We extracted information regarding 4 key factors that we considered as characteristics of taxation in each state: fiscal pressure, the percentage of revenue from indirect taxation in the total revenue from taxation, the percentage of revenue from direct taxation in the total revenue from taxation and the percentage of social security contributions in the total revenue from taxation. Fiscal pressure is calculated as the percentage of total revenues from taxation in GDP. The other three indicators reflect the structure of the taxation system in each member state and what type of fiscal revenue each country relies on most. Indirect taxation refers mainly to taxes on goods and services, while direct taxation comprises of taxes on income and profit.
For the 12 states that joined the European Union in 2004 and 2007 data was only available from 1995 onward. However, this does not affect the results of our analysis because all of these countries started the accession process in 1995 and previous data would be irrelevant for two reasons: first of all, because a country that is not interested in joining the EU would have no reason to be concerned with taking steps to ensure the convergence of its taxation system with that of the other member states and secondly, because most of the mentioned states were communist nations with planned economies for the better part of the period between 1965 and 1995.
We used the database described above in multiple cluster analyses in order to illustrate if we can talk about taxation convergence in the European Union. We will see the clusters thus obtained as fiscal convergence groups. The cluster analysis was done with the help of specially designed statistic analysis software, using the k-means algorithm. In order to select the number of clusters for each analysis, we used a “rule of thumb”:

Where k represents the number of clusters and n is the number of objects (member states of the European Union considered for each cluster analysis).
To reach conclusions about taxation convergence in the European Union, we selected a number of years (1965, 1973, 1981, 1986, 1995, 2007, and 2010) and realized a cluster analysis of the selected data for each of them. The years were not randomly selected; we chose the two extremities of the time period (1965 and 2010) and the years when the European Union accepted new member states as points of reference for our study.
For each year, we only selected the member states of the EU at that time and we included them in the database for the cluster analysis. The only exception is 1995. For this year we decided to use two different databases, one which only included the 15 member states of the EU at that time and another one which included all the 27 current member states. We decided to do this in order to see how the clusters of previous member states changed when so many new members were included in the analysis. Moreover, in 1995 most of the 12 newest members of the EU started the accession process, with the sole exception of Slovenia, who started the accession process in 1996. And since all the 12 countries eventually joined the EU, we considered 1995 as a starting point for the analysis of taxation convergence in an extended European Union, as it is today.
Research Results
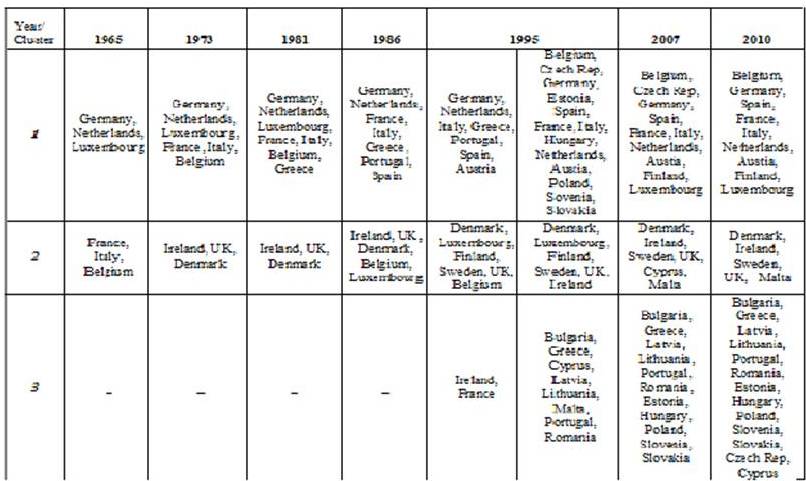
By comparing the results of successive cluster analyses, we can observe the convergence tendencies among member states of the European Union in the field of taxation. Table 1 presents the results of each cluster analysis in terms of assessing which countries have the most similar taxation systems. Taxation convergence tendencies are also clearly visible.
Table 1: Cluster Analysis Results
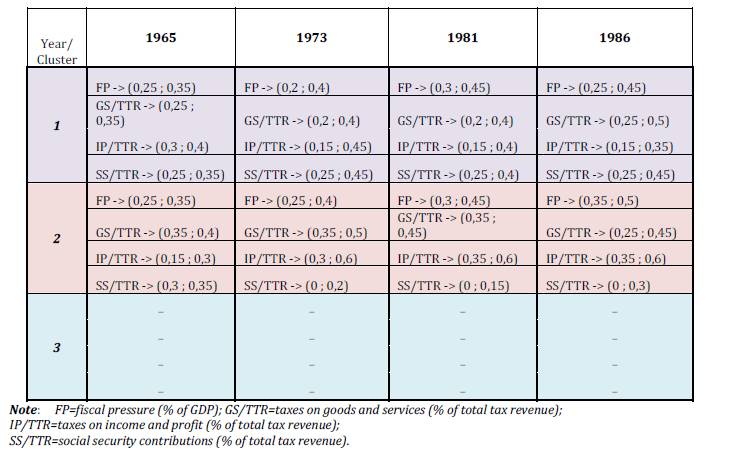
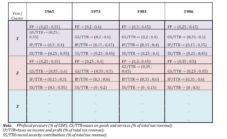
In1965, when there were just 6 member states, their fiscal systems had many similarities. The only major difference between the two clusters is that the countries in the first cluster (Germany, Netherlands and Luxembourg) relied a lot more on direct taxation.
In 1973, 3 more countries joined the EU. The cluster analysis for this year shows that the first 6 member states formed a single cluster in 1973, while the newly arrived Ireland, the United Kingdom and Denmark now form a second cluster. The new member states collect very little revenue from social security contributions and instead rely on taxes on income and profit. Greece joins the European Union in 1981. As far as the taxation system convergence is concerned, the two clusters from 1973 remain unchanged, with Greece joining the first cluster. The characteristics of the two clusters change very little from 1973, with the fiscal pressure range for cluster one getting closer to that for cluster two.
Portugal and Spain joined the European Union in 1986. In terms of taxation systems characteristics, the two previous clusters suffered only a few changes, with Portugal and Spain joining the first cluster and Belgium and Luxembourg changing to the second cluster. The main difference between the taxation systems represented by the two clusters is that while countries in the second cluster rely mainly on tax income from income and profit, the countries in cluster one rely less on direct taxation and more on social security contributions.
Table 2: Cluster Characteristics 1965-1986
Three more countries join the European Union in 1995: Austria, Finland and Sweden and from this point on, the data used for Germany also includes information for the German Democrat Republic (East Germany). The cluster analysis puts Austria in cluster one; while Finland and Sweden join cluster two. For this year we have decided to also include the results of cluster analysis for all the 27 current member states of the EU. Consequently, the results show that 3 clusters exist in these new conditions. The interesting find is that the second cluster of states from the previous analysis (done for the 15 member states in 1995) remains almost unchanged with Ireland replacing Belgium, while the rest of the countries are grouped in the other two clusters.
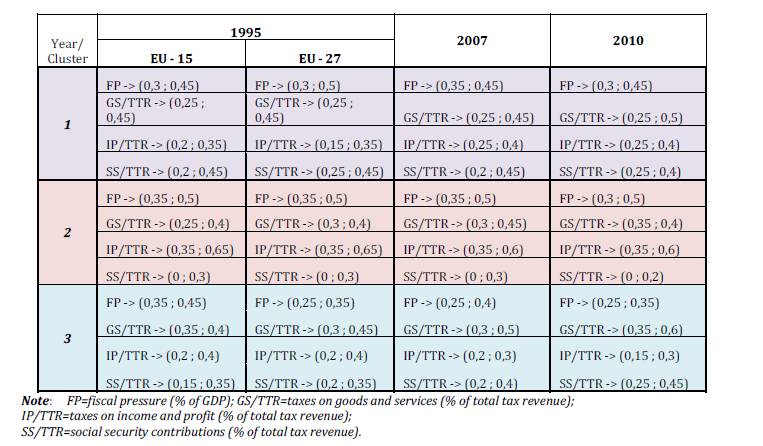
Table 3: Cluster Characteristics 1995-2010
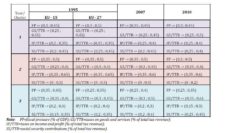
The characteristics of the 3 new clusters are as follows: cluster one includes countries with medium towards high fiscal pressure (ranging from 30% to 50%), who rely equally on taxes on goods and services and social security contributions, with only a small percentage of the total taxation revenue coming from direct taxation; cluster two includes countries with high fiscal pressure, who rely mainly on taxes on income and profit, while the percentage of revenue from social security contribution is small (rarely going above 15%); cluster three includes countries with low towards medium fiscal pressure, who obtain most of their taxation revenues from taxes on goods and services, but also rely on social security contribution and direct taxes for 50% – 60% of their total fiscal revenues, in almost equal proportions. The characteristics of these three clusters remain the same until 2010, while the ranges of variation for each indicator within the same cluster seem to be keeping more or less to the same interval limits.
Ten more countries join the EU in 2004 with Bulgaria and Romania following in 2007. The cluster analysis for 2007 shows that, by comparison with 1995, Estonia, Hungary, Poland, Slovenia and Slovakia move from cluster 1 to cluster 3, with Luxembourg joining cluster 1. The cluster analysis for 2010 reveals the fact that clusters one and two further decrease in number of objects (countries), with the Czech Republic and Cyprus joining cluster 3.
Conclusions
As a result of our study, we can say our research reveals clear convergence tendencies among the member states of the European Union regarding taxation. Our conclusions are similar to those of previous studies on the matter, even if they were done using other research methods.
We based our conclusions on data collected for fiscal pressure and three other indicators that describe the taxation system or taxation mix in each of the member states: the percentage of the total taxation revenues that was collected from indirect taxation (taxes on goods and services), the percentage of the total taxation revenues that was collected from direct taxation (taxes on income and profit) and the percentage of the total taxation revenues that was collected from social security contributions.
For the period before 1995, the taxation convergence tendencies are clear and strong because on every new cluster analysis, more and more countries joined the first cluster, with only a limited number of countries remaining in the second cluster. In most cases, it was the newest member states at each stage of the EU enlargement process that made up the second cluster, only to join cluster one at the next cluster analysis.
The addition of 12 new countries in the sample for the cluster analysis starting with 1995 basically doubled the analyzed database and resulted in the creation of three clusters of convergence. However, between 1995 and 2010, the cluster analysis reveals that taxation convergence tendencies still exist in the enlarged European Union, with more and more countries joining cluster 3. This shows that the characteristics of the taxation systems in EU member states are becoming more and more similar.
References
Avi-Yonah, R. S. (2010). “Tax Convergence and Globalization,” University of Michigan Law & Economy, Empirical Legal Studies Center, Working Paper No. 214, [Online], [Retrieved March 4, 2012], http://ssrn.com/abstract=1636299
Publisher
Barro, R. J. & Sala-i-Martin, X. (1992). “Convergence,” Journal of Political Economy, 100 (21), 223-251.
Publisher – Google Scholar
Browning, E. K. (1978). “The Burden of Taxation,” The Journal of Political Economy, 86 (4), 649-671.
Publisher – Google Scholar
Delgado, F. J. (2006). “Are the Tax Mix and the Fiscal Pressure Converging in the European Union?,” Instituto de Estudios Fiscales, working paper, [Online], [Retrieved December 18, 2011],
http://econpapers.repec.org/paper/hpewpaper/y_3a2006_3ai_3a11.htm
Publisher
De Novelis, F. & Parlato, S. (2003). “Reducing Fiscal Pressure under the Stability Pact,” Italian Society of Public Economy, working paper, [Online], [Retrieved January 12, 2012],
http://www-3.unipv.it/websiep/wp/202.pdf
Publisher
Esteve, V., Sosvilla-Rivero, S. & Tamarit, C. (2000). “Convergence in Fiscal Pressure across EU Countries,” Applied Economics Letters, 7, 117-123.
Publisher – Google Scholar – British Library Direct
Gee, M., Haller, A. & Nobes, C. (2010). “The Influence of Tax on IFRS Consolidated Statements: The Convergence of Germany and the UK” Accounting in Europe, 7 (1), 97-122.
Publisher – Google Scholar
Genser, B. & Haufler, A. (1996). “Tax Competition, Tax Coordination and Tax Harmonization: The Effect of EMU,”Empirica, 23, 59-89.
Publisher – Google Scholar
Goodspeed, T. J. (2001). “Tax Competition and Tax Structure in Open Federal Economies: Evidence from OECD Countries with Implications for the European Union,” European Economic Review, 46 (2), 357-374.
Publisher – Google Scholar
Kanti, M., Kent, J. & Bibby, J. (1979). ‘Multivariate Analysis,’ Academic Press, London.
Kemmerling, A. (2010). “Does Europeanization Lead to Policy Convergence? The Role of the Single Market in Shaping National Tax Policies,” Journal of European Public Policy, 17 (7), 1058-1073.
Publisher – Google Scholar
OECD (2011). Revenue Statistics, Paris, [Online], [Retrieved January 23, 2012,http://www.oecd.org/document/35/0,3746,en_2649_37427_46661795_1_1_1_37427,00.html
Publisher
Sosvilla-Rivero, S., Galindo, M. A. & Alonso Meseguer, J. (2001). “Tax Burden Convergence in Europe,” Estudios de Economia Aplicada, 17, 183-191.
Publisher – Google Scholar
Tanzi, V. (2011). ‘Tax Systems in the OECD: Recent Evolution, Competition and Convergence,’ The Eldgar Guide to Tax Systems, Edward Eldgar Publishing, Cheltenham, UK.
Tryfos, P. (2001). “Cluster Analysis,” [Online], [Retrieved February 10, 2012], http://www.yorku.ca/ptryfos/f1500.pdf
Publisher
Zodrow, G. R. (2003). “Tax Competition and Tax Coordination in the European Union,” International Tax and Public Finance, 10, 651-671.
Publisher – Google Scholar – British Library Direct