Introduction
Starting with the ‘60s, the modelling of regional development has been a major topic in the specialty papers. As Johnson and Scott (2006) point out, the responsibility for public decision is transferred toward the community level and local regions have to make decisions related to economic development.
Labour market is an important element of the market economy. The changes that occur in the evolution of phenomena in the labour market, such as occupation or unemployment, have a special impact both on regional and national levels.
The modelling of the labour market has known a significant development in the 1970’s with the use of production functions in labour demand modelling (Bell, 1967; Glickman 1977; Adams, Brooking and Glickman, 1975). In the models which were designed, the production functions employed (Cobb-Douglas, translog or simple linear forms) determine desired labour use measured in hours or employment.
In Romania, regional modelling is just making its debut. The need for the inclusion of the specific regional characteristics within a model, as well as the need for the data homogeneity, imposes the design of a model for the regional development. In Romania, there are eight development regions, of which the North-East region distinguishes itself from the entirety of the other regions through specific characteristics such as: a great number of population occupied in agriculture, an increased unemployment rate, a reduced GDP value, etc. The modelling of such a complex region becomes a necessity, aiming at substantiating potential scenarios of economic evolution of the component counties, and more especially, studying the possibility to use this model in situations similar to those of the North-East region.
In this paper, the researcher will present the literature review regarding the factors taken into consideration for the modelling of variables in the labour market, and she will explain the methodology subsequently used in the empirical study conducted for the North-East region of Romania. The identification of the economic characteristics specific to the North-East region will be undertaken by means of a comparative analysis of the index of GDP variation registered in this region during 1998-2008 in comparison with the level registered at national level and by means of the analysis of the most important indicators of the labour market: employment rate, unemployment rate and labour force participation rate. In the end, the empirical study will focus on the estimation of the Cobb-Douglas type production function for the North-East region and the econometric modelling of one of the most significant factors in the labour market: the labour force participation rate.
The results obtained allow the evaluation of the labour market potential in the North-East region and represent the basis for the assessment of its future development.
Literature Review
The regional models for the labour market are based on the hypothesis that economic growth is caused by exogenous increases in employment.
In the designed models, the production functions employed (Cobb-Douglas, translog or simple linear forms) determine the use of desired labour measured in hours of employment.
The Phillips Curve is widely used, and the variables introduced in the estimated models are, most often, the unemployment rates, employment change, national wage rates and national and local consumer price indexes. The labour participation rate, which is a crucial variable, is usually a function of lagged wage (relative to the nation) and employment (Bolton, 1985).
The labour market consists of supply equations (labour force, in-commuters, out-commuters) and unemployment as an identity (Swallo and Johnson, 1987; Johnson and Scott, 1997; Swenson and Otto, 1999). Labour demand (employment) is usually correlated with change in the unit labour cost (Naohiro, Akira, Makoto and Mitsuo, 1983; Belot and van Ours, 2001) or with utilisation rate of productive capacity, unemployment inertia or the number of vacancies in the economy (van Miltenburg, 1997).
Shields (1998) formulated six labour market equations: employment, wage, unemployment, in-commuters, out-commuters and labour force. He assumes that change in labour demand leads to change in wages. Johnson and Scott (1997) treated per capita income as an exogenous variable because they assume that for a smaller region, changes in labour demand do not affect wages. In the wage equations, the most used explicative variables are unemployment, labour productivity, different indices or inflation (Blanchard and Katz, 1999; Whelan, 1997).
In Romania where the market mechanisms penetrated slower in the interaction of labour supply-demand, the labour force participation rate is defined depending on employment in the previous period (Dobrescu, 2002 şi 2006).
Data and Methodology
The modelling of the production function is based on the use of the neo-classic Cobb-Douglas type of production function:
 ,
,
where : GDPct — GDP in constant prices, with , PGDPct — fixed-weighted GDP deflators;
- TFPt — total productivity of factors;
- α is the elasticity of the work factor in relation to the output, approximated to the share of labour income in gross value added;
By using the annual GDP indices, the equation turns into:
 or .
or .
Due to the lack of data regarding the capital factor at regional level, the expression  is considered constant; therefore
 . Under these conditions, through logarithmation, the equation becomes:
 (1)
(1)
In order to model the labour market in the North-East region of Romania, one relationship has been selected according to the structure of the macromodels elaborated for the Romanian market economy (Dobrescu, 2002 şi 2006), for the most important variable in the labour market: labour force participation rate (prap).
The labour force participation rate (prap) is defined as a ratio of labour force to population over 15 years. The econometric equation estimated for this variable is of the form:
 (2)
(2)
where:
prap(-1) is the first lag of the prap variable;
ru(-2) is the second lag of the unemployment rate (ru);
βB is the constant;
βt, with i=1,2, are the coefficients of the regression equation;
ε is the error term.
The estimation of the regression coefficients was conducted by using the OLS method. The stationarity of variables was tested using the ADF (Augmented Dickey-Fuller) and the Phillips-Perron tests. Three models were tested (model with intercept, model with trend and intercept and model without trend and intercept) and the model specification was chosen in relation to the Schwartz Information Criterion (SCW).
In order to explore the causal relationship between the variables, the Granger causality test (1969) was performed. The Granger causality test was computed for one, two and three lags.
The main data sources are: the directories (general and specialised) of the National Institute for Statistics; the reports and other works of the statistical offices from the counties composing the North-East region and of the National Committee of Forecast. Data processing was performed using the statistical software E-Views, Version 5.00.
Regional Growth and Labour Market in the North-East Region
In order to identify the characteristics specific to the North-East region of Romania, the researchers compared the index of Gross Domestic Product at constant prices registered in this region (IGDPC_N_E) in comparison with the national level (IGDPC_ROM) during the period 1995-2008 (Figure 1).
Figure 1. The Dynamics of the Index of GDP at Constant prices in Romania and in the North-East Region, during 1995-2008 (%)
Source: Done by the authors according to the data provided by the National Institute of Statistics
It can be observed that the GDP level experienced important variations during the period 1995-2008 both at national and regional levels. In 1997, a significant drop of approximately 15% in the real GDP value was registered, unlike the previous year. The inconsistency in the formulation and application of the mix of macro and microeconomic policies determined the deterioration of the economic situation of the country.
During the entire period under analysis (apart from one year), the North-East region has been characterized by increases in the real GDP value situated below the national level. After 2002, the economic discrepancy registered between the North-East region and the national level was accentuated.
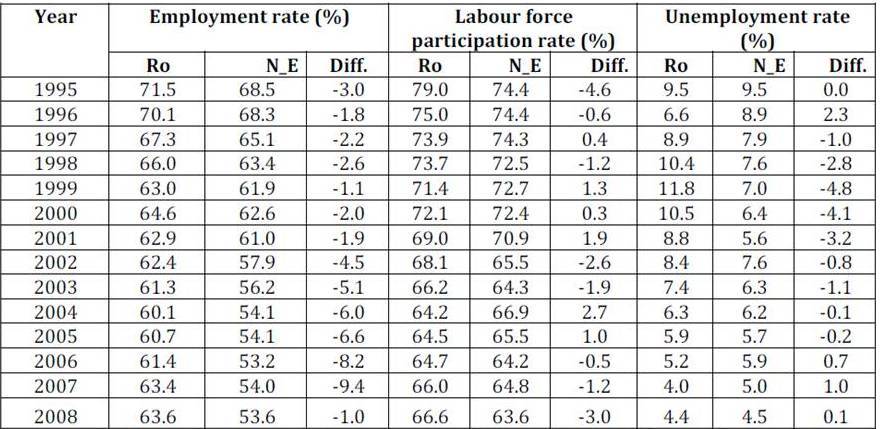
For the identification of the labour market characteristics in the North-East region, the researchers registered for the 1995-2008 period the following statistical indicators: employment rate (%), labour force participation rate (%) and unemployment rate (%). The data are presented in the table below:
Table 1: Indicators of Labour Market in Romania and in the North-East Region during 1995-2008 (%)
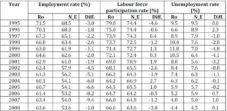
Source: Done by the authors according to the data provided by The National Institute for Statistics, the Tempo on-line database, data provided by the National Committee of Forecast.
The data from the above table highlight significant disparities between the levels registered in the North-East region for the most important indicators of labour force and the national level.
The occupied population registered a descending trend for the entire analyzed period both in Romania and the North-East region. The disparity between the occupation rate in this region and the national occupation rate was accentuated especially after 2002, reaching in 2008 a difference of 10%.
Important differences, still less accentuated, were registered as regarding labour force participation rate: in 2008, in the North-East region the labour force participation rate was 63.6%, compared to 66.6% registered on the national level.
The unemployment registered, both at national and regional level, a descending trend evolution during the period 1995-2008. Still, the economic crisis broken out in 2008 caused changes in the evolution of these indicators.
The structure of the occupied population by main activity fields (agriculture, industry, constructions and others) was in 2008 as follows:
Figure 2. The Structure of the Occupied Population by the Main Activity fields in Romania and in the North-East Region in 2008 (%)
Source: Done by the authors according to the data provided by the National Institute of Statistics
The above diagram highlights that the North-East region is prevalently agricultural: the weight of the population occupied in agriculture was 47.73% in 2008, compare to 27.65% on the national level.
The structure of the population in Romania in terms of main economic activities changed during 1990-2008, following the adoption of privatization measures for the state-owned enterprises and the stimulation of the development of the private sector. Despite these measures, the weight of the population occupied in agriculture also remained at a high level on the national level, at 27.65% in 2008. The constructions sector was faced with an accentuated growth dynamics, especially after 2000; but it was also the most affected sector by the economic crisis started in 2008, when in Romania the GDP had a decrease by 7.1% in 2009, following a 7.3% increase in 2008.
As noticed, the North-East region of Romania is characterized by an inferior level of GDP growth comparatively with the national level and by being a prevalently agricultural region.
Empirical Study
For the estimation of the production function (equation 1), a dummy variable, d97, is defined with d97=1 for the year 1997 and d97=0 for the other years. This change is imposed by the significant decrease in the GDP value registered for the North-East region in 1997. Thus, equation (1) becomes:
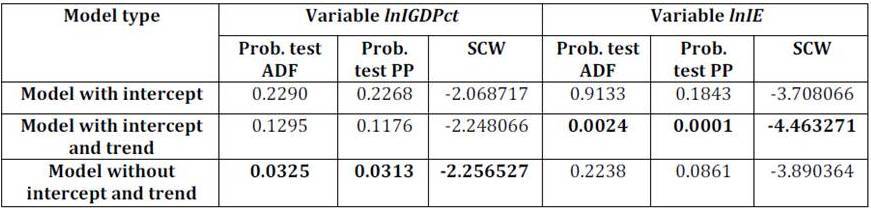
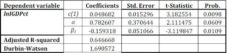
The testing of the stationarity of the variables lnIGDPct and lnIE was performed using the statistical tests Augmented Dickey-Fuller (ADF) and Phillips-Perron (PP). In order to test the stationarity, the models with intercept, with trend and intercept and without trend and intercept were used. The obtained results are presented in the table below:
Table 2: The Values of the Probability Associated with the Statistical Tests ADF and Phillips-Perron (PP) for the Variables lnIGDPct şi lnIE
Source: Done by the authors in the E-VIEWS software program
The obtained results highlight that the variables lnIGDPct and lnIE are stationary, considering a risk of 0.05. The probabilities associated with the statistics ADF and Phillips-Perron are 0.0325, 0.0313 respectively and lower than 0.05 in the case of the variable lnIGDPct. For the variable lnIE, these probabilities are 0.0024 and 0.0001 respectively.
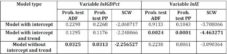
The estimations of the regression coefficients, standard error, the values of the statistics t Student and the probabilities associated with these, for the model are presented in the table below:
Table 3: The Estimations of the Regression Coefficients, Standard Error, the Values of the Statistics t Student and the Associated Probabilities
Source: Done by the authors in the E-VIEWS software program
The estimated equation is of the form:

The coefficients of the estimated equation are statistically significant, for a risk of 0.10 (the significance levels are 0.0098, 0.0609 and 0.0109). The obtained results show that the employed population has an important contribution to the economic growth: an increase with 1% in the labour factor leads to an average increase with 0.78% in output. The technical progress has a low contribution in the North-East region GDP growth.
For the estimation of the equation (2) concerning the dependence of the labour force participation rate from the previous evolution of unemployment rate, the researchers have tested the stationarity of the variables prap and ru, using the statistical tests ADF and PP. The obtained results are presented in the table below:
Table 4: The Values of the Probability Associated with the Statistical Tests ADF and Phillips-Perron (PP) for the Variables prap and ru
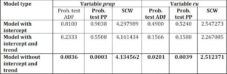
Source: Done by the authors in the E-VIEWS software program
The obtained results highlight the fact that the variables prap and ru are stationary, considering a risk of 0.05. The probabilities associated with the statistics ADF and Phillips-Perron are 0.0836, 0.0003 respectively and lower than 0.05 in the case of the prap variable. For the ru variable, these probabilities are 0.0201 and 0.0039 respectively.
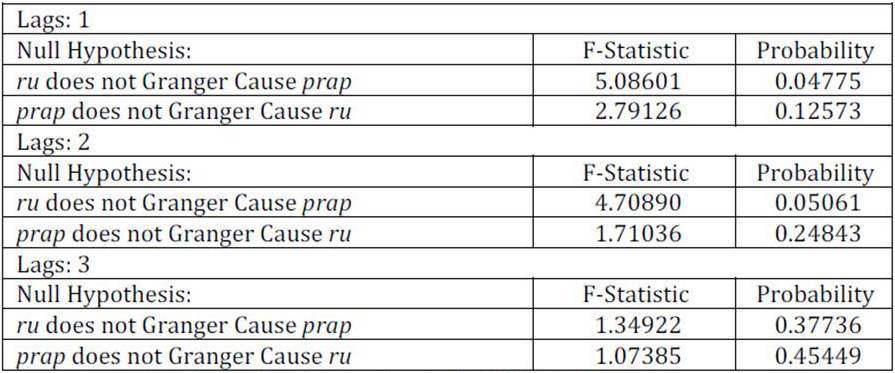
The Granger causality test, computed for one, two and three lags, was applied in order to test the dependence between the variables prap and ru. The obtained results are presented in the table below:
Table 5: The Granger Causality Test for One, Two and Three Lags, for the Variables prap and ru
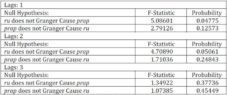
Source: Done by the authors in the E-VIEWS software program
The results obtained suggest the existence of some dependence between the labour force participation rate and the previous evolution of unemployment rate (the significance levels are 0.04775 and 0.05061).
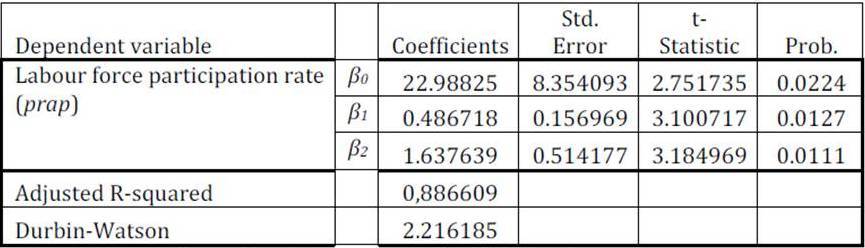
The estimations of the regression coefficients, standard error, the values of the statistics t Student and the probabilities associated with these for the model  are represented in the table below:
Table 6: The Estimations of the Regression Coefficients, Standard Error, the Values of the Statistics t Student and the Associated Probabilities
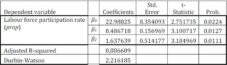
Source: Done by the authors in the E-VIEWS software program
The estimated equation is of the form:
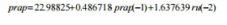
The coefficients of the estimated equation are statistically significant, for a risk of 0.05 (the significance levels are 0.0224, 0.0127 and 0.0111). The value of the coefficient associated with the ru variable highlights the high degree of inertia of the processes in the labour market in the North-East region of Romania: a decrease in the unemployment rate by 1% leads to an average lagged reduction of the labour force participation rate by 1.637639%.
Conclusions
The responsibility of the local communities for adopting decisions for the regional economic development is more important than ever. The modelling of the regional development is needed in order to offer rigorous informational support for the adoption of adequate measures.
The North-East region of Romania has a reduced economic development level, situated below the national level, but with significant occupation potential. This region can be distinguished from the others through its weight of the population occupied in agriculture: in 2008, 47.73% of the population were occupied in this field.
The empirical study conducted highlighted that this region is characterized by an important potential in the labour market. The employed population has an important contribution to the economic growth and the technical progress has a low contribution in the North-East region GDP growth.
Due to the constant drop in the number of employees after 1990 and also other negative influences such as ageing of the labour force and migration, the development policy of this region has to ensure a coherence of policy instruments and strategic approaches on medium and long terms. The investments in this region should be directed towards fields where there is a high occupation potential, such as the agricultural one; while the increase in investments must be conceived in a coherent framework, with a coordination of the capital-labour relation.
Acknowledgements
The present paper has benefited from the financial support of the project “Post-doctoral studies in Economics: lifelong training project of outstanding researchers — SPODE”, financing contract no. POSDRU/89/1.5/S/61755, project financed by the European Social Fund through the Sectorial Operational Programme Development of Human Resources 2007-2013.
References
Adams, F. G., Brooking, C. G. & Glickman, N. J. (1975) “On the Specification and Simulation of a Regional Econometric Model: A Model of Mississippi,” Review of Economics and Statistics, 57, pp. 286-298.
Publisher – Google Scholar
Bell, F. W. (1967) “An Econometric Forecasting Model for a Region,” Journal of Regional Science, 7, pp. 109-127.
Publisher – Google Scholar
Belot, M. & van Ours, J. C. (2001) “Unemployment and Labor Market Institutions: An Empirical Analysis,” Institute for Labour Studies (OSA), Tilburg University, Working Paper 10.
Publisher – Google Scholar – British Library Direct
Blanchard, O. J. & Katz, L. (1999) “Wage Dynamics: Reconciling Theory and Evidence,” NBER Working Paper Series 6924 89, May, pp. 69-74.
Publisher – Google Scholar – British Library Direct
Dobrescu, E. (2002) ‘Tranziţia în România. Abordări econometrice,’ Editura Economica, Bucureşti.
Google Scholar
Dobrescu, E. (2006) ‘Macromodels of the Romanian Market Economy,’ Editura Economica, Bucureşti.
Google Scholar
Engle, R. F. (1980) ‘An Exploratory Policy-Oriented Econometric Model of a Metropolitan Area: Boston,’ in L. Klein et al. (eds.) Quantitative Economics and Development: Essays in Memory of Ta-Chung Liu, New York: Academic Press, pp. 123-156.
Google Scholar
Glickman, N. J. (1977) Econometric Analysis of Regional Systems: explorations in model building and policy analysis,New York: Academic Press.
Publisher – Google Scholar
Johnson, T. G. & Scott, J. K. (1997) ‘The Community Policy Analysis System (COMPAS): a proposed national network of econometric community impact models,’ Paper presented at the 11th Federal Forecasters’ Conference, Washington, DC, september.
Google Scholar
Johnson, T. G. & Scott, J. K. (2006) “The Show Me Community Policy Analysis Model,” In TC Johnson, DM Otto, SC Deller, eds Community Policy Analysis Modeling, pp. 119-129, Ames, IA: Blackwell Publishing.
Publisher – Google Scholar
Naohiro, O., Akira, S., Makoto, K. & Mitsuo, E. (1983) ‘Demographic-Economic Building for Japan,’ in Modelling Economic and Demographic Development, Asian Population Studies Series, nr. 54, United Nations, New York, pp. 147-164.
Shields, M. (1998) ‘An integrated economic impact and simulation model for Wisconsin counties,’ unpublished doctoral dissertation, university of Wisconsin-Madison van Miltenburg A.J.M, 1997, Quaterly Macroeconomic Model of the Estonian Economy, Erasmus University, Final report ACE 94-0579-R.
Google Scholar
Whelan, K. (1997) Wage Curve vs. Phillips Curve: Are there Macroeconomic Implications?, Division of Research and Statistics, Federal Reserve Board.
Publisher – Google Scholar – British Library Direct