Introduction
Performance in Public Health Services
In the last years, performance has become a well known term in the industry of health services (Minvielle etal., 2008).Performance represents the extent to which set objectives are accomplished. The concept of performance in health services represents an instrument for bringing quality, efficiency and eficacy together. Consequently, the concept of performance is a multidimensional one, covering various aspects, such as: evidence-based practice (EBD), continuity and integration in healthcare services, health promotion, orientation towards the needs and expectation of patients.
Generally speaking, the mission of any hospital is to provide specific health services, which can solve the patients’ health problems (eficacy) in the best manner (quality) and in the most economic way possible (efficiency).
Since performance actually refers to efficacy, efficiency and quality, being aware of the performance of the hospital means nothing but an understanding of the way it fulfils its mission. Being aware of the performance of the hospital becomes even more important if the fact is considered that it must permanently adapt to an external environment that undergoes continuous change, so as to fulfill its mission even in the newly emerging contexts.
The new situations that the hospital has to deal with may be determined by various causes, such as: the development of new health policies or the emergence of new orientations and tendencies (increase in the hospital’s social responsibility, increase in the interest for the quality of healthcare services), changes in the demand for hospital services or in the services supply competition, changes in medical technologies, etc. However, success in adapting to new situations can only be assessed by a change-based comparison, namely, performance before the change and performance after the change.
This new approach has led to the elaboration of a variety of methods for the assessment of performance in health systems (Leggeat etal., 1998). Many of these methods proved to be unsatisfactory because they used only one variable, one single KPI, and in many cases the result was distorted (Minvielle etal., 2008).
According to the organization management theory, different models of organizations generate different models of performance (Cameron etal., 1983; March and Sutton, 1997), some of them being appropriate to health organizations as well. Although over the years both new KPIs and different models of evaluation for the performance of hospitals have been proposed, they still fail to deal with health system challenges.
Performance Evaluation Model in Public Health Services
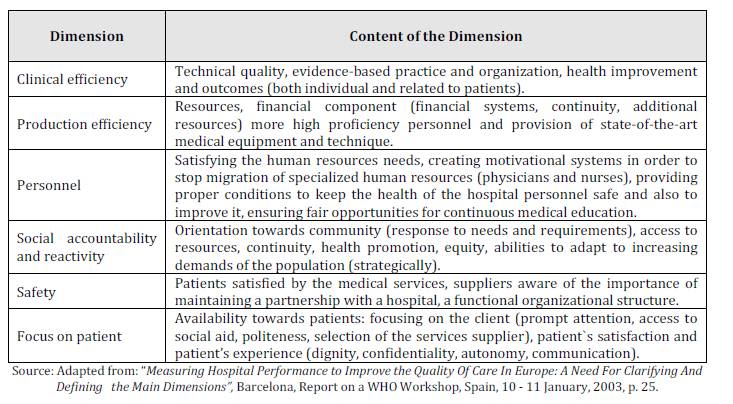
The systems of indicators, discovered while searching information on the management of performance in hospitals abroad, revealed the existence of several main dimensions most frequently used to measure hospitals’ performance.
Table 1. Main Dimensions in Measuring Performance

It may be thus stated that measuring the hospital performance is intrinsically connected to the following dimensions:
– Clinical efficiency through technical quality and practice;
– Efficiency in using and attracting resources, with an important component related to the financial management of the hospital;
– Orientation towards continuity together with positive response to the needs and demands of the community;
– Safety provided through high quality, ensured throughout the entire flow of relations with the suppliers, patients and with the whole community;
– Orientation focused on patients in order to get them fully satisfied.
The key dimensions have been compared to various theoretical models of performance set in the organizational theory. This has led to the conclusion that such key dimensions cover great part of the issues related to performance. Relationship between the key dimensions of a hospital performance and the various theoretical models of performance are presented in the table below.
Table 2. Relationship between the Key Dimensions of a Hospital Performance and the Various Theoretical Models of Performance

Getting hospital performance based on implementation of theoretical models aims to achieve peculiar dimensions, such as: clinical efficiency – high proficiency medical act performed under optimal costs, satisfaction and focus on patient, efficient use of resources (material, human, financial), safety determined by a low degree of malpraxis, special human relationships and intercommunication, feedback between an open-minded management structure and the elite of medical practitioners.
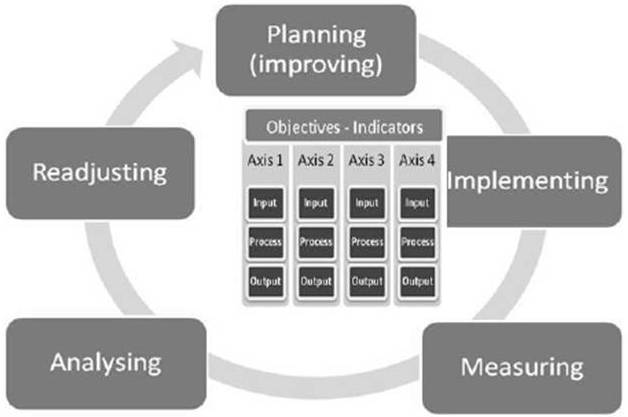
In the suggested model, performance management is accomplished through a Plan-Do-Check-Act cycle of action (Deming cycle) in which the researchers separated Measuring from Analysing in order to emphasize the role of each dimension more clearly (figure 1). The novelty proposed by this model is the vision oriented towards action, induced by the inclusion of the static vision offered by the classic indicators systems into the PIMAR cycle (Planning-Implementing-Measuring-Analysing-Readjusting), a cyclic action based on planning, measuring and corrective feedback.

Figure 1. Model of Performance Management in Public Health Services
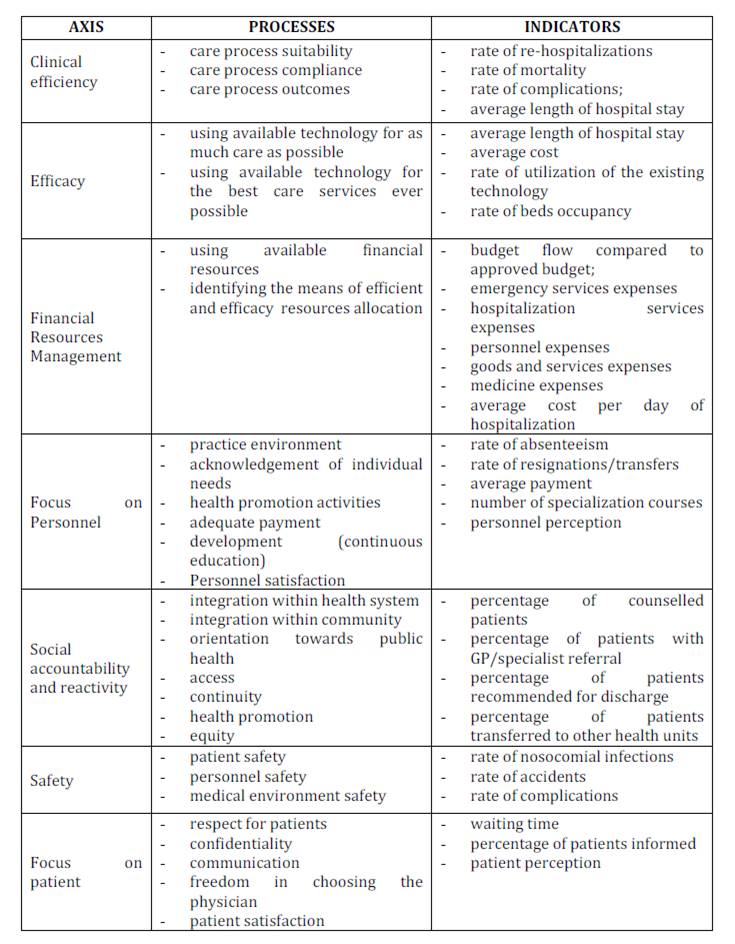
The model has in its core the process of setting certain performance objectives are measured by appropriate indicators. The Axes/Dimensions are assigned depending on the visions which are to be taken into consideration for the public health systems (Clinical Efficiency, Efficacy, Financial Resources Management, Accountability/Receptivity, Safety and Focus on Patient). The following table presents a list of indicators relevant to the hospital performance, which may be used contextually.
Table 3. Examples of Indicators Usable for an Accurate Survey on Hospitals Performance, per Processes and Strategic Axes
Performance of a public health service can be achieved through a dynamic tension among accomplishment of its mission (fulfilment of objectives), acquisition and control of resources (financial sources, prestige), keeping and development and human resources (welfare of employees and personal development) and integration and previsibility of services provided compared with the capacity to satisfy the needs and expectations of service users (patients).
The key point of the model from which emerges its adaptive essence is the performance indicators selection. They have to be contextually selected, allowing the model to adapt to a large variety of real life situations. In order to finalise the predefined cycle of performance management, it is necessary that certain conditions be observed when selecting the indicators.
Thus, selection of indicators must:
– Allow creation and implementation of an actual and efficient system of control and measurement of such indicators within the hospital concerned;
– Be adapted to the main strategic objectives, allowing the model, by their own change, to adapt to the new strategic imperatives, and hence to introduce improvements in the system;
– Allow useful interpretations and analysis as basis of medical or administrative decisions, which will regulate the functioning of the system in the hospital concerned.
Model Testing and Validation Methodology
The main purpose of the present study is validation of the performance management model as conceived. To this end a set of data was collected in order to test the hypotheses regarding the functionality of the model. Five hospitals were selected, with similar profile, in terms of their size, position in the regional health system as well as functional specialization. A reference is made to Emergency County Hospitals in Iaşi, Cluj, Timişoara, Craiova and Bucharest. The data were collected from the official reports of the hospitals concerned, for the year 2008.
The model validation methodology includes model testing at relationship level between objectives and indicators, for the purpose of identifying the means through which a series of indicators from the model may respond to the strategic need of providing valid information for the tactical managerial decisions. This relationship among objectives, indicators and PIMAR cycle (Planning-Implementing-Measuring-Analysing-Readjusting) can be validated by proving the fact that the indicators can be used to obtain sensible data regarding the evaluated system. The data collected must be sensible enough to be used within PIMAR cycle, through the management decisions that are made following the interpretation of the indicators under study.
In order to validate the model, 7 KPIs for hospitals were selected, and the 5 hospitals mentioned above submitted such data for the year 2008. For each of the 7 indicators, hypotheses were formulated regarding their sensitivity towards the wealth of the system under study (the hospital). The data have been processed, interpreted and graphically displayed in order to prove if the 7 indicators can be the basis of certain analyses and decisions within the PIMAR cycle, by validating or invalidating the hypotheses.
Analysis of the Data Collected
Certain indicators were selected during an initial stage, which would be sensible enough to allow the functioning of the model. Starting from the list of the 4 performance indicators attentively controlled by the Ministry of Health, the ANOVA UNIVARIATE method was used for independent samples, having as its objective the study of the influence of a group factor on the variation of another variable. In that example, the researchers tried to see the significant differences between the average levels of the indicators considered for the study (Occupancy rate, Average length of stay in hospital, Mortality rate within the hospital, Percentage of medicine expenses out of the hospital total expenses) from the 5 hospitals selected.
Table 4. Anova Univariate
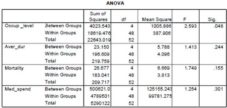
The results obtained and shown in table IV prove there are significant differences between the hospitals concerned, solely from the point of view of the indicator beds occupancy rate, per hospital and per ward, considering a risc of 0.05. The value of the probability associated with the calculated test statistics (F=2,593) is Sig. =0.048<0.05. This result proves that beds occupancy rate per hospital and per ward is a highly relevant indicator, which can be used in the performance evaluation system recommended in this paper.
In order to statistically test the difference between the average levels of the variables from the hospitals under study, the Bonferroni test was used.
Hypothesis 1
– H1: There are significant differences between the Emergency County Hospitals in Iaşi, Cluj, Timişoara, Craiova and Bucharest regarding beds occupancy rate per hospital and per ward.
– H0: There are no significant differences between the Emergency County Hospitals in Iaşi, Cluj, Timişoara, Craiova and Bucharest regarding beds occupancy rate per hospital and per ward.
Statistical Interpretation
According to the outcomes, there are significant differences between the average levels of the values for the indicator beds occupancy rate per hospital and per ward between the Emergency County Hospital „Sfântul Spiridon” Iaşi and the Emergency County Hospital Timişoara, in the sense that the average levels of the values for the indicator analysed in the Emergency County Hospital „Sfântul Spiridon” Iaşi are significantly higher than in the Emergency County Hospital Timişoara (sig= 0, 041 < 0,050). Thus, H1 is confirmed and H0 rejected.
The outcomes confirm what the diagram box-and—whiskers points out visually: from the point of view of the occupancy rate, the greatest differences are found between the hospitals in Iaşi and Timişoara (Sig.=0.041<0.05) (figure 2.). The hospital in Iaşi is characterised by a medium level, expressed by the value of the median, the highest compared to the 4 cities.
Also, the rate of dispersion, calculated using dispersion indicators in the system of the median is lower in the case of the hospital in Iaşi. This proves that, in the case of the hospital in Iaşi, most of the wards have values of the beds occupancy rate per hospital and per ward close to this medium, high level. The greatest differences are found between the hospital in Iaşi and the one in Timişoara, where the average occupancy rate is the lowest, but the variation rate is the highest.
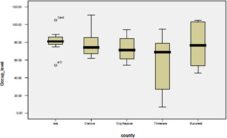
Figure 2. The variation of the Results of the Indicator “Beds’ Occupancy Rate per Hospital and per Ward”
Economico-medical Interpretation of the PIMAR Cycle
As an indicator, the beds occupancy rate per hospital and per ward shows how efficiently hospital beds are used throughout the 365 days of the year. Beds occupancy = Accountable hospitalization days or days accounted/average no. of beds used throughout the year. This should be of 280-300 days per year, representing 77-82%, the rest are days allocated to disinfection activities, which are absolutely necessary for a proper practice of the medical act.
The highest and most homogeneous beds occupancy rate is found in the hospital in Iaşi, in all the wards of the hospital. At the opposite pole stands Timişoara, with a lower rate, but also with greater dispersion.
The greatest differences in terms of beds occupancy rate are noted between Iaşi and Timişoara. The hospital in Iaşi is characterised by the highest occupancy rate in all wards, except for Cardio and AIC. This is due to the very diverse, severe cases, with morbidity characterising the two wards as follows: in AIC (anaesthesia — intensive care) patients are generally found recovering from surgery, but with a severe pathology, whereas in cardiology the patients’ conditions require a longer period of recovery after a heart attack or a mild heart attack. The hospital in Timişoara is characterised by a lower average occupancy rate, but with great variation between the wards.
Hypothesis 2
– H2: There are significant differences between the Emergency County Hospitals in Iaşi, Cluj, Timişoara, Craiova and Bucharest regarding the average length of stay per hospital and per ward.
– H0: There are no significant differences between the Emergency County Hospitals in Iaşi, Cluj, Timişoara, Craiova and Bucharest regarding the average length of stay per hospital and per ward.
Statistical Interpretation
There are no significant differences between the average levels of the values of the indicator the average length of stay per hospital and per ward between the Emergency County Hospital „Sfântul Spiridon” Iaşi and the other county hospitals (F=1,41, sig=0,24>0,05). H2 is rejected and H0 confirmed.
Hypothesis 3
– H3: There are significant differences between the Emergency County Hospitals in Iaşi, Cluj, Timişoara, Craiova and Bucharest regarding mortality rate within the hospital.
– H0: There are no significant differences between the Emergency County Hospitals in Iaşi, Cluj, Timişoara, Craiova and Bucharest regarding mortality rate within the hospital.
Statistical Interpretation
– There are no significant differences between the average levels of the values of the indicator mortality rate within the hospital between the Emergency County Hospital „Sfântul Spiridon” Iaşi and the other county hospitals (F=1,74, sig=0,15>0,05). H3 is rejected and H0 confirmed.
Hypothesis 4
– H4: There are significant differences between the Emergency County Hospitals in Iaşi, Cluj, Timişoara, Craiova and Bucharest regarding the percentage of medicine expenses out of the total expenses of the hospital.
– H0: There are no significant differences between the Emergency County Hospitals in Iaşi, Cluj, Timişoara, Craiova and Bucharest regarding the percentage of medicine expenses out of the total expenses of the hospital.
Statistical Interpretation
– There are no significant differences between the average levels of the values of the indicator the percentage of medicine expenses out of the total expenses of the hospital between the Emergency County Hospital „Sfântul Spiridon” Iaşi and the other county hospitals (F=1,25, sig=0,30>0,05). H4 is rejected and H0 confirmed.
The second category of performance indicators for which data have been collected is represented by a part of the performance indicators monitored by The National School for Public Health and Sanitary Management (N.S.P.H.S.M.).
Hypothesis 5
– H5: There are significant differences between the Emergency County Hospitals in Iaşi, Cluj, Timişoara, Craiova and Bucharest regarding the average values of the case mix indicator.
– H0: There are no significant differences between the Emergency County Hospitals in Iaşi, Cluj, Timişoara, Craiova and Bucharest regarding the average values of the case mix indicator.
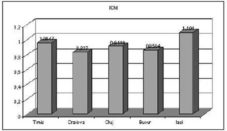
Figure 3. Average Values of the Case Mix Indicator (ICM)
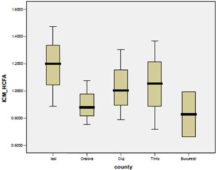
Figure 4. Values Variation of the ICM
The highest case mix indicator is registered in Iasi and the lowest in Bucharest. However, Timişoara registers the highest variation and Craiova the lowest variation, calculated through the dispersion indicators in the median’s system.
Economico-medical Interpretation of the PIMAR Cycle
From an economico-medical point of view, the case mix indicator (complexity of the diagnostics) reveals the following aspects:
– The cases hospitalised, investigated and treated in Iasi present a higher complexity compared to the other analysed hospitals, in similar conditions of hospital statute (Emergency County-universitary hospital).
– From an economic point of view, this aspect may bring with it better financing, CMI being an essential element in calculating, contracting and financing medical services from the County’s Health Insurance Institution.
– From a medical point of view, two main aspects can be emphasized:
– A good codification and classification of diagnostics, which proves a thorough preoccupation of the teams of physicians – codification used for a maximum improvement of the medical activity in the hospital.
– An incidence, prevalence and severity of the diagnostics greater in the N-E part of the country, considering the fact that the Emergency County Hospital “Sf. Spiridon” is a regional hospital.
Hypothesis 6
– H6: There are significant differences between the Emergency County Hospitals in Iaşi, Cluj, Timişoara, Craiova and Bucharest regarding the average values of the correspondence indicator.
– H0: There are no significant differences between the Emergency County Hospitals in Iaşi, Cluj, Timişoara, Craiova and Bucharest regarding the average values of the correspondence indicator.
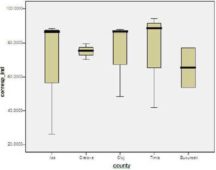
Figure 5. Values Variation of the ”Correspondence Indicator”
The highest average level is registered in Timişoara and the lowest average level is registered in Bucharest. In Iaşi, however, the highest variation is registered and the lowest in Craiova, calculated through the dispersion indicators in the median’s system.
Economico-medical Interpretation of the PIMAR Cycle
Firstly, the indicator points out a medical aspect related to the physician’s “precision” in establishing the diagnostics upon hospitalization, after the appropriate set of medical analyses and investigations are carried out, which, if it corresponds to the diagnostics given upon discharge, leads to:
– Hospitalization appropriate to the diagnostics and avoidance of useless internments.
– Practice of therapeutic diagrams according to internal protocols and guides of good practice with direct effect on the patient and on the hospitalization costs.
– Avoidance of extra costs related to the length of the hospitalization.
Hypothesis 7
– H7: There are significant differences between the Emergency County Hospitals in Iaşi, Cluj, Timişoara, Craiova and Bucharest regarding the average values of the indicator the percentage of patients with surgery interventions.
– H0: There are no significant differences between the Emergency County Hospitals in Iaşi, Cluj, Timişoara, Craiova and Bucharest regarding the average values of the indicator the percentage of patients with surgery interventions.
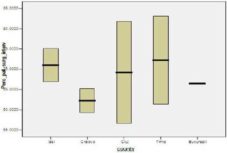
Figure 6. Values Variation of the Indicator “The Percentage of Patients with Surgery Interventions”
The highest average level is registered in Timişoara and the lowest average level is registered in Craiova. On the other hand, the highest variation between wards is registered in Cluj and the lowest in Bucharest, calculated using the dispersion indicators in the median’s system.
Economico-medical Interpretation of the PIMAR Cycle
The indicator has as purpose the internment of a patient in the surgical ward only with well fundamented medical prescriptions, based on evidence, the guiding principle being that the patient should not occupy a bed in the surgical ward without an operation appointment. The surgical ward is expensive and if the patient occupies a bed without justification, he does that to the detriment of another patient who needs hospitalization, but doesn’t have a bed available.
The closest the percentage is to 100%, the more medical professionalism and competence the indicator shows. At the same time, a high percentage in this indicator offers better chances to those who need a bed in a surgical ward, and avoids useless costs caused by unjustified internments.
From the analysis of the data obtained for each of the 7 indicators, a series of theoretical and applicable conclusions have been drawn regarding the functionality of the model.
The Analysis of the Model Functionality
The hospitals performance management model presents a series of advantages compared to the models currently used in Romania. Its main advantage compared to these is the fact that the management decisions and actions at a strategic and tactical level are connected to the system of performance planning and monitoring. The present performance management systems are mainly oriented towards the idea of reporting the level of performance by producing data following a series of indicators, their limitation being the disconnection between the measurement of the indicators and management actions which have not been correlated with any kind of strategic priorities. The suggested model comes to correct this vision in order to create a complete frame in which a valid hospital performance management can take place.
The first key element of a correct functioning of the model is establishing and periodically changing the indicators, based on their correspondence with the prior strategic orientations at a certain point, at hospital or at a national level. In this manner, a strategic alignment is reached necessary for allowing the set strategic targets to be attained, at hospital or at a national level.
The second key element of a correct functioning of the model is triggering the PIMAR cycle based on the performance information collected using the indicators included in the performance management system. Measuring the indicators with a high strategic relevance and sensibility regarding the functioning of the system represents the basis for the decisions of the hospital managers and of the deciding factors in the public health at national level.
Another key element in the functioning of the model includes feedback possibilities. The Regulation stage included in the model induces control maintenance over performance through contextual actions necessary for correction or improvement.
A major advantage of the system, proven through the testing of the 7 hypotheses above, is that it allows certain interpretations to be obtained regarding performance at a medical level as well as at administrative and economic levels.
Still, the model does have its series of limitations. First of all, it is conceived as a system subject to available information regarding the functioning of the hospital, thus it is strongly dependent on the means of collecting and interpreting primary data regarding the functioning of the hospital. Functional or organizational errors upon conceiving this internal component in the functioning of a hospital may lead to serious errors at the level of the measured indicators. Measurement accuracy is a key element in the case of a highly sensible system.
Another limitation of the model is given by its reactivity. This depends on the rhythm in which information is produced within the hospital. Thus, some indicators can only be relevantly measured throughout longer periods of time (a month or even a year), which may lead to the impossibility of using this information for operational management decisions. Precisely for this reason, the usage indication of the model refers especially to tactic and strategic decisions. Although they causally represent the basis of the obtained performance, the managers’ operational decisions must rely on other warning and informing systems regarding the day to day state of the hospital.
Conclusions
The validation of the performance management model in public health services has been accomplished based on tracking a set of 7 indicators in the 5 hospitals used as samples.
The functionality of the model has been proved by validating the interpreting possibilities of the collected data using the indicators included contextually in such a system, as well as by validating the connections between the different values of the indicators and their implications within the PIMAR cycle.
The suggested model has shown a series of assets and advantages compared to other models presently used in Romania. Among these are noted: adapting the list of indicators to the strategic priorities; including an active vision in the performance management by using the PIMAR cycle, in order to complete the static vision of performance reports; maintaining and improving performance systematically, through the suggested regulating mechanism; and last, but not least, using the model multidimensionally, in medical matters as well as in the economic or administrative matters within a hospital.
The limitations of the model are given by its sensibility and reactivity. Its sensibility to the initial information generates the risk of major deviations in performance if the model is used starting from erroneous information. The attention towards conceiving a correct internal informational system in a hospital is critical. The reactivity of the model, dependent on the indicators whose measuring sometimes require long periods of time, leads to the impossibility of using it in operational decisions, consequently leading to the model being recommended only for tactical and strategic decisions and actions.
References
Barliba, I. & Bogdanici, C. (2007). “Managementul Unui Spital – Modele de Evaluare,” Revista medico-chirurgicala a societatii de medici si naturalisti din Iasi, 111(4), 1005- 1011.
Publisher
Cameron, K. S. & Whetten, D. S. (1983). Organizational Effectiveness: one Model or Several?, In: Cameron KS, Whetten DA, editors. Organizational effectiveness: a comparison of multiple models, (ed), Academic Press, San Diego.
Publisher – Google Scholar
Champagne, F., Guisset, A. L., Veillard, J. & Trabut, I. (2005). ‘The Performance Assessment Tool for Quality Improvement in Hospitals,’ Universite de Montreal: Montreal, Canada;
Google Scholar
Charland, K. (2007). “Pay for Performance Comes to Medicare in 2009,” Health Finance Management, 61(9), 60-64.
Publisher – Google Scholar
Etienne, M., Sicotte, C. l. & Champagne, F. et.al. (2008). “Hospital Performance: Competing or Shared Values?,” Health Policy, 87(1), 8-19
Publisher – Google Scholar
Fuchs, V. R. (1986). ‘The Health Economy,’ Harvard University Press: London, UK
Leggat, S. G. Narine, L. Lemieux-Charles, L. Barnsley, J. Baker, G. R. Sicotte, C. Champagne, F. Bilodeau, H. (1998). “A Review of Organizational Performance Assessment in Health Care,” Health Services Research Management; 11(1), 3—23.
Publisher – Google Scholar – British Library Direct
March, J. G. & Sutton, R. I. (1997). “Organizational Performance as a Dependent Variable,” Organization Science; 8(6), 698—706.
Publisher – Google Scholar – British Library Direct
Robinson, R. (1993). “Economic Evaluation and Health Care – Cost and Cost-minimization Analysis,” BMJ, 307, 726-728.
Publisher – Google Scholar – British Library Direct
Vittori, G. & Houghton, A. (2007). “Higher Performance Healing Environments,” Health Estate 61(7), 21-27.
Publisher – Google Scholar
Vlădescu, C. & Dragomirişteanu, A. (2001). ‘Politici de Alocare a Resurselor şi de Planificare a Personalului Medical în Sistemele de Sănătate. România în context internaţional,’ Făgăraş Print Publishing House: Bucharest, Romania
Google Scholar
World Health Organization. (2003). “Measuring Hospital Performance to Improve the Quality of Care in Europe: A need for clarifying the concepts and defining the main dimensions”, World Health Organization Workshop, Barcelona, Spain.
Google Scholar
World Health Organization, Health Evidence Network — Evidence for Decision Makers. (2003). ‘How Can Hospital Performance be Measured and Monitored?,’ World Health Organization
Google Scholar