Introduction
The concept of demographic transition entered in the scientific language through the works of F. Notestein since 1945. Initially, this concept was defined from a descriptive perspective by means of several demographic indicators, of which the most important are the population growth rate, the birth rate and mortality rate. The pattern admitting a low natality and mortality rate, namely a weak population growth rate, represents the population behavior specific for the demographic transition.
The demographic transition was observed especially in the developed countries. The basic idea is that the more a country develops, the more chances are that the mortality and birth rate decreases until a relatively stable level, without significant variations. The research also highlights that political measures may accelerate the demographic transition phenomenon, especially those regarding the opportunities and the equality of chances for women on the labor market and in the social life (Arbetman and Kugler, 1997).
An explanation of the nature of the demographic transition phenomenon may be given from a strictly demographic perspective. Van de Kaa (1987) believes that the decline in fertility at a lower level than the replacement one is the main demographic feature of transition. This low fertility rate is explained by several mechanisms such as: the postponement of marriage, and of first birth, the increase in the divorce rate, the increase in the single persons rate, the increase in the rate of persons who prefer the consensual union to marriage, etc. These features are generally observed in the demographic behavior of populations in the developed Western countries (Lesthaeghe, 1995). The two cited authors consider that demographic transition is a long process containing well-defined stages and specific characteristics. The analysis from this standpoint might allow the comparison among countries, the identification of leaders as well as of the countries with the lowest values of demographic indicators (Sabotka et all, 2003).
Another explanation may be established from a wider perspective, regarding the development process of the entire society. In this process, an essential role is played by the cultural factor, the prevalent values and ideas contributing to the social change. The increase in the individual autonomy, the idea of the right to self-fulfilment, the superior needs are seen as the main mechanisms behind the demographic transition process (Van de Kaa, 1987).
The studies conducted on the demographic transition in the CEE countries proposed the concept of crisis of demographic transition for the demographic changes from these countries occurring after 1990 (Cornia and Paniccià , 1996, Kohler, 2002). The crisis situation implies the non-compliance with certain hypotheses advanced by the theory of demographic transition, especially regarding the relationship between demographic phenomena and economic and social development. The analyses of the demographic transition crisis for the CEE countries admit at least three possible scenarios. Some authors sustain that the demographic regress, being a combination of the low birth rate, the high mortality rate and a negative net migration, is the result of the precarious economic situation and of low life standards (Vassiliev, 2005) as well as of social changes specific to some transition countries (Cornia and Paniccià , 1996). Other studies offer a strictly demographic explanation of the situation of these post-communist countries (Vishnevskii, 1999), in line with the theory of the second demographic transition. There are also studies that take into account both the effects of demographic transition and those of economic transition. Thus, the low fertility rates are caused by the postponement of first birth, the decrease in birth rate and the conditions of economic crisis in these countries (Billingsley, 2010). A general observation regarding the recent studies is that the empirical analyses are conducted on relatively short time series and the conclusions are set in relation to the variations noticed during these periods. In the present study, we would like to overcome such a limitation, considering the long-term evolution trends of the main demographic phenomena, starting with the year 1970 until 2010.
In this paper, we formulate the hypothesis that the demographic situation of the CEE countries after 1990 mainly represents a continuation of the demographic trends from the previous period, trends which were neglected by certain studies. We also have in view that after 1990, there is a short shock period extending a previous evolution trend, but this shock has a short-term influence, while the variations of demographic indicators return to their previous trend and tend to stabilize. The negative demographic situation of the analyzed countries should be correlated with the great inertia in time of demographic phenomena as well as with the lack of coherence of some demographic political measures which might allow some changes of these trends, as it had happened with the West European countries.
The main goal of this paper is to quantitatively describe the demographic transition coordinates in the Central and East European (CEE) countries by means of univariate and multivariate statistical analysis, before and after 1990. The existence of a common pattern for these countries was advanced by recent studies (Chawla, M. et al., 2007), however important differences are believed to exist inside the European zone especially among the states which adhered to the EU and the other ones. In this paper, an analysis from the perspective of demographic transition is proposed, aiming at identifying certain correlations among the demographic phenomena at the level of the Central and Eastern European countries belonging to the EU: Bulgaria, Czech Republic, Estonia, Latvia, Lithuania, Poland, Romania, Slovenia, Slovakia, and Hungary. In terms of approach, we undertake the study of data series regarding the demographic phenomena for two different periods: 1970-1989 and 1990-2010.
As a consequence, the next part of the paper presents the results of a comparative descriptive statistical analysis for the main demographic phenomena which are determinant for the demographic transition at the level of the 10 countries. In the third chapter, the study focuses on the main changes of demographic transition process after 1990 and a comparison with the previous period is undertaken. Then, a multivariate statistical analysis follows, indicating the main determinants of demographic transition and showing similarities and differences among the CEE countries regarding the variables that highlight the demographic transition elements, both during the previous period and the crisis time of the phenomenon.
The Coordinates of the First Stage of Demographic Transition: 1970-1989
Starting with the 1970s, for the CEE countries, the existence of a common model of demographic development can be noticed more clearly than ever. For the 10 countries under study (see Table A1 in the Annex), the analysis of the main demographic indicators allows us to shape the characteristics of this common pattern.
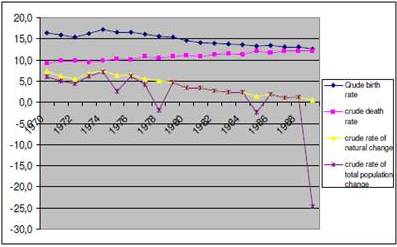
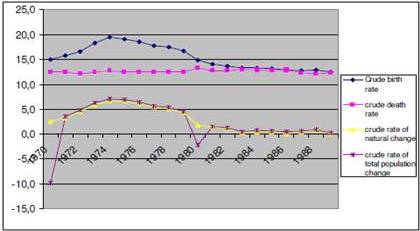
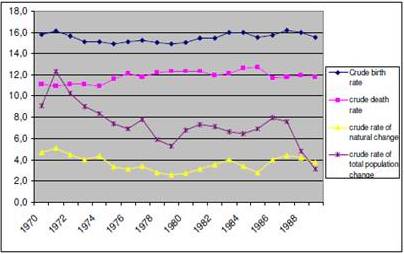
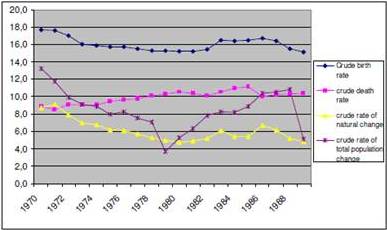
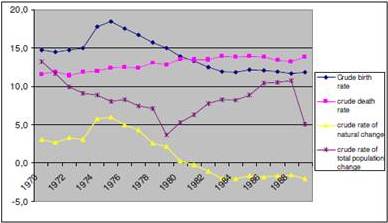
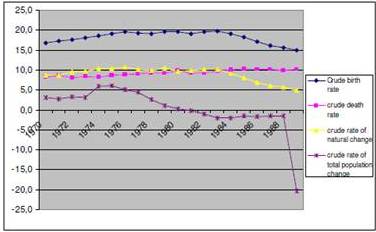
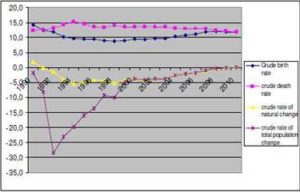
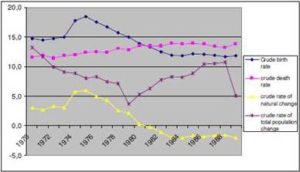
The first important observation concerning the demographic evolution of the analyzed countries is that the hypothesis of the demographic transition theory of birth rate decrease is met. Between 1970 and 1989, for the analyzed countries, the long-term trend is of decrease in the number of births per one thousand inhabitants and implicitly the drop in total fertility rate. Even if there are slight increases in birth rates, in the first years of the seventh decade in Czech Republic, Slovakia, Hungary, Bulgaria and respectively, in the second half of the eighth decade, in Estonia, Poland, Romania, Latvia, Lithuania, the phenomenon registers a continuous descending trend at the end of the decade, so that in 1989 the indicators are below the level of the year 1970. Only in Estonia and Latvia the birth rate does not have a trend during this period; however it registers variations around an average value of 15.5 births per one thousand inhabitants. As Figure 1 also shows, the fertility rates are on a descending trend, despite the previously signalled variations, so that at the end of the communist period 8 of the 10 countries have this rate below the level of generation replacement (2.1 children per woman).
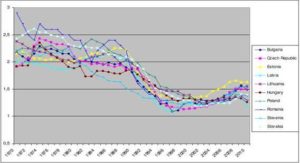
Source: Done by the author according to the data provided by Eurostat and World Bank, 2011
Figure1: The Evolution of Fertility Rates during 1970-2010
The variation model of fertility rates, besides the long-term decreasing trend, is that of a fluctuant variation with increases and decreases on a short period of approximately five years. A possible explanation of these fluctuations could be the attempt of communist states to revive natality through political measures (Billingsley, 2010), but the effects are only on a short run, while the general trend does not suffer too much. If we accept the idea that during 1970 and 1989 there is a stage of demographic transition with a common pattern for the 10 countries, we have to identify the demographic variables leading to this common trend of fertility decrease.
The birth rate decreasing trend in the countries of Central and East Europe could be firstly correlated with the evolution of family situation, meaning with marriage and divorce. The analysis of available data allows us to formulate the hypothesis according to which an important factor in the birth rate decrease is the marriage rate decrease and the divorce rate increase, phenomena that could be observed throughout the entire period at the level of the EU. With the exception ofLithuania and Latvia, the other 8 of the 10 analyzed countries present a descending trend for nuptiality. The most important decrease in nuptiality was registered in Slovenia from 8.2 to 4.9, variation that may be correlated with an important decrease in the birth rate from 15.9 to 11.7 births per one thousand inhabitants. Slovenia has the lowest fertility rate of all countries, with values below the replacement rate since the ‘80s. At the same time, during 1970-1989, the divorce rates had an increasing trend in all the countries under analysis. Estonia, Lithuania, Czech Republic and Hungarycan be mentioned with values above 2 per one thousand, increasing towards 3, respectively 4 divorces per one thousand inhabitants, comparatively with the other countries which have increasing values from 1 to 1.5.
Another factor that could be correlated with birth rate decrease is the postponement of woman to enter in the family life and to give birth. The analysis of statistical data (according to UNO, 2011) shows that during the period 1970-1989 an increase in the average age at first birth is registered, but without very important evolutions. Not even among countries there are great differences for this indicator, Bulgaria having the lowest age, of 24 years, while Latvia and Lithuania the highest, of 27 years. The variations of the indicator for the entire period are on average of 1 year, with weak decreases and increases. The average age at marriage is also increasing, though without important fluctuations in this period. In 1970, the differences among the states are of maximum 1 year (values comprised between 21 and 22 years), and in 1989 the same differences exist, the average increase of the indicator being of 2 years and the variations being between 22 and 24 years.
In opposition with the theory of demographic transition, in the analyzed states, the mortality phenomenon does not have a decreasing trend, as it was expected, on the contrary. Excepting Czech Republic and Slovenia where the mortality rates are approximately constant during the whole period, in the other countries the death rate is increasing. The presented data in Table 1A highlight a significant difference of mortality rate between Czech Republic and Hungary, on one hand, and the other countries, on the other hand. An explanatory factor could be the difference between these countries as regards the demographic ageing. Indeed, during the analyzed period, Czech Republic has the highest indicators of demographic ageing of all analyzed countries, according to the data provided by UNO. Thus, in 1970 CzechRepublic has the highest rate of old age demographic dependency (over 20%) and the highest median age (33 years) and only by the end of the period it is surpassed by Hungary and Bulgaria.
The cumulated evolutions of birth rate and death rate are observed by means of the natural growth rates of the population. For the period 1970-1989, the general picture of demographic evolution in the 10 countries from the Central and East Europe is declining, and from one year to another the population natural growth rate is more and more reduced. This picture is concordant with the theory of demographic transition which advocates the closeness of natality and mortality rates and the decrease in the population natural growth rate.
The reduced mobility rate of population during the communist period is confirmed by the low and negative values of the growth rates of the net migration. These weak losses of population through migration are rendered by the total growth rates of population which in general have smaller values than those of the natural growth rates. The migration variations are more intense in the Baltic countries, with positive values of the net growth rates of migration, still decreasing towards the year 1989.
The Determinants of Demographic Transition After 1990
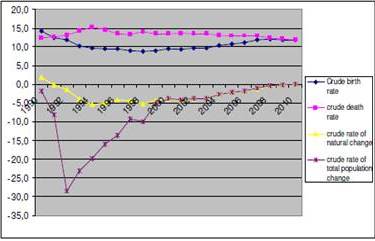
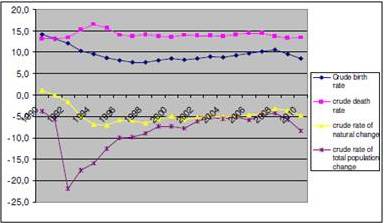
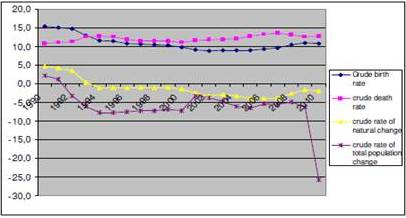
The most visible change after 1990 was the registration of a negative natural growth, phenomenon met only in exceptional circumstances such as natural disasters or war times. The explanations for the increase in the crude mortality rate over the birth one may be offered through several perspectives. As a rule, it is favoured the idea according to which the crisis of demographic transition is the result of the increase in economic instability, social stress and inadequate political measures (Cornia and Paniccià , 1996) meaning it is determined by the new social and economic conditions of transition towards the democratic society.
Countries such as Bulgaria, Czech Republic, Lithuania, Romania, Slovenia, which have a negative natural growth after 1990, practically continue the natality and mortality demographic trends that we analyzed in the previous chapter. For the other countries as well, the closeness of these two rates and the small variations that lead to either a negative natural growth or to a positive one, represents another side of the mechanism of demographic development. On the basis of existing trends, we may consider that for the countries under study we have to deal with an issue pertaining to the nature of demographic phenomena, more precisely to their inertia in time. Thus, the demographic transition for the CEE countries does not seem to suffer from a dramatic break with the past, but it rather enters a critical situation occurring from the extension of previous trends.
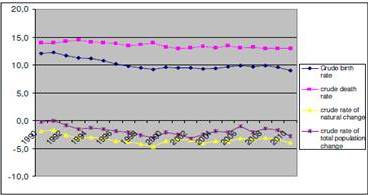
A first observation regarding the changes after 1990 is that the decrease in birth rates and in total fertility rates happens at a higher pace in the first five years, without these variations being much more significant than during 1975-1980, for instance. What could be remarked during the period 1990-1995 is a relative closeness of fertility values for all 10 countries as well as a relatively equal variation pace. After 1995, the variation is much weaker and tends to become stable, following a growth period at the end of the analyzed period, during 2005-2010. This behaviour confirms the theory of demographic transition in the analyzed countries. The stability trend of natality variations around a low value (approximately 10 births per one thousand inhabitants) is confirmed for all the analyzed countries. The decrease in total fertility rate below the generation replacement limit of (2.1 children per woman) already occurred for some countries in the previous period, and after 1990 the values continue to drop and become stable around the average figure of 1.4. It is important to notice that these values are below the EU average, which indicates that the analyzed countries have a less favorable demographic situation than the western countries.
The question is whether after 1990 there are important mutations for the demographic indicators correlated with fertility. The statistical data prove that the nuptiality decrease after 1990 follows approximately the pattern of the previous period, that is a decreasing trend and the variations do not exceed the average interval of two marriages per one thousand persons. The evolution pattern is the same with the fertility one: a higher variation speed in the first 5 years and then a relative stability of variations, with the relay of the variation at the end of the period. It is interesting that in the first five years, the mother’s average age at the birth of her first child does not have a significant variation which might explain the higher pace of fertility variation. The age increase accelerates after 1995, so that at the end of the period the values are between 25 and 27 years, excepting Slovenia. The same trend is registered by the evolution of the women’s average age at marriage. In the first years after 1990 the variation is weak, in line with the previous trend and the variation speed is to increase towards the end of the ‘90s. The increase in the woman’s average age at marriage changes from the interval 22-24 years in 1990 to 25-28 years at the end of the period. The divorce rate evolution is not surprising after 1990. InEstonia and Lithuania the trend is descending, Czech Republic has slight variations around the value of 3, while the other countries have a slight increasing trend between 1-2 divorces per one thousand persons.
The analysis of specific fertility by age groups confirms the theory of demographic transition of postponement of births and of decreasing the specific fertility rates at the first age intervals. Thus, after 1990, in the studied countries decreases in the specific rates for the groups 15-19, 20-24 years are observed, a relative stability, with decreases and relays of rates for the group 25-29 years and an increase in rates for the groups 30-34, 35-39 years.
Therefore, the shock of fertility decrease in the first years after 1990 is not explained by a similar variation of the variables supported by the theory of demographic transition. Apart from the similar evolution of nuptiality, the other variables do not follow the same pattern, on the contrary. The abortion liberalization in 1990 was a political measure whose outcomes can be observed through a contextual effect on natality, in the first 5-7 years after 1990. The official data for migration are obviously underestimated, but in the first years after 1990, there was a more accentuated trend of persons from these countries that had just left communism. This trend may be correlated with the more important decrease in natality in the first 5 years after the fall of the communist bloc.
The second important observation is related to the evolution of mortality rate. As a trend, after 1990, the EU average registers a slight decrease, especially due to the evolutions in the Western European countries. The CEE countries remain with high mortality values, with small fluctuations that preserve the previous trend of slight growth for some countries and of stabilization of changes for the majority of them. The lack of a decreasing trend of mortality after 1990 could be also correlated with the evolution of indicators for demographic ageing. The life expectancy registers an average increase with approximately 5 years during 1990-2010, the median age also increasing by 5 years, while the old-age dependency rate increases on average by 4%.
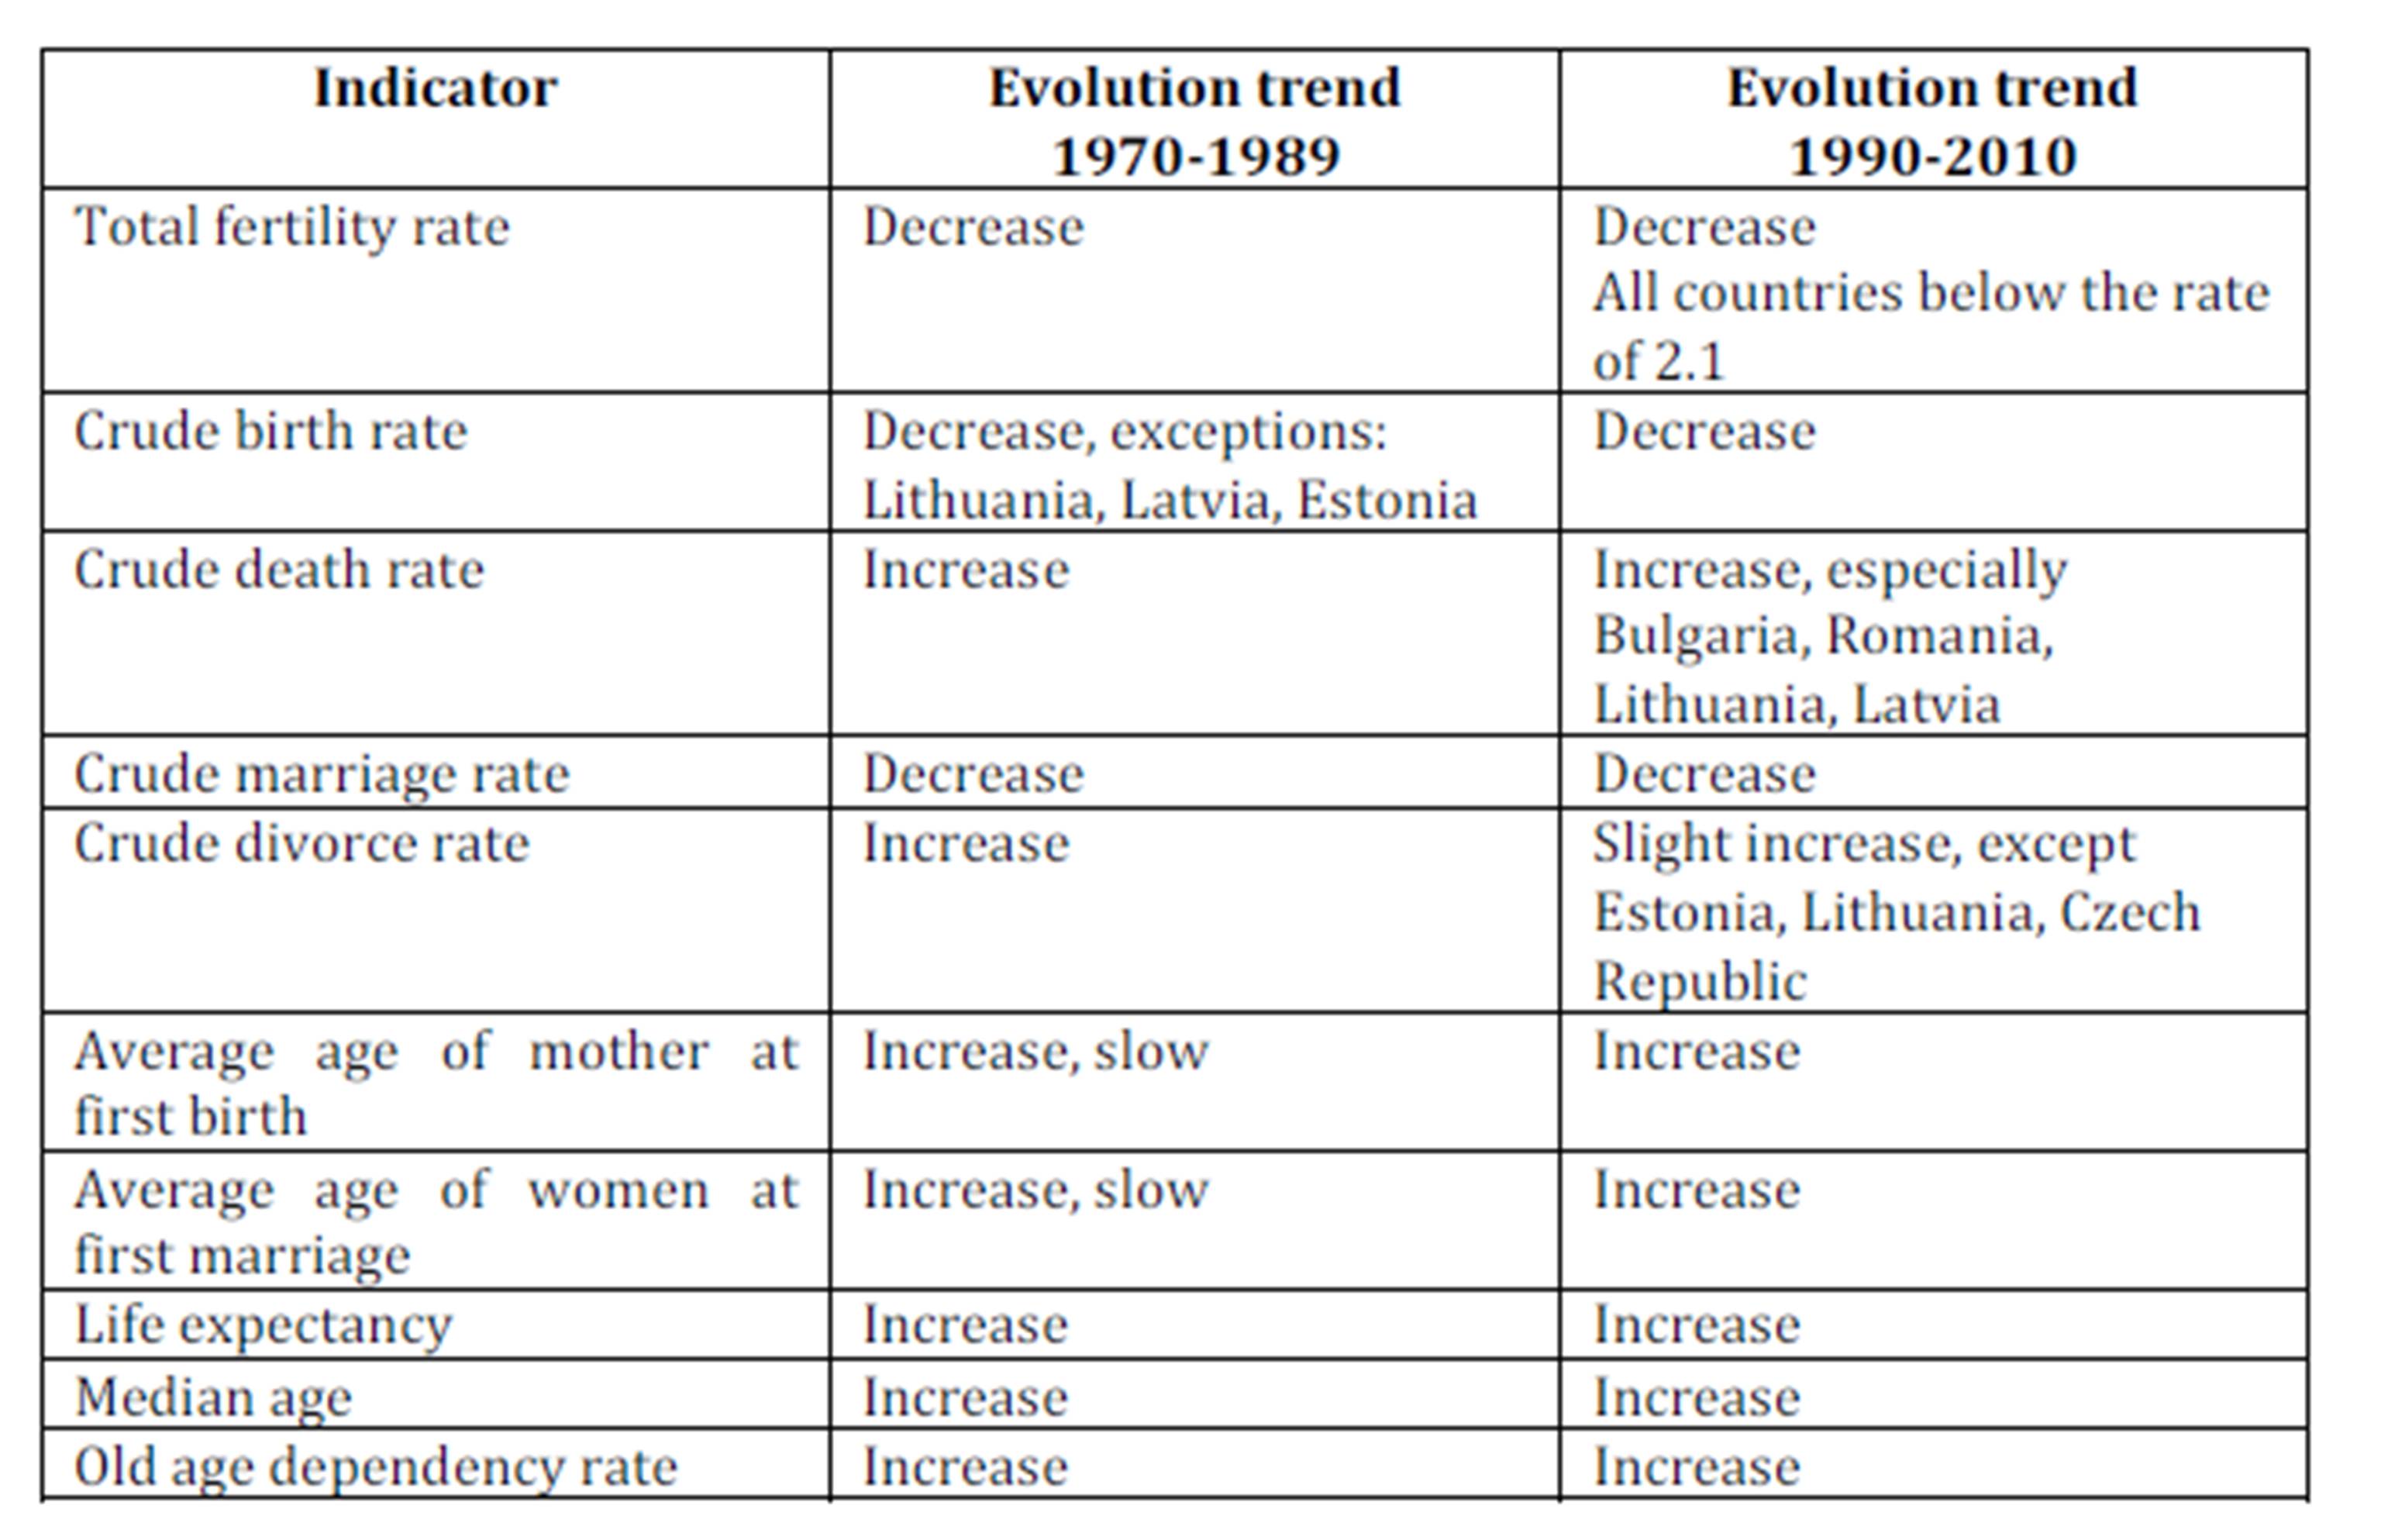
Table 1: The Comparative Analysis of Demographic Situation for the 10 Countries during the Two periods
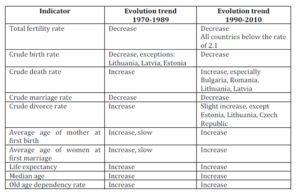
The comparative analysis of the main demographic indicators showing the process of demographic transition for the 10 countries and for the two periods is presented in table 1. The main conclusion of the demographic transition study in the CEE countries belonging to the EU is that the demographic determinants continue their evolution trends from the period 1970-1989 during the period 1990-2010, without significant changes. The specificity of these countries lies in the fact that during the communist period, the model of demographic transition had a similar pattern with that presented by the specialty literature, except/with the exception of making mortality. After the fall of the communist bloc, the transition society did not change these previous trends. A certain acceleration of the fertility variation in the first 5 years after 1990 is correlated with a similar variation of nuptiality, migration and abortion.
The Multivariate Statistical Analysis of Demographic Transition in the Central and Eastern European Countries
To highlight the existence of differences between the two periods, we will consider the analysis for the years 1970 and 2010 by means of the principal component method (Factor Analysis) using the variables from Table 1.
The principal component method selects those significant indicators for the demographic behavior of the analyzed countries and offers some groups of countries according to the selected variables. The differences and resemblances between the two years, as well as those among the 10 countries enable the evaluation of the formulated hypotheses and may suggest certain hypotheses which could be subsequently verified by means of other demographic, social and economic variables. Two principal components were chosen to be defined explaining at least 70% of the total variation at the level of the studied countries.
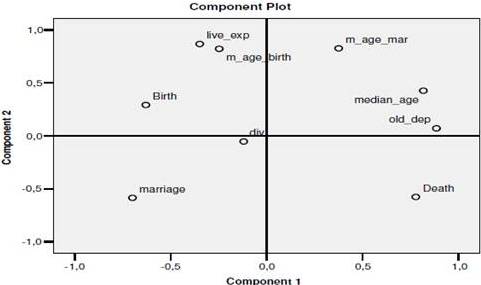
The analysis using the principal component method for the year 1970 has led to the following results, using SPSS. Figure 2 presents the coordinates of variables on the two principal components or on the two factorial axes, namely the correlation coefficients between each variable and the factorial axis. We consider the variables with a coefficient higher than 0.6 to be significant. In Figure 2 may be also observed the position of each variable on the factorial axes as well as the correlations among variables.
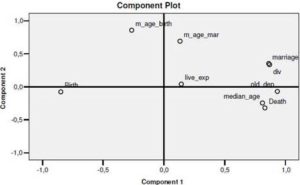
Figure 2: The Position of Variables on the Factorial Axes, for the Year 1970
The mortality rate, the old-age demographic dependency rate, the median age, the divorce rate, the marriage rate have positive coordinates on the factorial axis and among these variables there is a positive correlation, while the birth rate has negative coordinates and is negatively correlated with the first group of variables. On the second axis, the woman’s average age at first marriage and the woman’s average age at first birth have a positive position. Mortality is directly correlated with demographic ageing and with divorce and is inversely correlated with natality.
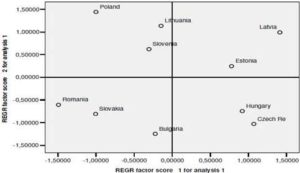
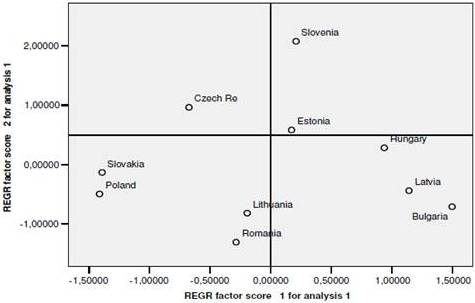
Figure 3: The position of Countries in the System of the Two Factorial Axes, in the Year 1970
When comparing the factorial map of variables (Figure 2) with that of the analyzed countries (Figure 3), the following conclusions can be drawn:
- Latvia, Czech Republic, Hungary and Estonia have high values for the variables mortality rate, demographic dependency rate, median age and divorce rate and low values for birth rate. In comparison, Poland, Romania andSlovakia have opposite values.
- Poland and Lithuania have high values for the woman’s average age at first marriage and at first birth, comparatively with Bulgaria.
The results of the analysis for the year 2010 are presented in the table and graphs below. The data in Figure 4 indicate the positive position of mortality, median age and old-age demographic dependency on the first axes, in comparison with the marriage rate and birth rate, which have a negative position. On the second axis, life expectancy, women’s median age at first marriage and at first birth have a positive position and are positively correlated.
By correlating the information in Figures 4 and 5, we observe the mirror-like position of Bulgaria, Latvia and Hungary, with high values for mortality, median age and old-age demographic dependency, comparatively with the position of Slovakiaand Poland, which have high values for births and marriages. Romania and Lithuania have low values for the variables placed on the second factorial axis, in comparison with Slovenia.
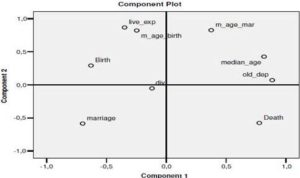
Figure 4: The Position of Variables on the Factorial Axes for the Year 2010
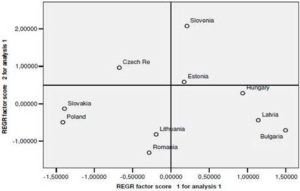
Figure 5: The position of countries in the System of the Two Factorial Axes for the Year 2010
The comparative study of the results for the two years belonging to two different periods confirms the hypothesis that for the CEE countries the demographic determinants are the same. As it was expected, unlike 1970, life expectancy becomes significant, while divorce is no longer significant in 2010. The death rate is correlated with aging indicators and the birth rate with marriage.
Conclusions
The analyses conducted in this study have resulted in the following conclusions:
- The theory of demographic transition of natality decrease is met, both during 1970-1989 and during 1990-2010. The study of demographic trends also indicates a relative stability of the population natural growth rate, with very low values, close to zero, positive and negative.
- A possible correlation of natality decline with the increase in the average age at marriage and with the average age at first birth is unlikely, at least during the period 1970-1989, when these indicators have very weak variations. However, after 1990, these variables have known a more important development than the previous one, but birth rate enters a relatively stable period, with very weak variations, after the first five years of post-communism. The analysis of principal components confirms the existence of a positive correlation between natality and nuptiality, and of the studied countries, we should mention Romania’s position with high values for these indicators.
- Contrary to the theory of demographic transition, in the Central and Eastern European Countries, mortality represents an important demographic phenomenon, with high rates, but its trend is increasing during the entire period under analysis.
- The multivariate analysis confirms the hypothesis expressed in the study of statistical series at the level of each country, stating the existence of a correlation between mortality and demographic ageing. Czech Republic,Hungary, Latvia, Bulgaria are countries worth to be mentioned in this respect, having high rates of mortality and high indicators for demographic ageing.
- In opposition with what certain studies sustain in relation to the crisis of demographic transition, the analyses of demographic trends show that after 1990 not only does the development of demographic transition from the previous period continue, but it also registers a certain stability, with more important variations only in the first 5 years after 1990. The transition period after 1990 seems to have no significant influence for the medium and long-term variations of natality and mortality.
- The ranking of the 10 countries below the EU average as regards fertility after 1990 shows a situation of the demographic transition which might be explained by the revival of the demographic situation in the western countries, while the countries belonging to the Central and East Europe need to cope with this aspect.
Acknowledgement
The present paper has benefited from the financial support of the project “Post-doctoral studies in Economics: lifelong training project of outstanding researchers — SPODE”, project co-financed by the European Social Fund through the Sectorial Operational Programme Development of Human Resources 2007-2013, financing contract no. POSDRU/89/1.5/S/61755.
References
Arbetman, M. & Kugler, J., ed. (1997). ‘Political Capacity and Economic Behavior,’ Boulder, Westview.
Google Scholar
Billingsley, S. (2010). “The Post-Communist Fertility Puzzle,” Popul Res Policy Rev, 29, 193—231.
Publisher – Google Scholar
Chawla, M. Et al. (2007). From Red to Gray: The ‘Third Transition’ of Aging Populations in Eastern Europe and the Former Soviet Union. World Bank, the International Bank for Reconstruction and Development.
Publisher – Google Scholar
Cornia, G. A. & Paniccia, R. (1996). “The Transition’s Population Crisis: an Econometric Investigation of Nuptiality, Fertility and Mortality in Severally Distressed Economies,” MOCT-MOST, 6, 95-129.
Publisher – Google Scholar
Jemna, D. V., Asandului,M., (2010). ‘The Impact of Demographic Ageing on the Economic Development in Romania,’Metalurgia International, 15, 2, 61-66
Kohler, H. P. & Kohler, I. (2002). “Fertility decline in Russia in the Early and Mid 1990s: the Role of Economic Uncertainty and Labour Market Crises,” European Journal of Population, 18, 233—262.
Publisher – Google Scholar – British Library Direct
Lesthaeghe, R. (1995). ‘The Second Demographic Transition in Western Countries: an Interpretation,’ in K. O. Mason and A.-M. Jensen (Ed), Gender and Family Change in Industrialized Countries, Clarendon Press, Oxford, 17-62.
Google Scholar
Notestein, F. (1945). ‘Population, the Long View,’ In Food for the World, Schultz, T.W. (Ed), Chicago, University of Chicago Press.
Google Scholar
Sobotka, T., Zeman, K. & Kontarova, V. (2003). “Demographic Shifts in the Czech Republic After 1989: a Second Demographics Transition View,” European Journal of Population, 19, 249—277.
Publisher – Google Scholar – British Library Direct
Van De Kaa, D. J. (1987). “Europe’s Second Demographic Transition,” Population Bulletin, 42, 1-57.
Publisher – Google Scholar
Vassilev, R. (2005). “Bulgaria’s Demographic Crisis: Underlying Causes and Some Short-Term Implications,” Southeast European Politics, 6 (1), 14-27.
Publisher – Google Scholar
Vaupel, J. W. & Kistowski, K. G. V. (2008). “Living Longer in an Ageing Europe: a Challenge for Individuals and Societies,” European View, 7, 255—263.
Publisher – Google Scholar
Vishnevskii, A. (1999). “The Demographic Potential of Russia,” Russian Social Science Review, 40 (4), 11.
Publisher – Google Scholar – British Library Direct
Annex
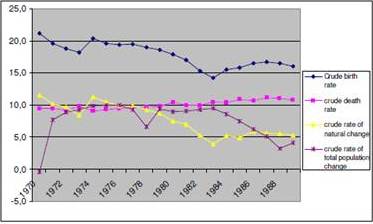
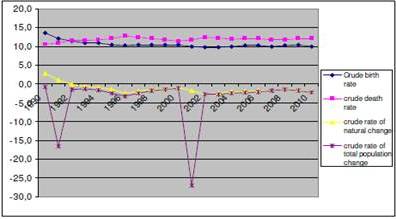
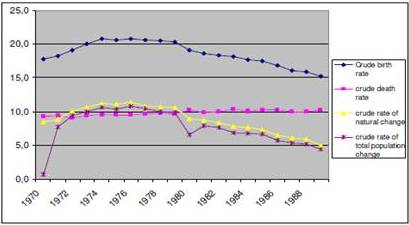
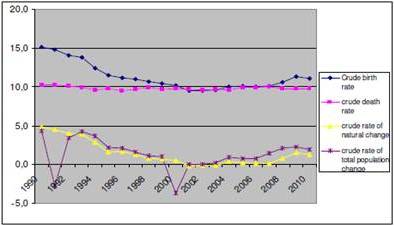
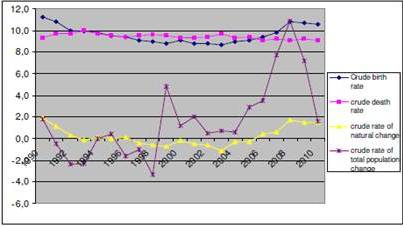
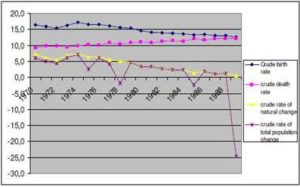
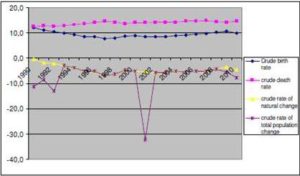
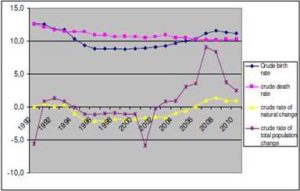
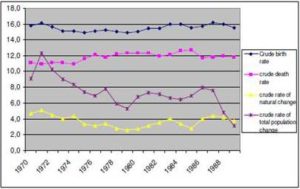
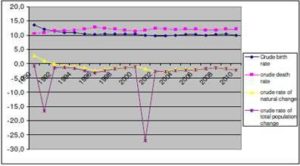
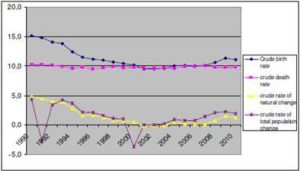
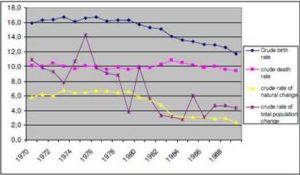
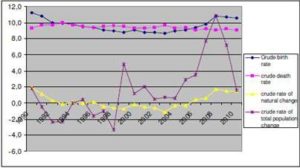
Table A1: Comparative evolution of crude birth rate, crude death rate, rate of natural change and rate of total population change for 10 Eastern European Countries
| Country |
1970-1989 |
1990-2010 |
|
Bulgaria
|
|
|
|
Czech Republic
|

|
|
|
Estonia
|
|
|
|
Latvia
|
|
|
|
Lithuania
|

|
|
|
Hungary
|
|
|
|
Poland
|

|
|
|
Romania
|
|
|
|
Slovakia
|

|
|
|
Slovenia
|
|
|