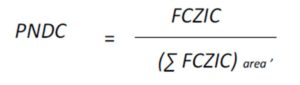
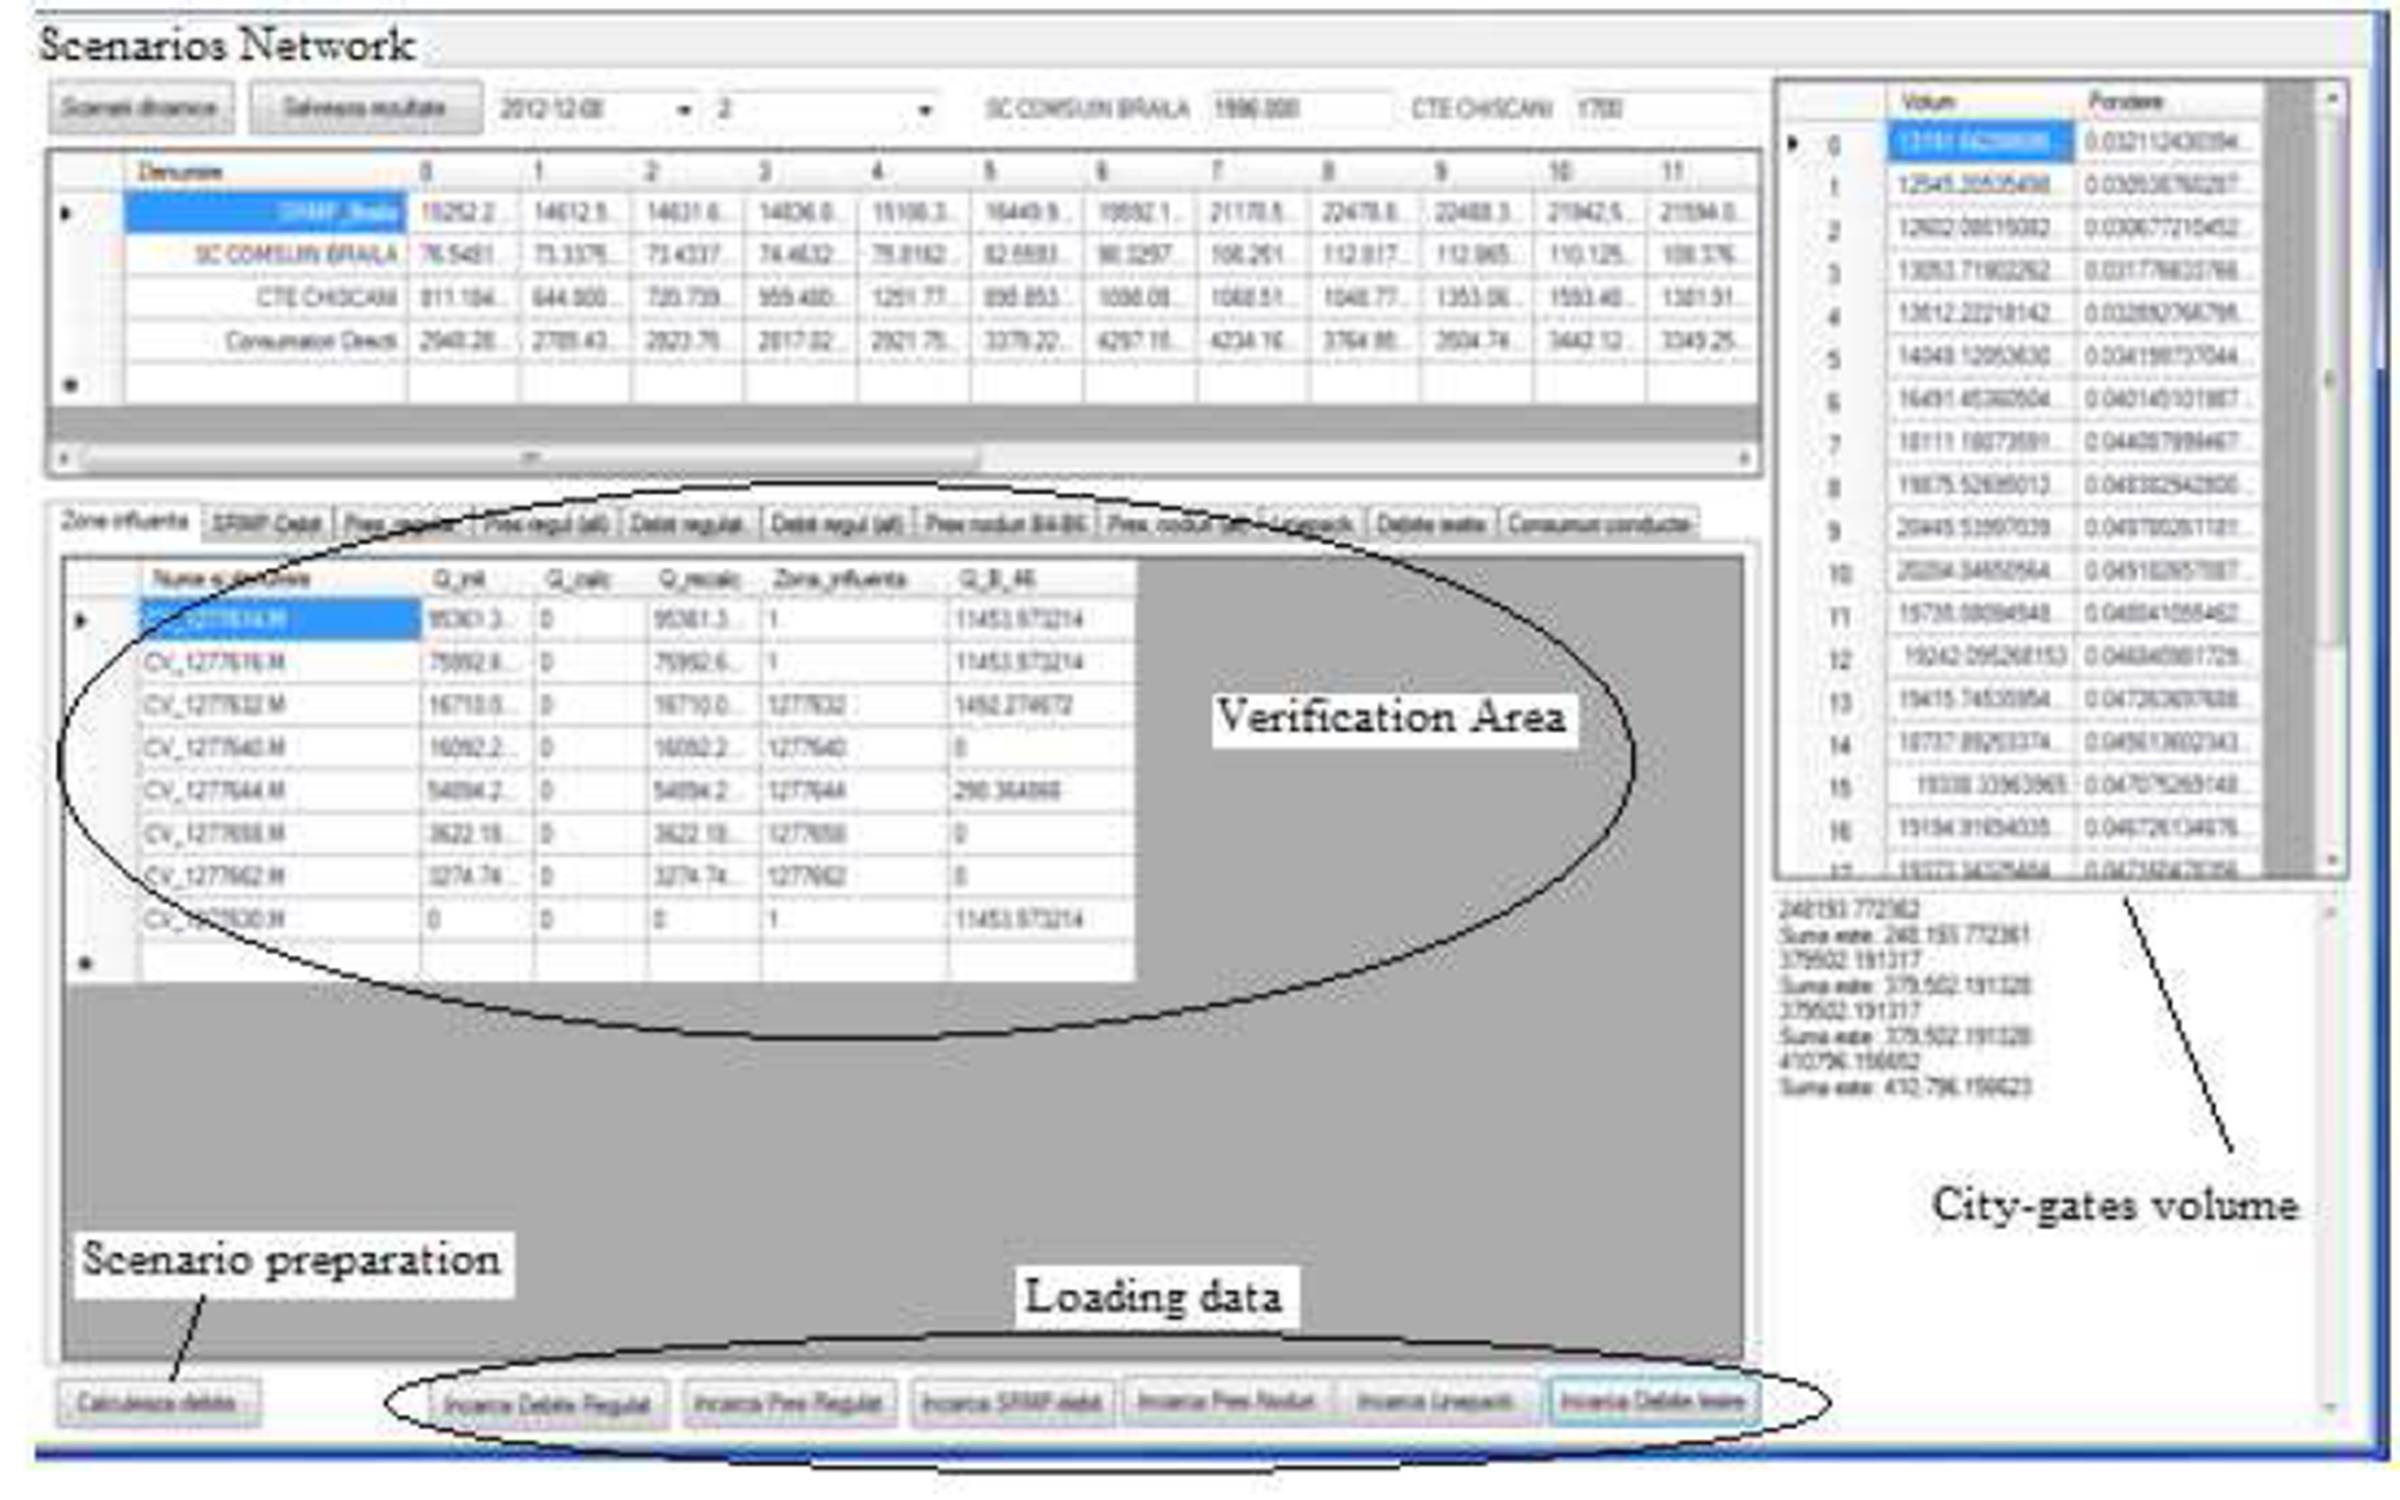
where area is supplied by the point (city-gate or SRS — sector regulation station) for which the calculation is made. Figure 2 presents a screen capture from a programme that calculates the ratios of the clients and the values of the volumes that are consumed per day, on the basis of the daily volume reading at the city-gate.
Figure 2: Calculation of the B1…B3 clients’ coefficients and daily-consumed volumes.
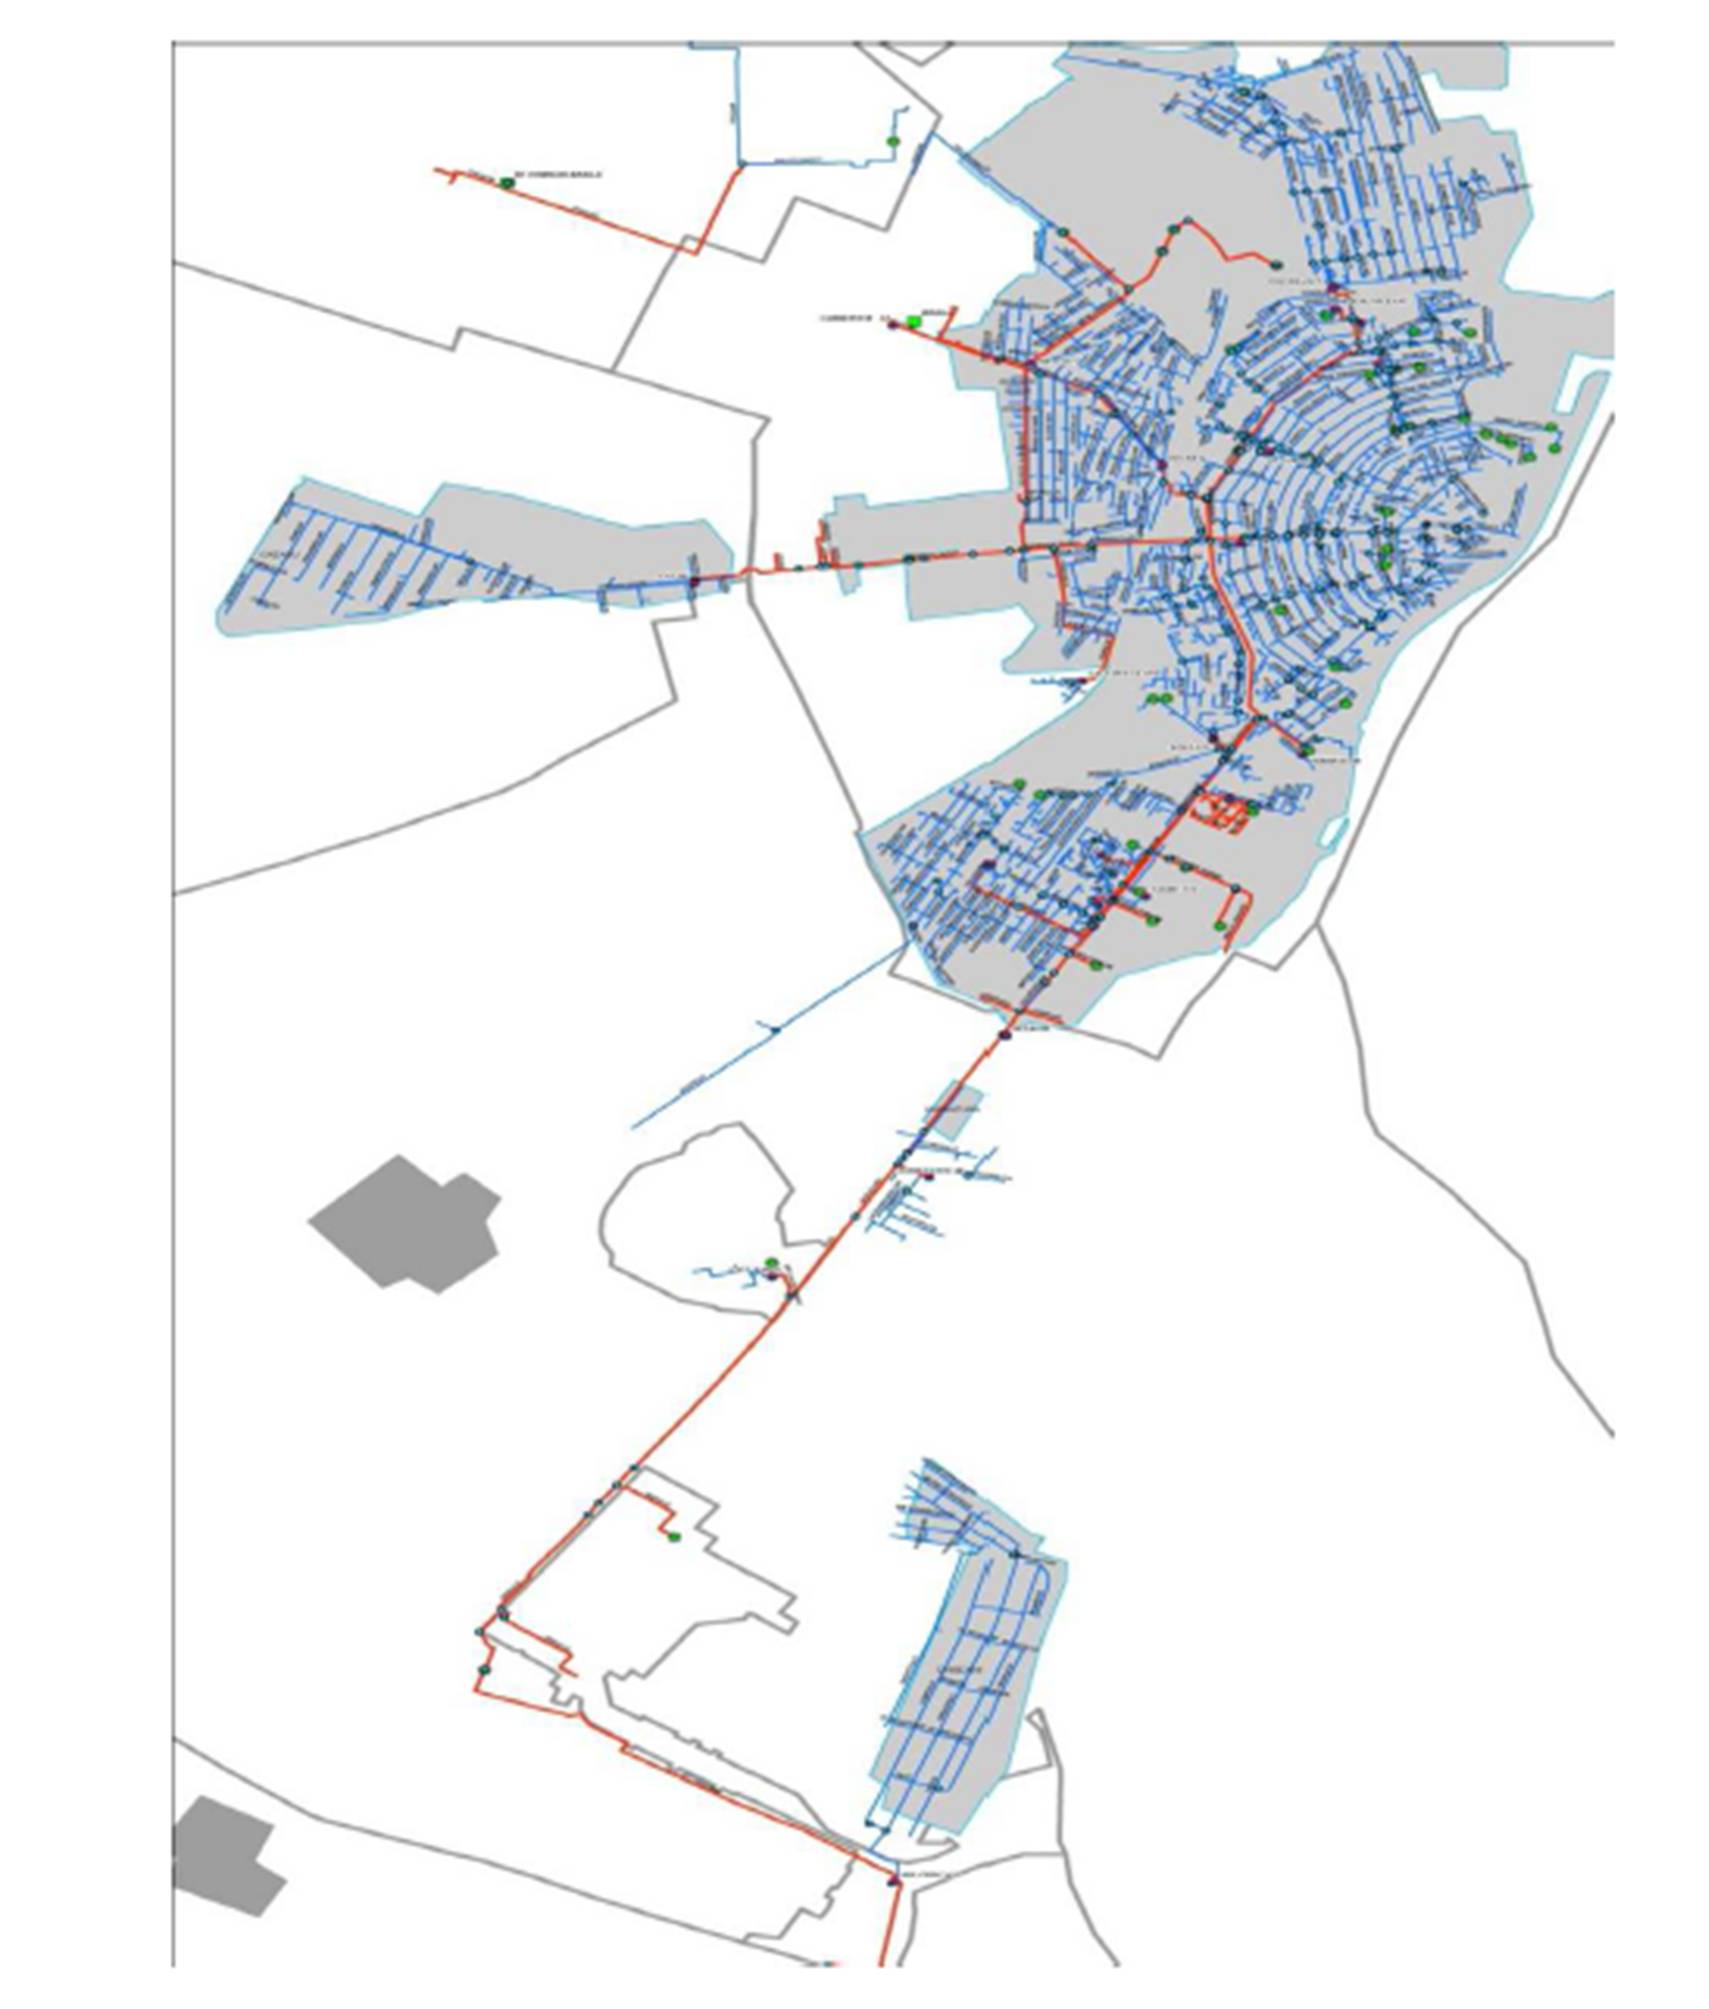
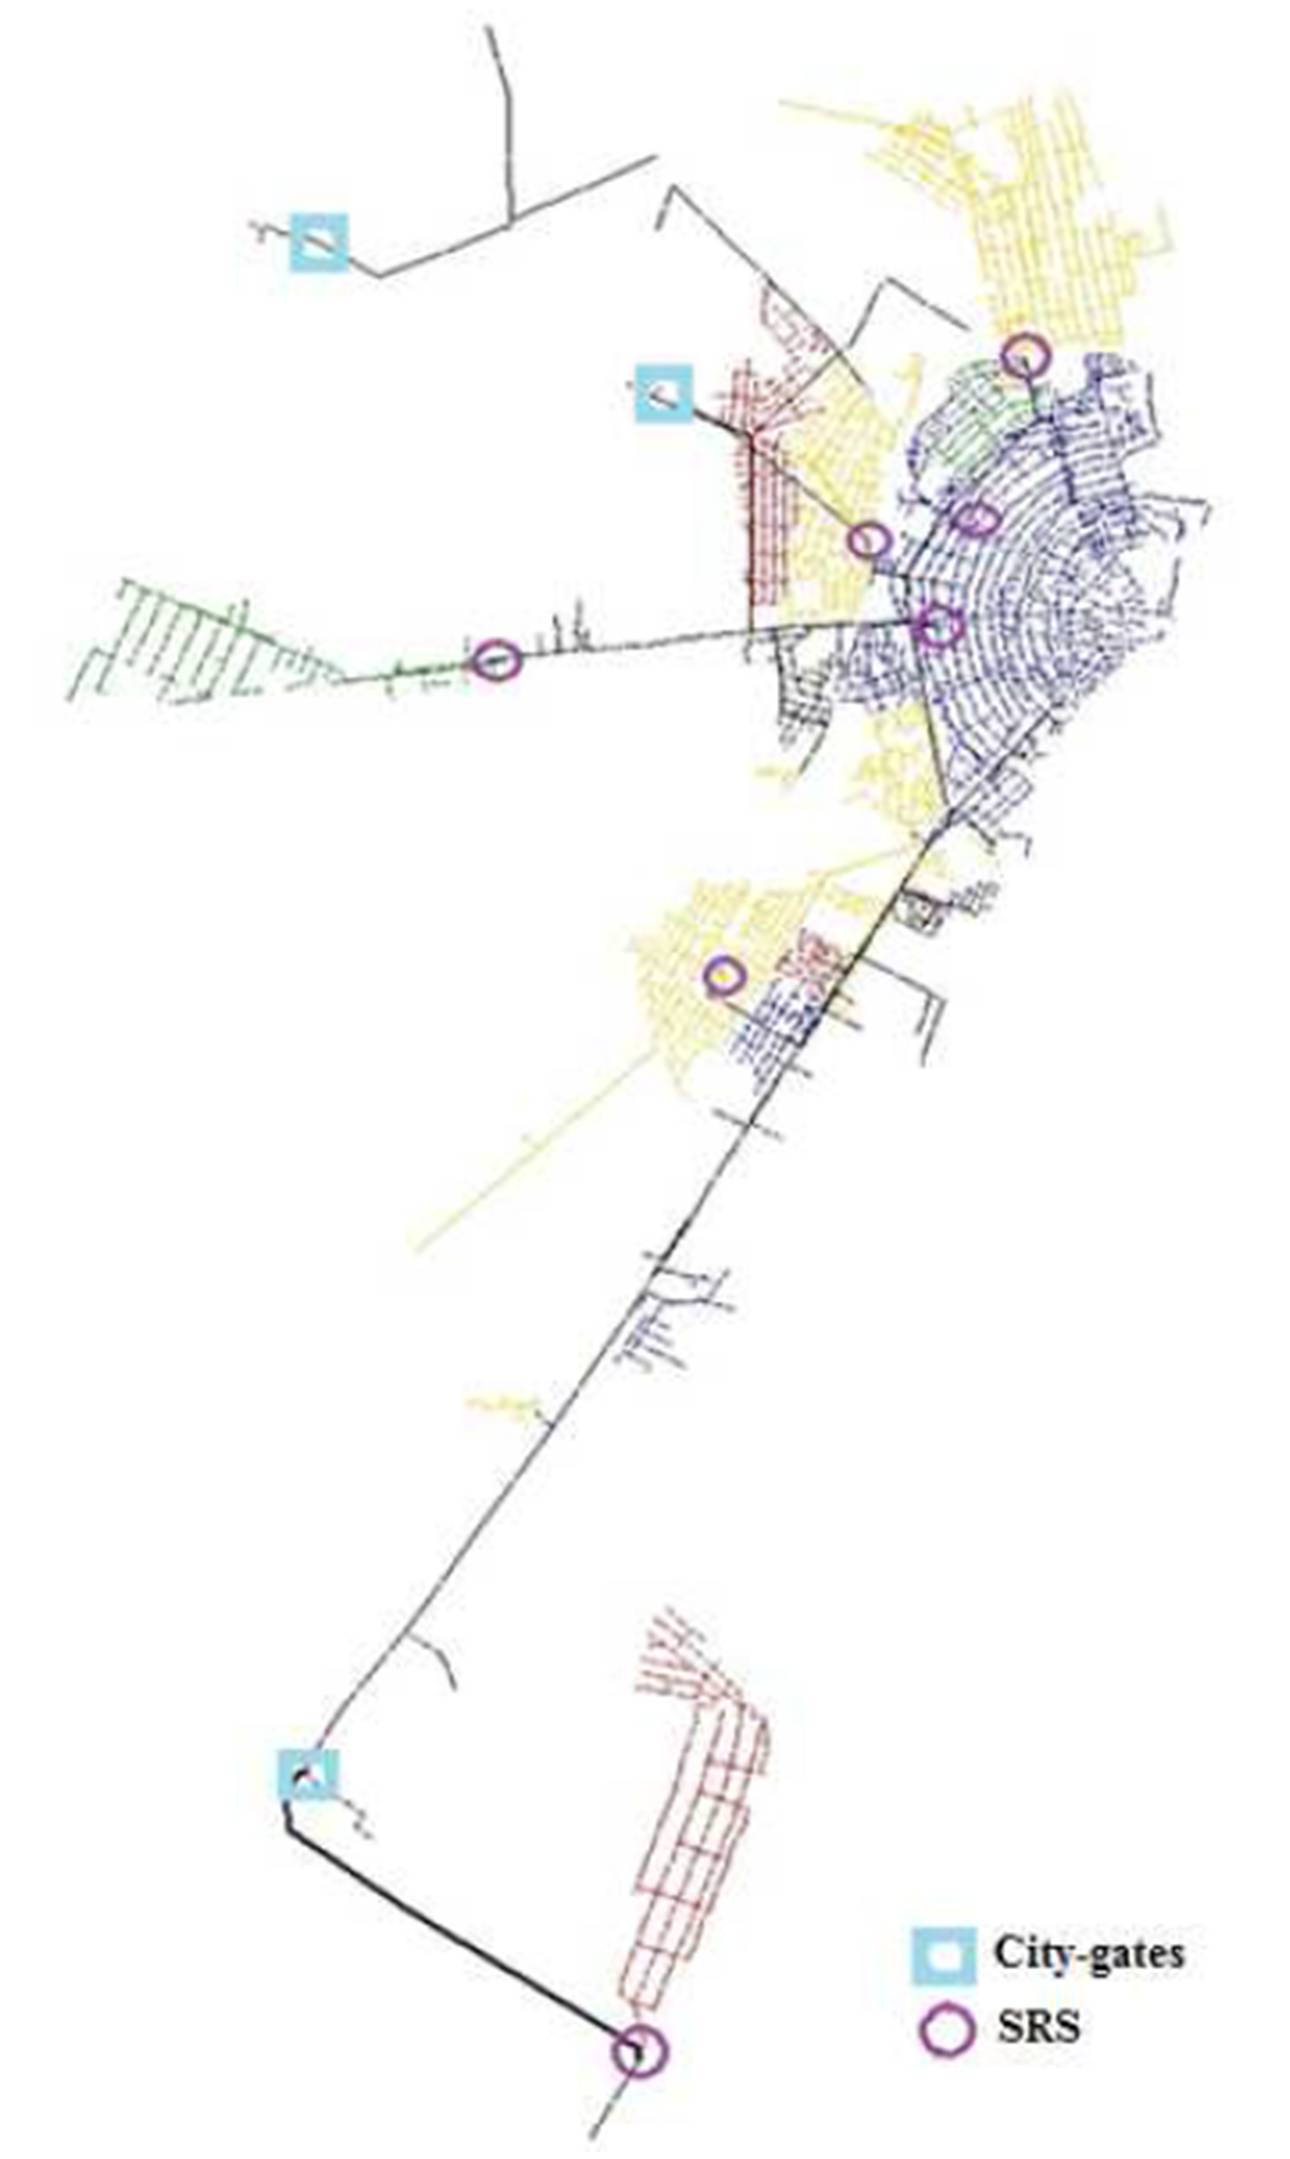
According to the model used in the simulation, clients are street- allocated, so that the gas flow on a certain street is the summation of the flows consumed by the clients residing on that street. In figure 3, the surveyed network is detailed, namely the monitored city-gates and SRS-s. Pipelines are marked with different colours, so that the area supplied by a certain SRS may be better visualised.
The balance calculation is repeatedly done, by modifying the flows of the clients within the SRS-s areas of influence, until the values of the calculated flows become equal to the readings. In that moment, calculation is stopped, henceforth the flows result for each street in the network and for each B1…B3 client.
After simulation, the quantity of gas which exists in the network can be obtained for each time range (daily or hourly). Closing per client may be done only after the three-monthly reading, by redistributing the possible difference of gas volume on the days of the interval between the readings.
Figure 3: Monitored SRS-s and city-gates network
Data Organisation and Processing
For a better organisation of the data deriving from different sources, a database was created. This database enables its users: to determine the volume of gas from the pipelines of the distribution system (Nmc/day), to physically balance the distribution networks every 24 hours by using a simulator, to monitor and to highlight natural gas losses and abnormal consumption from the distribution system, to identify hourly consumption profiles and to calibrate them, based on hourly data that are available for the chosen distribution system and on the data collected from the analyzed distribution system (Figure 4).
The following information provided by the beneficiary was introduced in the database:
– Operating parameters of the chosen distribution system;
– Daily (read) consumption of the B4-B6 categories consumers and the history of daily consumption per gas year;
– Values of the natural gas quantity delivered from the national transport system into the chosen distribution system, through city-gates;
– Estimated consumption data for profitable consumers from B1-B3 categories;
– Consumption history per gas year for B1-B3 categories profitable consumers;
– The distribution of profitable consumers on streets;
– The history of daily inputs through city-gates per gas year;
– Daily average temperatures recorded in a gas year.
The database also includes the information on the consumption profiles of the clients and the simulation results.
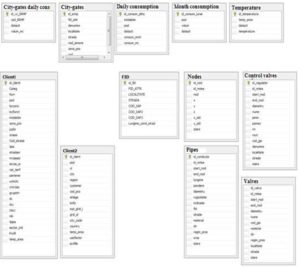
Figure 4: Database diagram
The Consumption Profile of the Area
As shown by Neacșu et al., (2011), consumption profiles are functions on which gas consumptions per certain periods of time may be forecast. Taking into account the fact that, for the distribution network from Brăila, B4…B6 categories consumers are read on a daily basis and that the consumption behaviour of the B1..B3 consumers is influenced by temperature, we consider that there may be used only one consumption profile, henceforth named zonal profile set on daily gas values delivered through city-gates. In the future, as further data are gathered, the daily consumption data of B1…B3 clients to create the regional profile may be used.
For every client within the area for which the profile has been defined, the zonal profiling function corrected with PNDC may be used, i.e. the weighting coefficient of the consumer.
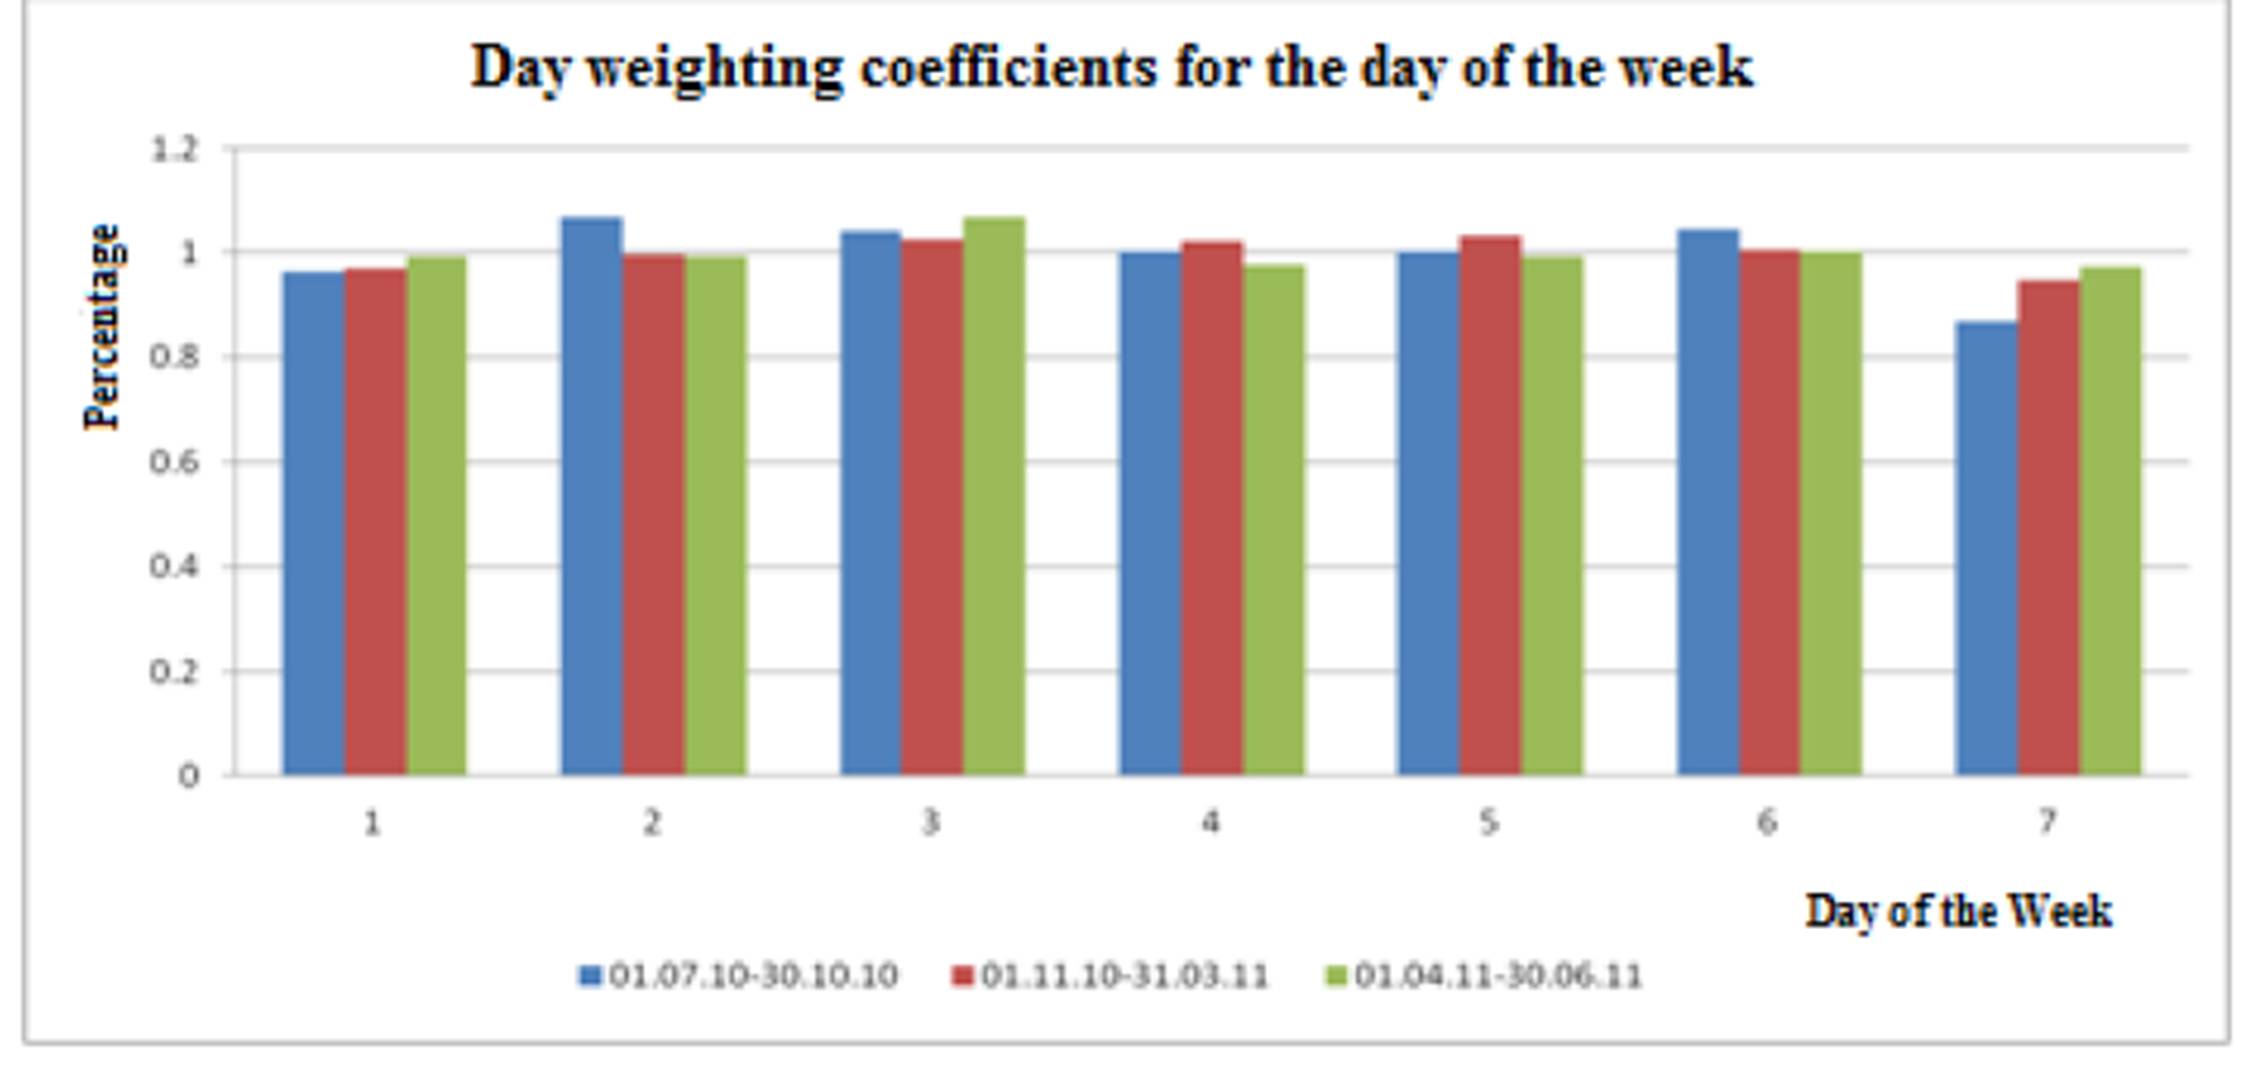
Further on, we present the way in which the zone profile is designed and operated with. Figure 7 represents the consumption per a gas year within the SRS influence area. The consumption is dependent on temperature. In figure 5, the day weighting coefficients for 3 time intervals are presented.
Figure 5: Day weighting coefficients for the day of the week
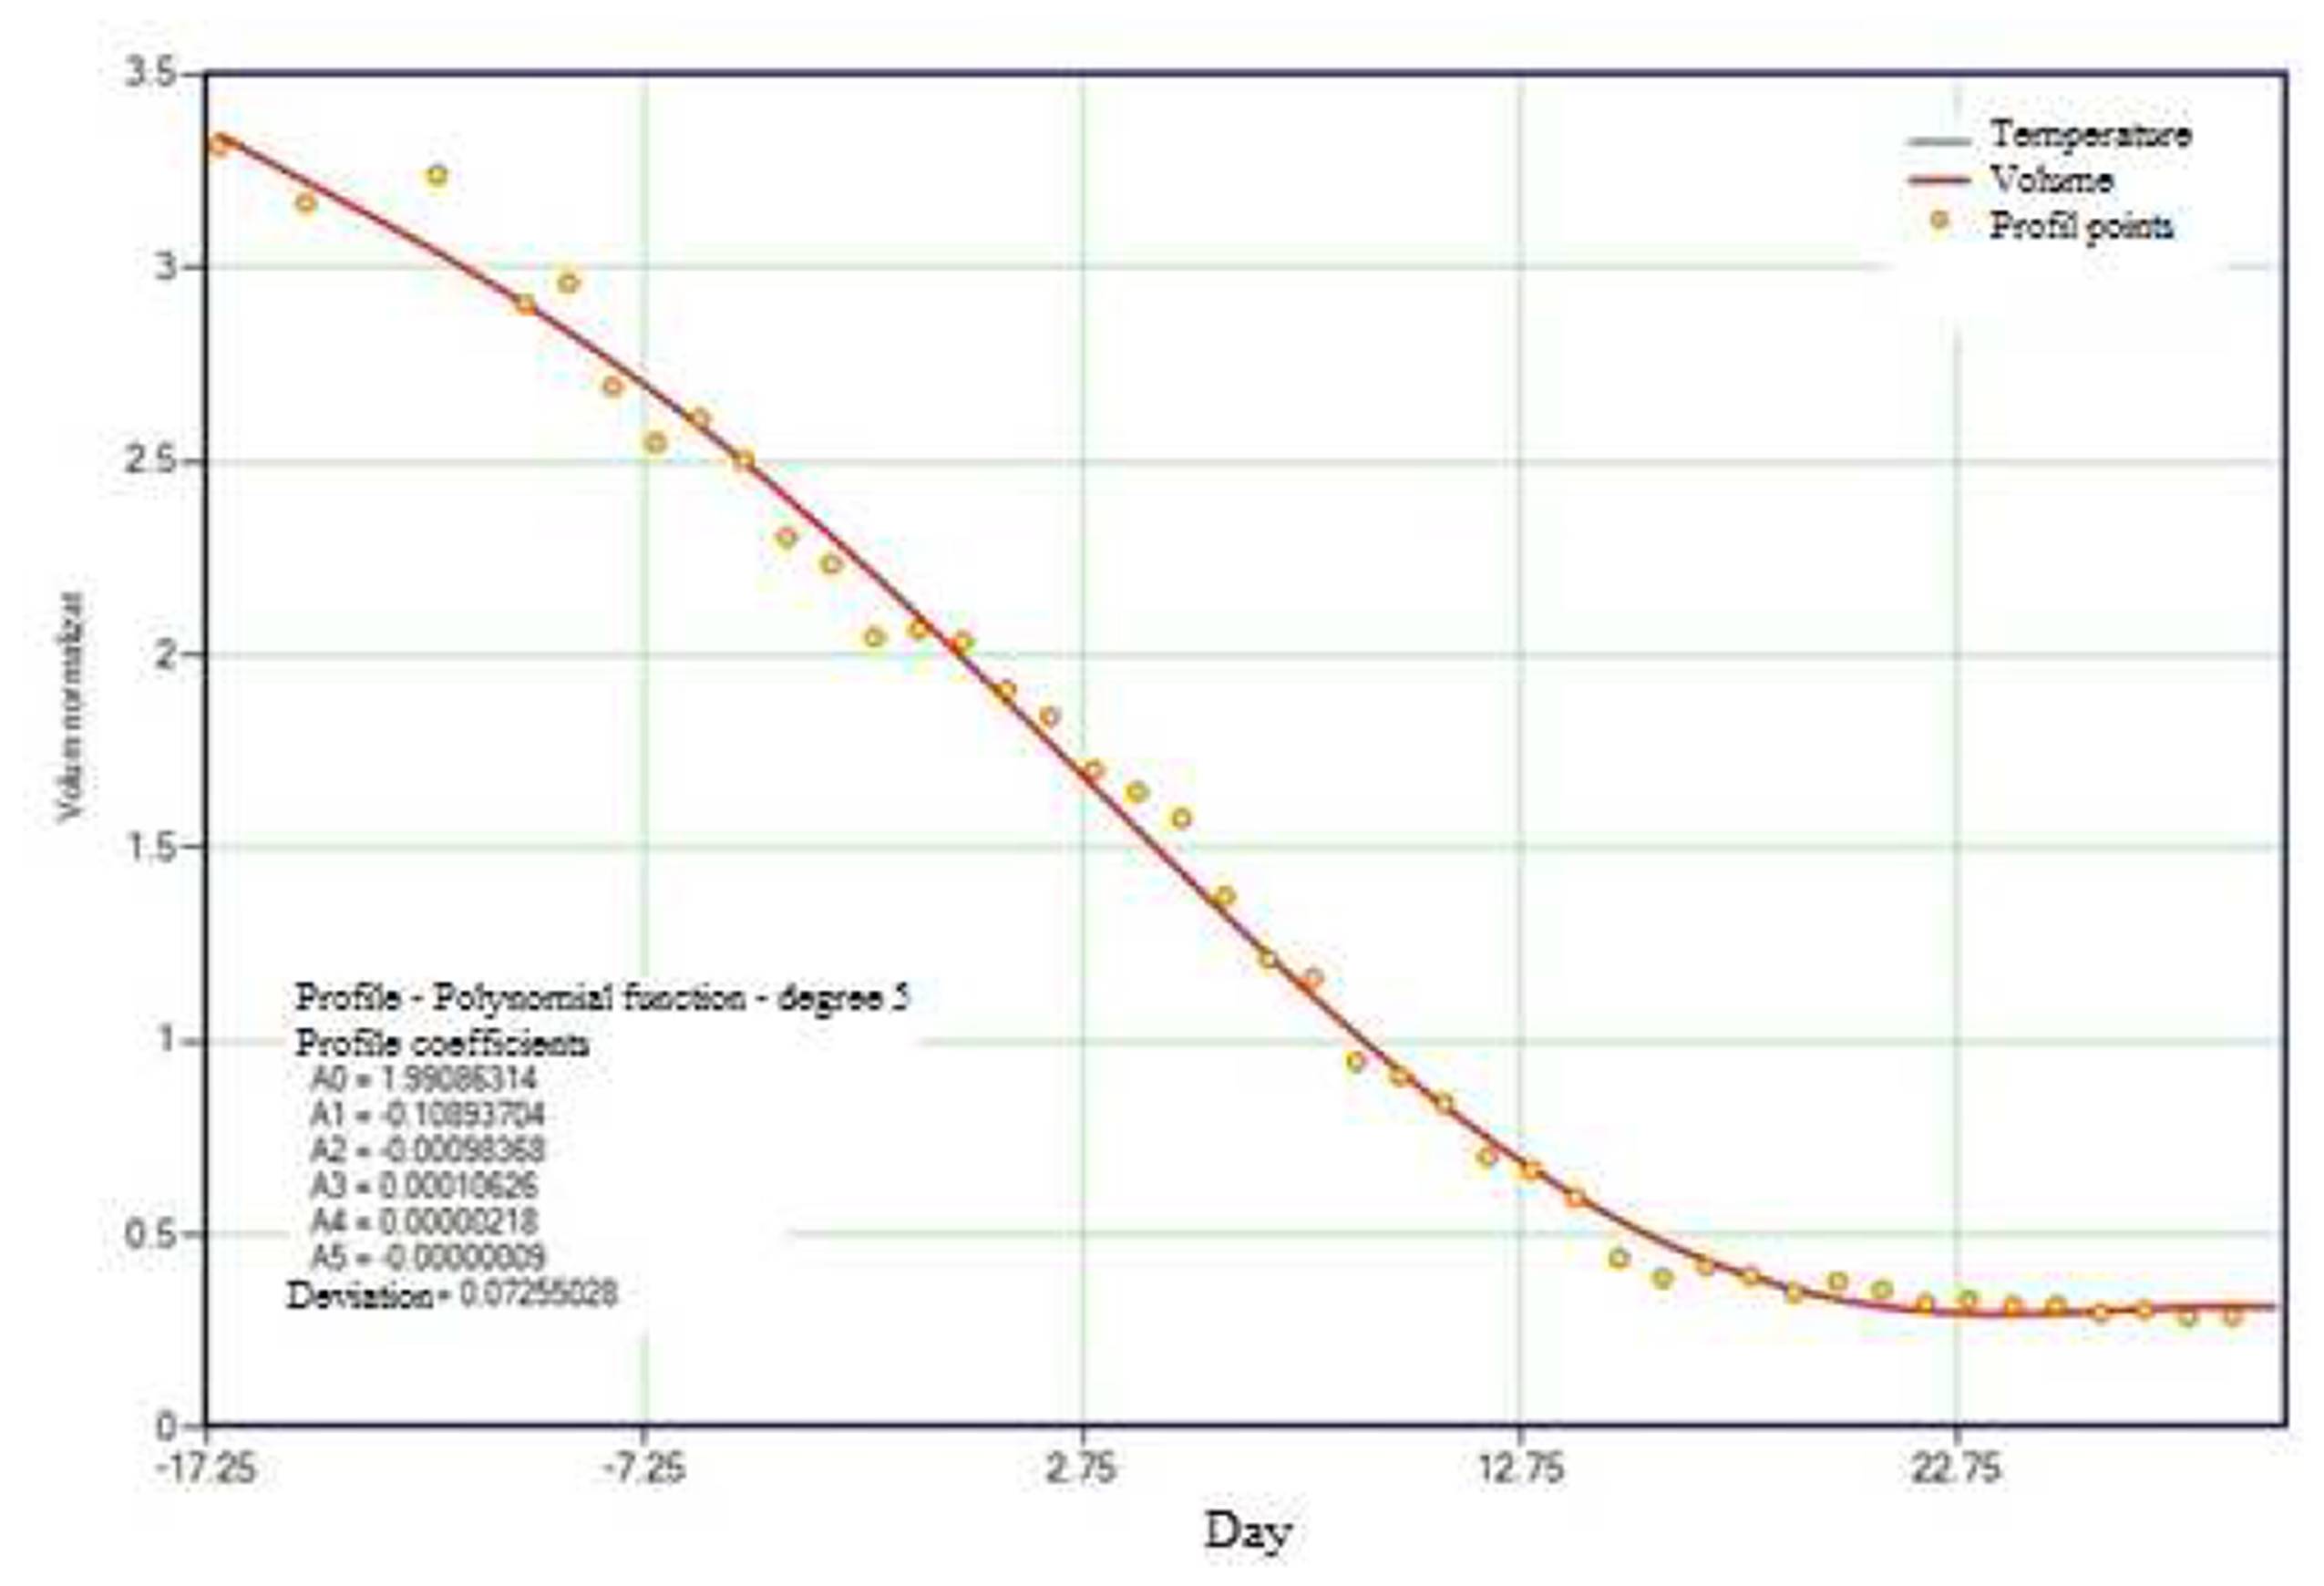
The consumption values, calibrated and sorted depending on temperature, make possible the defining of the profiling function, as shown in figure 6.
Figure 6: The defining of the profiling function
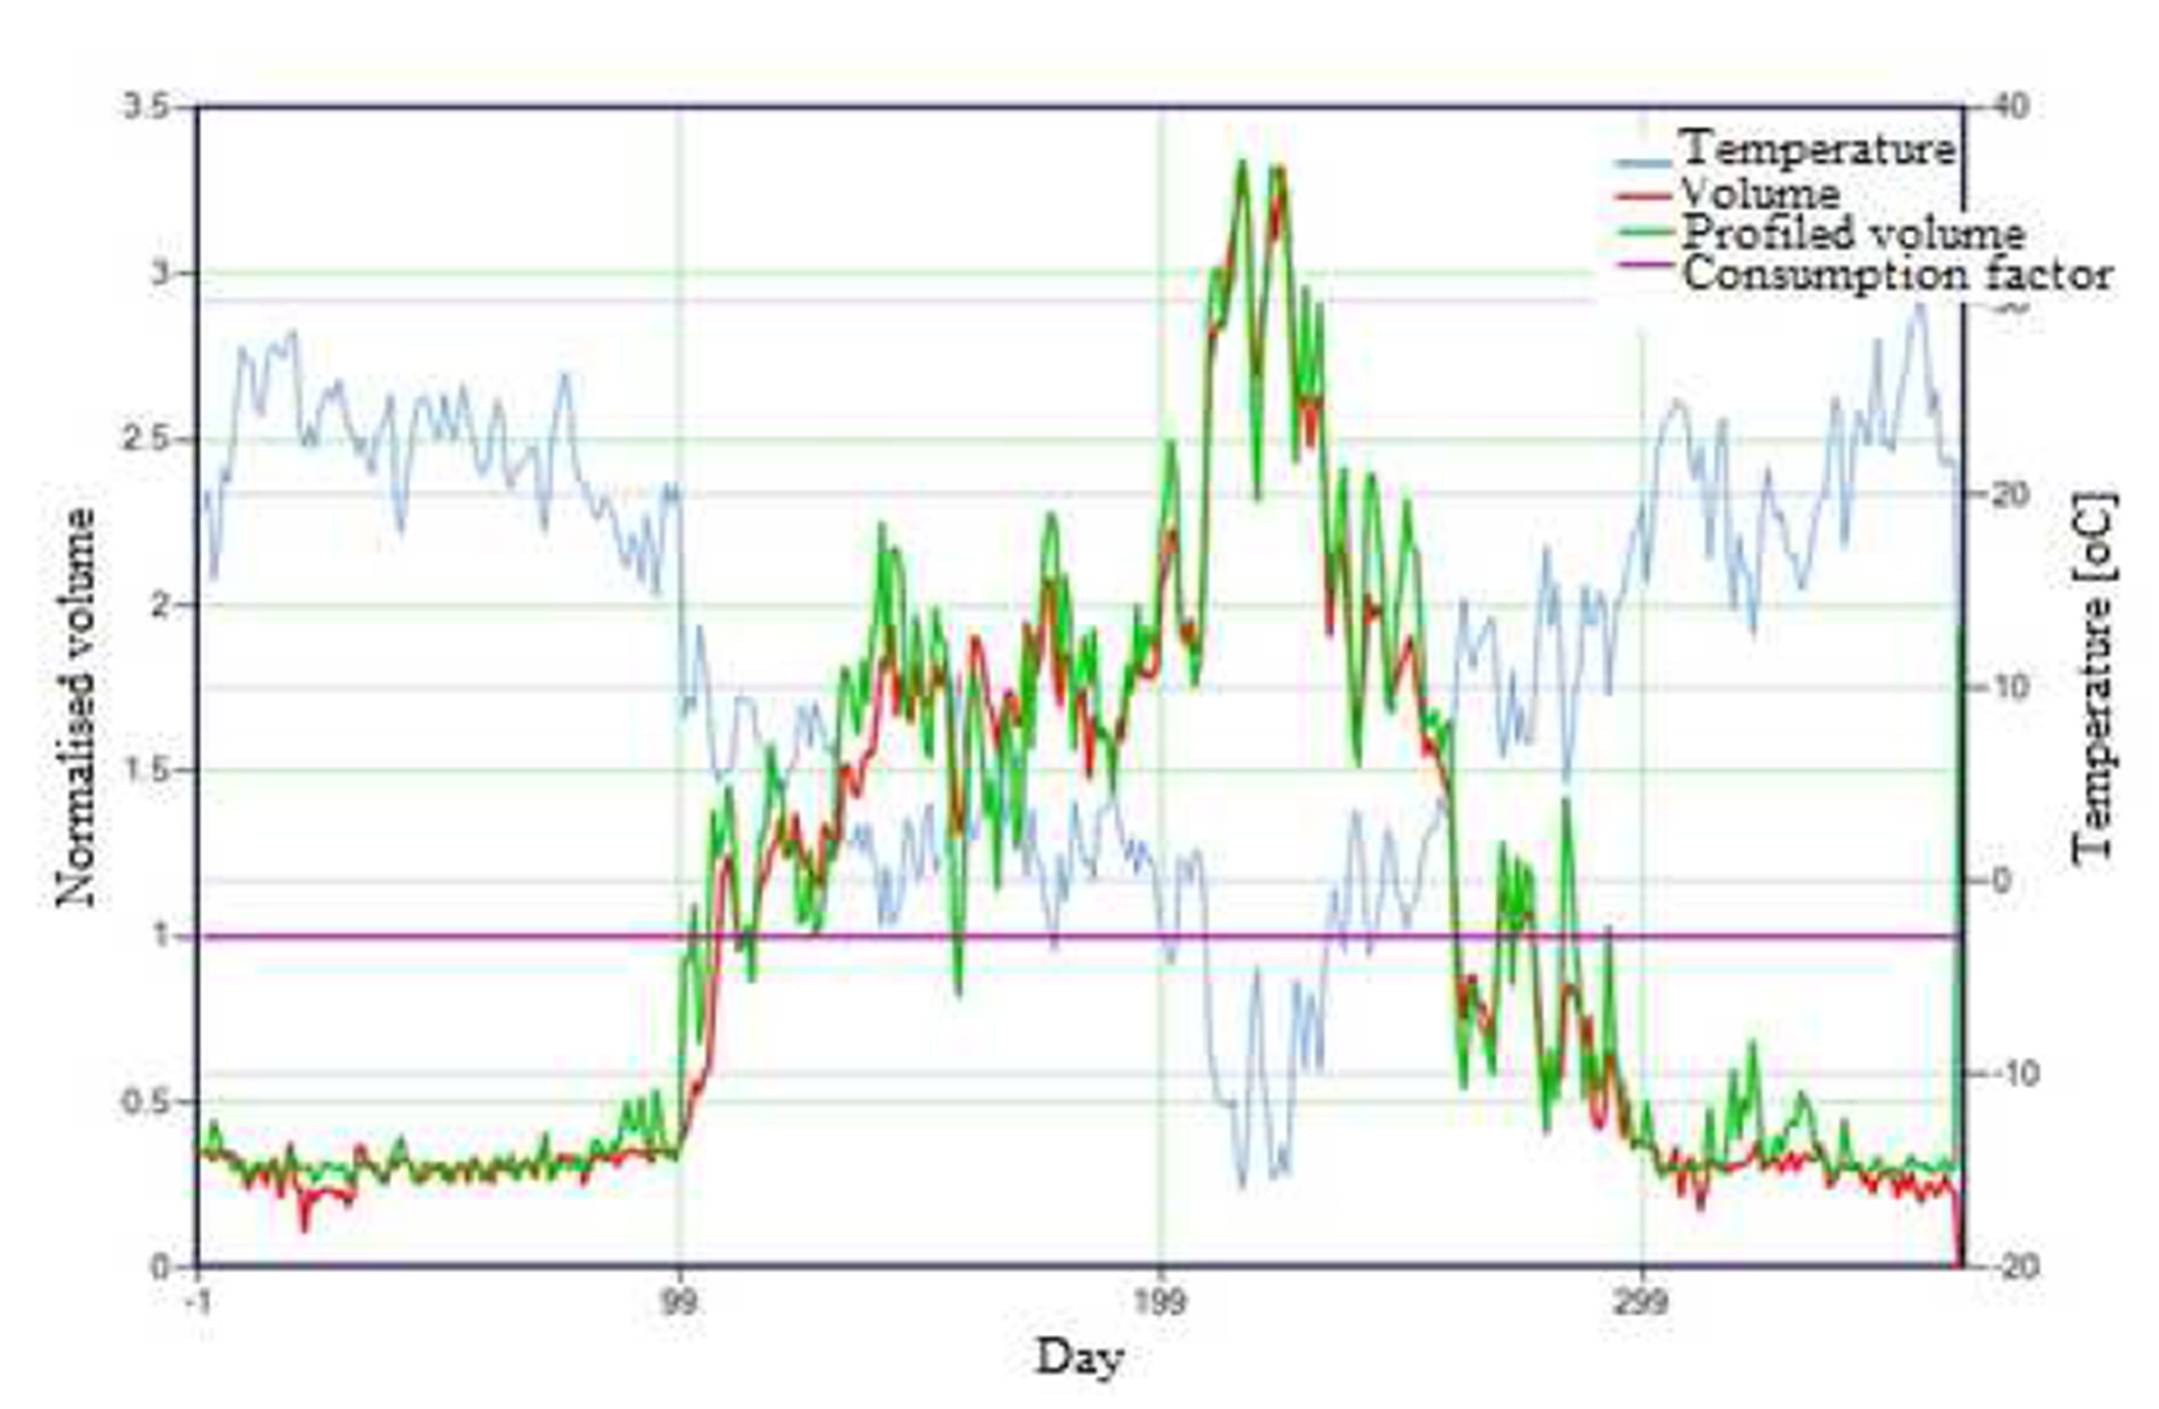
Eparu et al., (2011) emphasized that daily values may be determined by using the zone profile, the zone consumption factor represented by the average value of the daily consumption per gas year and the correction coefficients, in this case, the day of the week weighting coefficients. The profiled volume and the real volume have been compared, as presented in figure 7.
The consumption factor is usually derived from history (the previous gas year) and it is considered constant throughout the prognosis interval, namely one gas year.
When analyzing the graph, one remarks notable differences between the profiled and the realized volumes. In order to minimize these differences, a variable consumption factor will be used for the prognosis. In this case, the difference between the estimated values and the real ones falls below 1%.
Figure 7: Graph representing the profiled volume and the real volume
Gas Loss
For a maximum accuracy of the calculation, the technological escape from the grid must be considered. The most significant are caused by: the flaws resulted from the inappropriate correction of the gas volume that is delivered to some small consumers owning gas meters without regulator, as shown by Albulescu et al., (2008), and Neacșu et al., (2008), the replacement or commissioning of the distribution network, the permeability of the material, while Eparu et al., (2011) highlighted the inappropriate regulation of the pressure in the regulation stations, the sensitivity of gas meters, escapes as a result of maintenance activities etc.
Technological losses depend on several factors such as: pipeline locations (above ground or buried), material (cast iron, steel and polyethylene), and type of flaw (weld pores, corrosion, and non-tightness). As the monitoring of all the above-mentioned aspects may prove difficult, there is a methodology to calculate all types of technological losses, presented in ANRE (2013). These are calculated once a year. In Romania, technological losses represent approximately 3 % from the total of distributed gas.
Test Procedure
Daily flows were converted into hourly flows and, in cases where hourly information was available, this was used in simulation.
In order to generate a scenario, one needs information on the inputs (pressure and flows at the city gates), on the outputs of the network (estimated consumptions for B1-B3 consumers and measured values for B4-B6 consumers), on possible restrictions (turned-off valves and regulation activities within SRS-s), and on the parameters from the established control points.
Once the total consumption of the clients residing on a certain street has been established, this is distributed to the afferent pipelines, considering their length. After estimating the consumption per each pipeline, this is further delivered to one of the pipeline’s points.
To these types of consumption, one adds the gas delivered to B4-B6 categories consumers, in certain nodes of the network. In order to create accurate scenarios, the location of the valves throughout the system was put at our disposal.
Simulation provides a series of results, which, in order to be accurate, should coincide with the values from the control points. In case the values from the control points are not similar, the initial estimated consumption for B1-B3 consumers should be modified and simulations rerun until the values obtained during simulation and the real values from the control points become similar. We designed specialized software (see Figure 8) that allows the above-mentioned procedure. Once the results obtained by the simulator have been introduced, the soft checks the differences registered at the control points, calculates the new coefficients for each consumption area, and simulation scenarios are regenerated based on the new consumption values. These scenarios are further introduced in the simulator and, after approximately 3 reiterations, accurate consumption values are obtained.
Figure 8: Soft designed for redistribution and automated scenarios generation
At that point, data resulted during simulation may be stored in the database, which further on supports the determination of the volume of gas in the pipeline, the physical balancing of the network every 24 hours, the monitoring and highlighting of gas escapes or abnormal consumptions throughout the distribution system.
Presentation of the Results
The results of the simulations for each gas day are stored in the database. In order to visualize the data on which scenarios were generated and the results of the simulations, the beneficiary is given the access, via internet, to an interface that allows the selective display of the results.
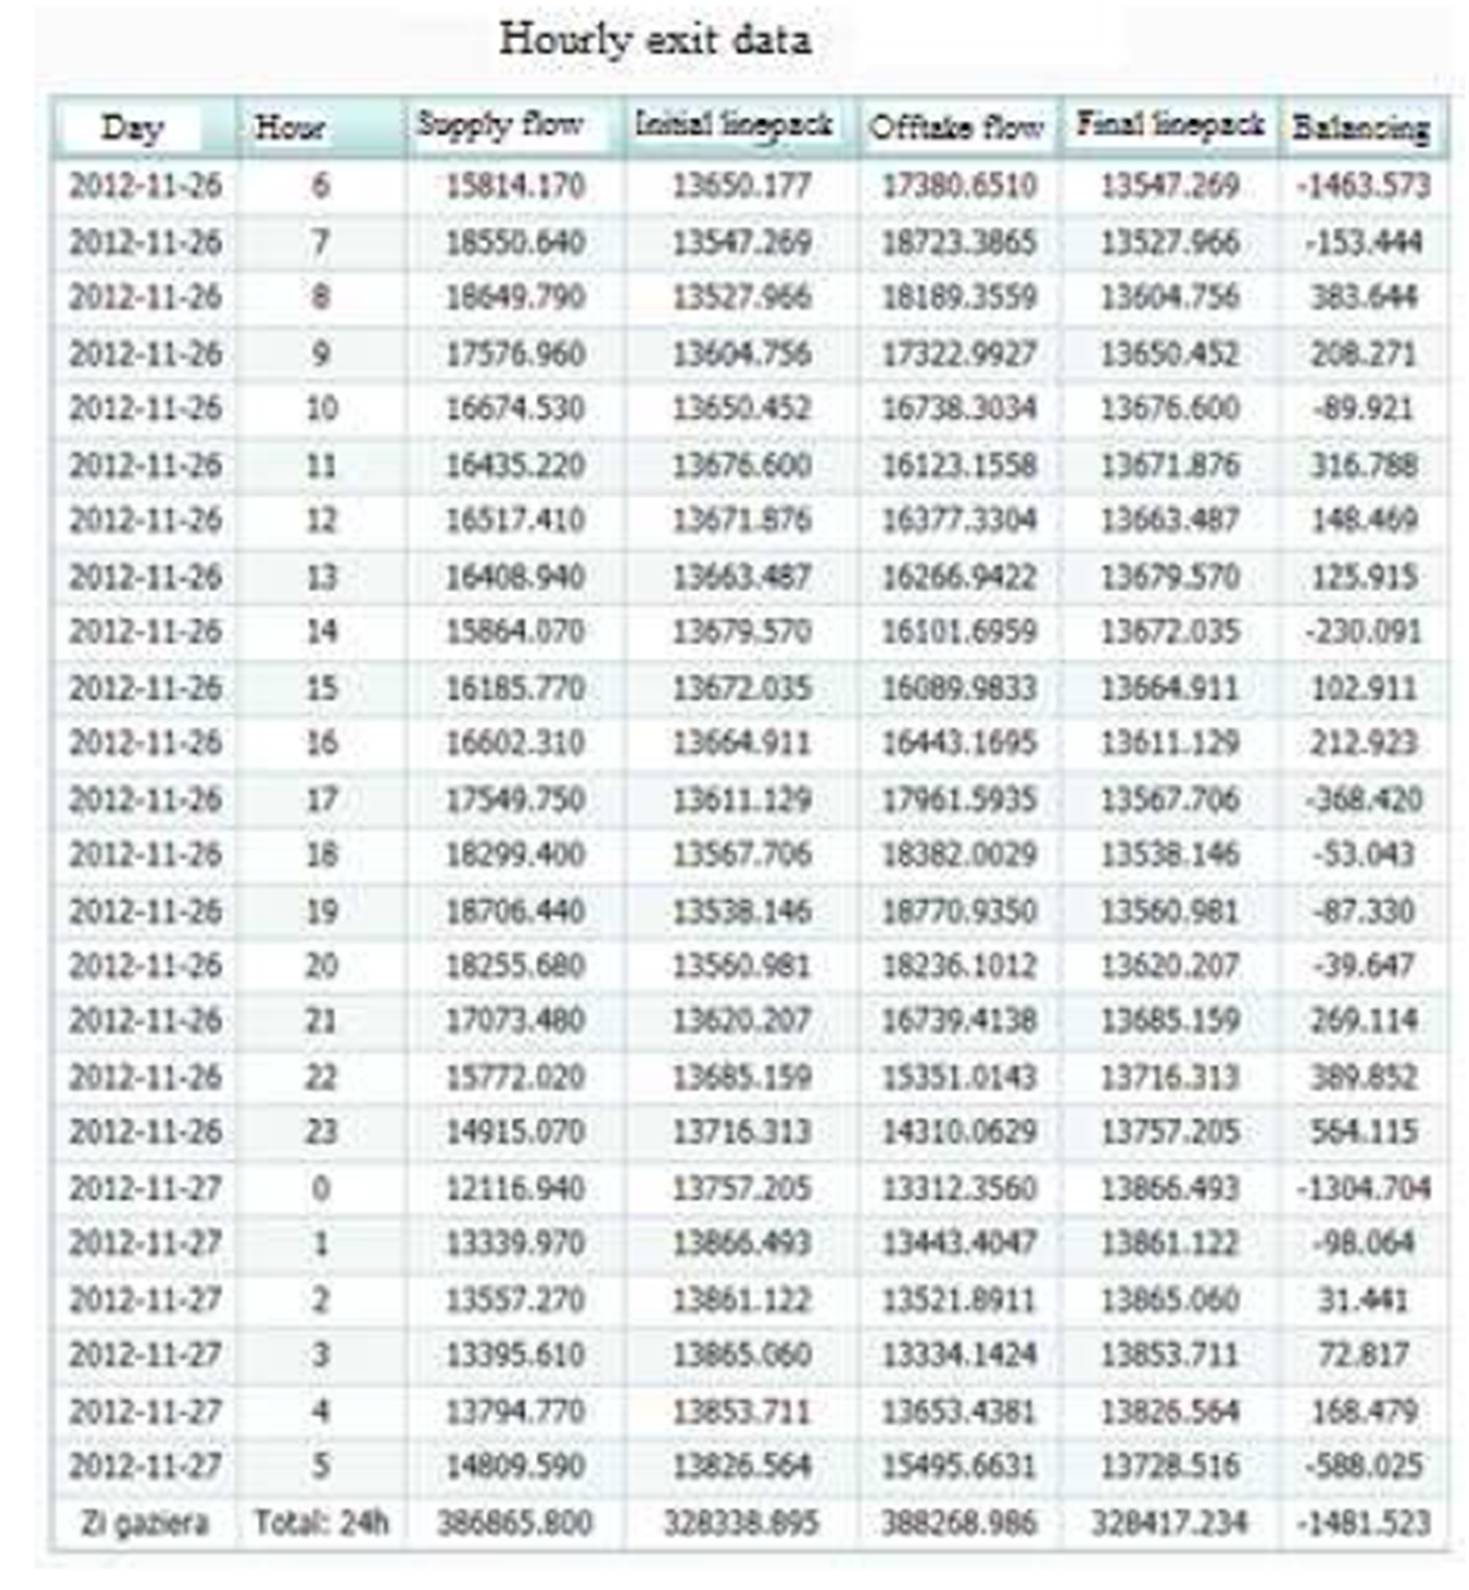
The table in Figure 9 presents the physical balance calculation for a gas day, based on hourly balances. One may notice that the input volume of gas was, in that day, 1481,523 Nm3 lower than the consumed gas.
Figure 9: Hourly balancing
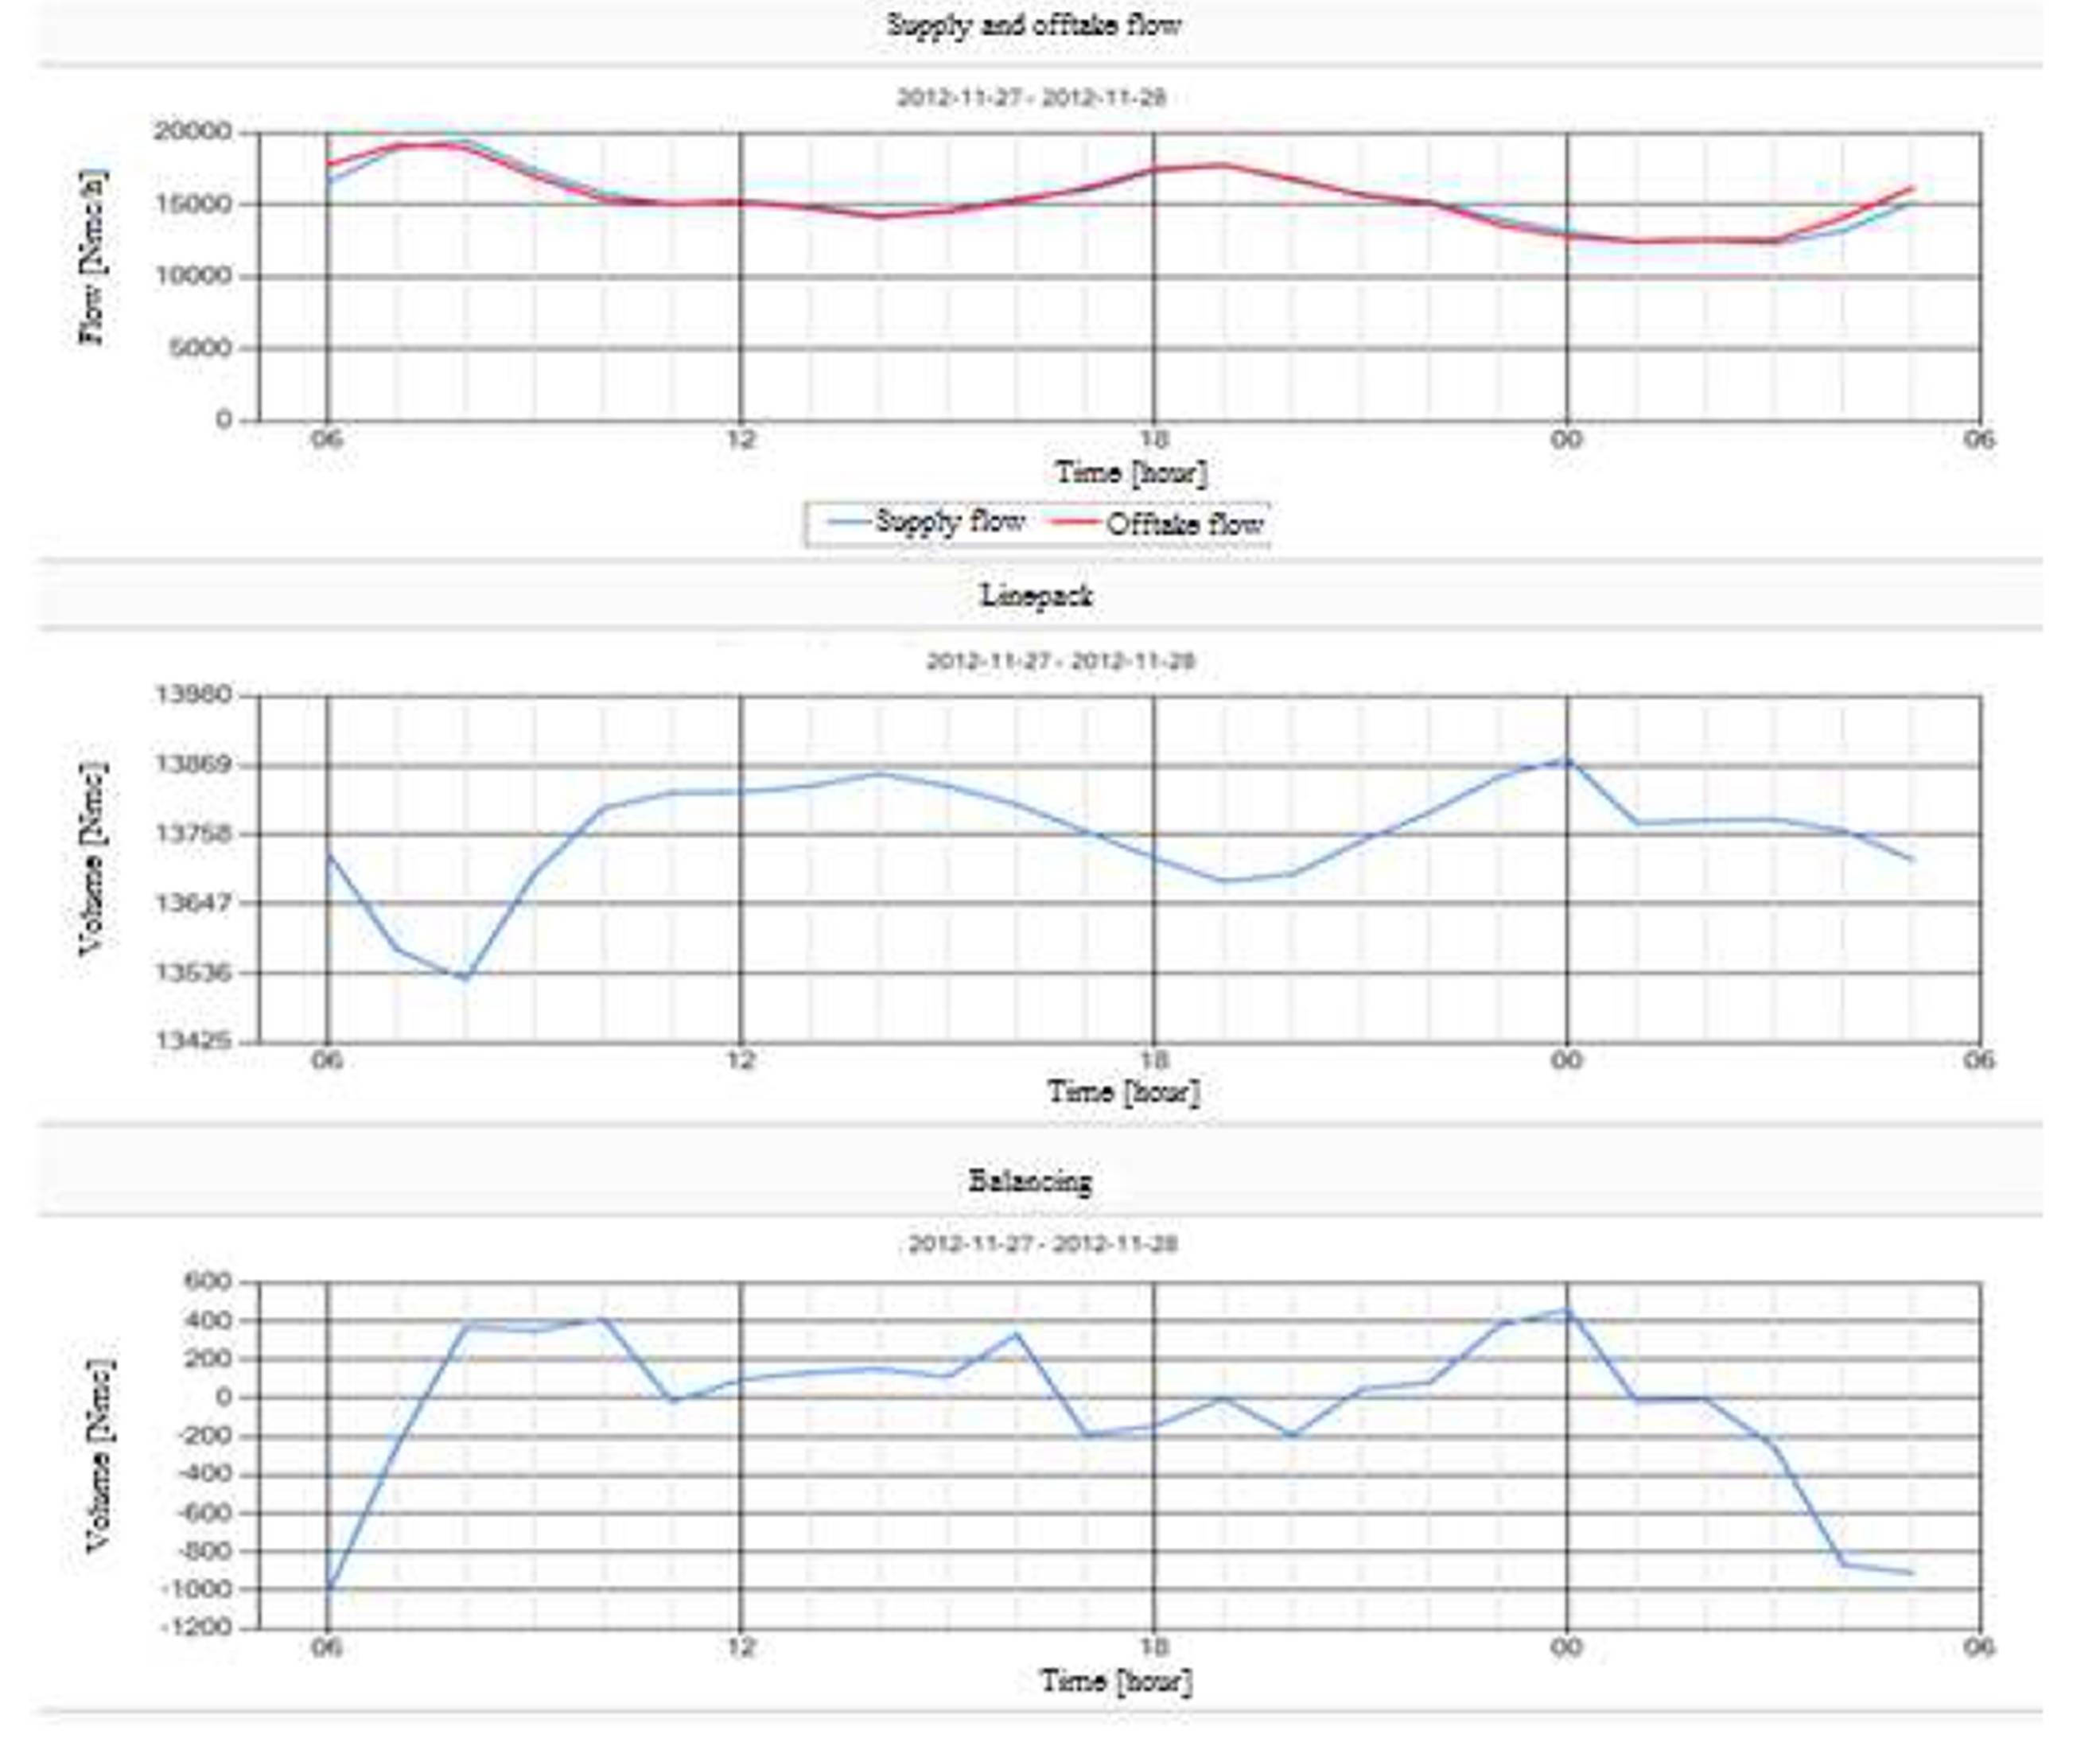
This is further illustrated in Figure 10, where the following elements are graphically marked: the hourly variation of the gas flows (top), the quantity of gas in the distribution network (middle), and hourly balancing (bottom).
Figure 10: Daily variations of the input/ output flow, of the line-pack and of the balancing
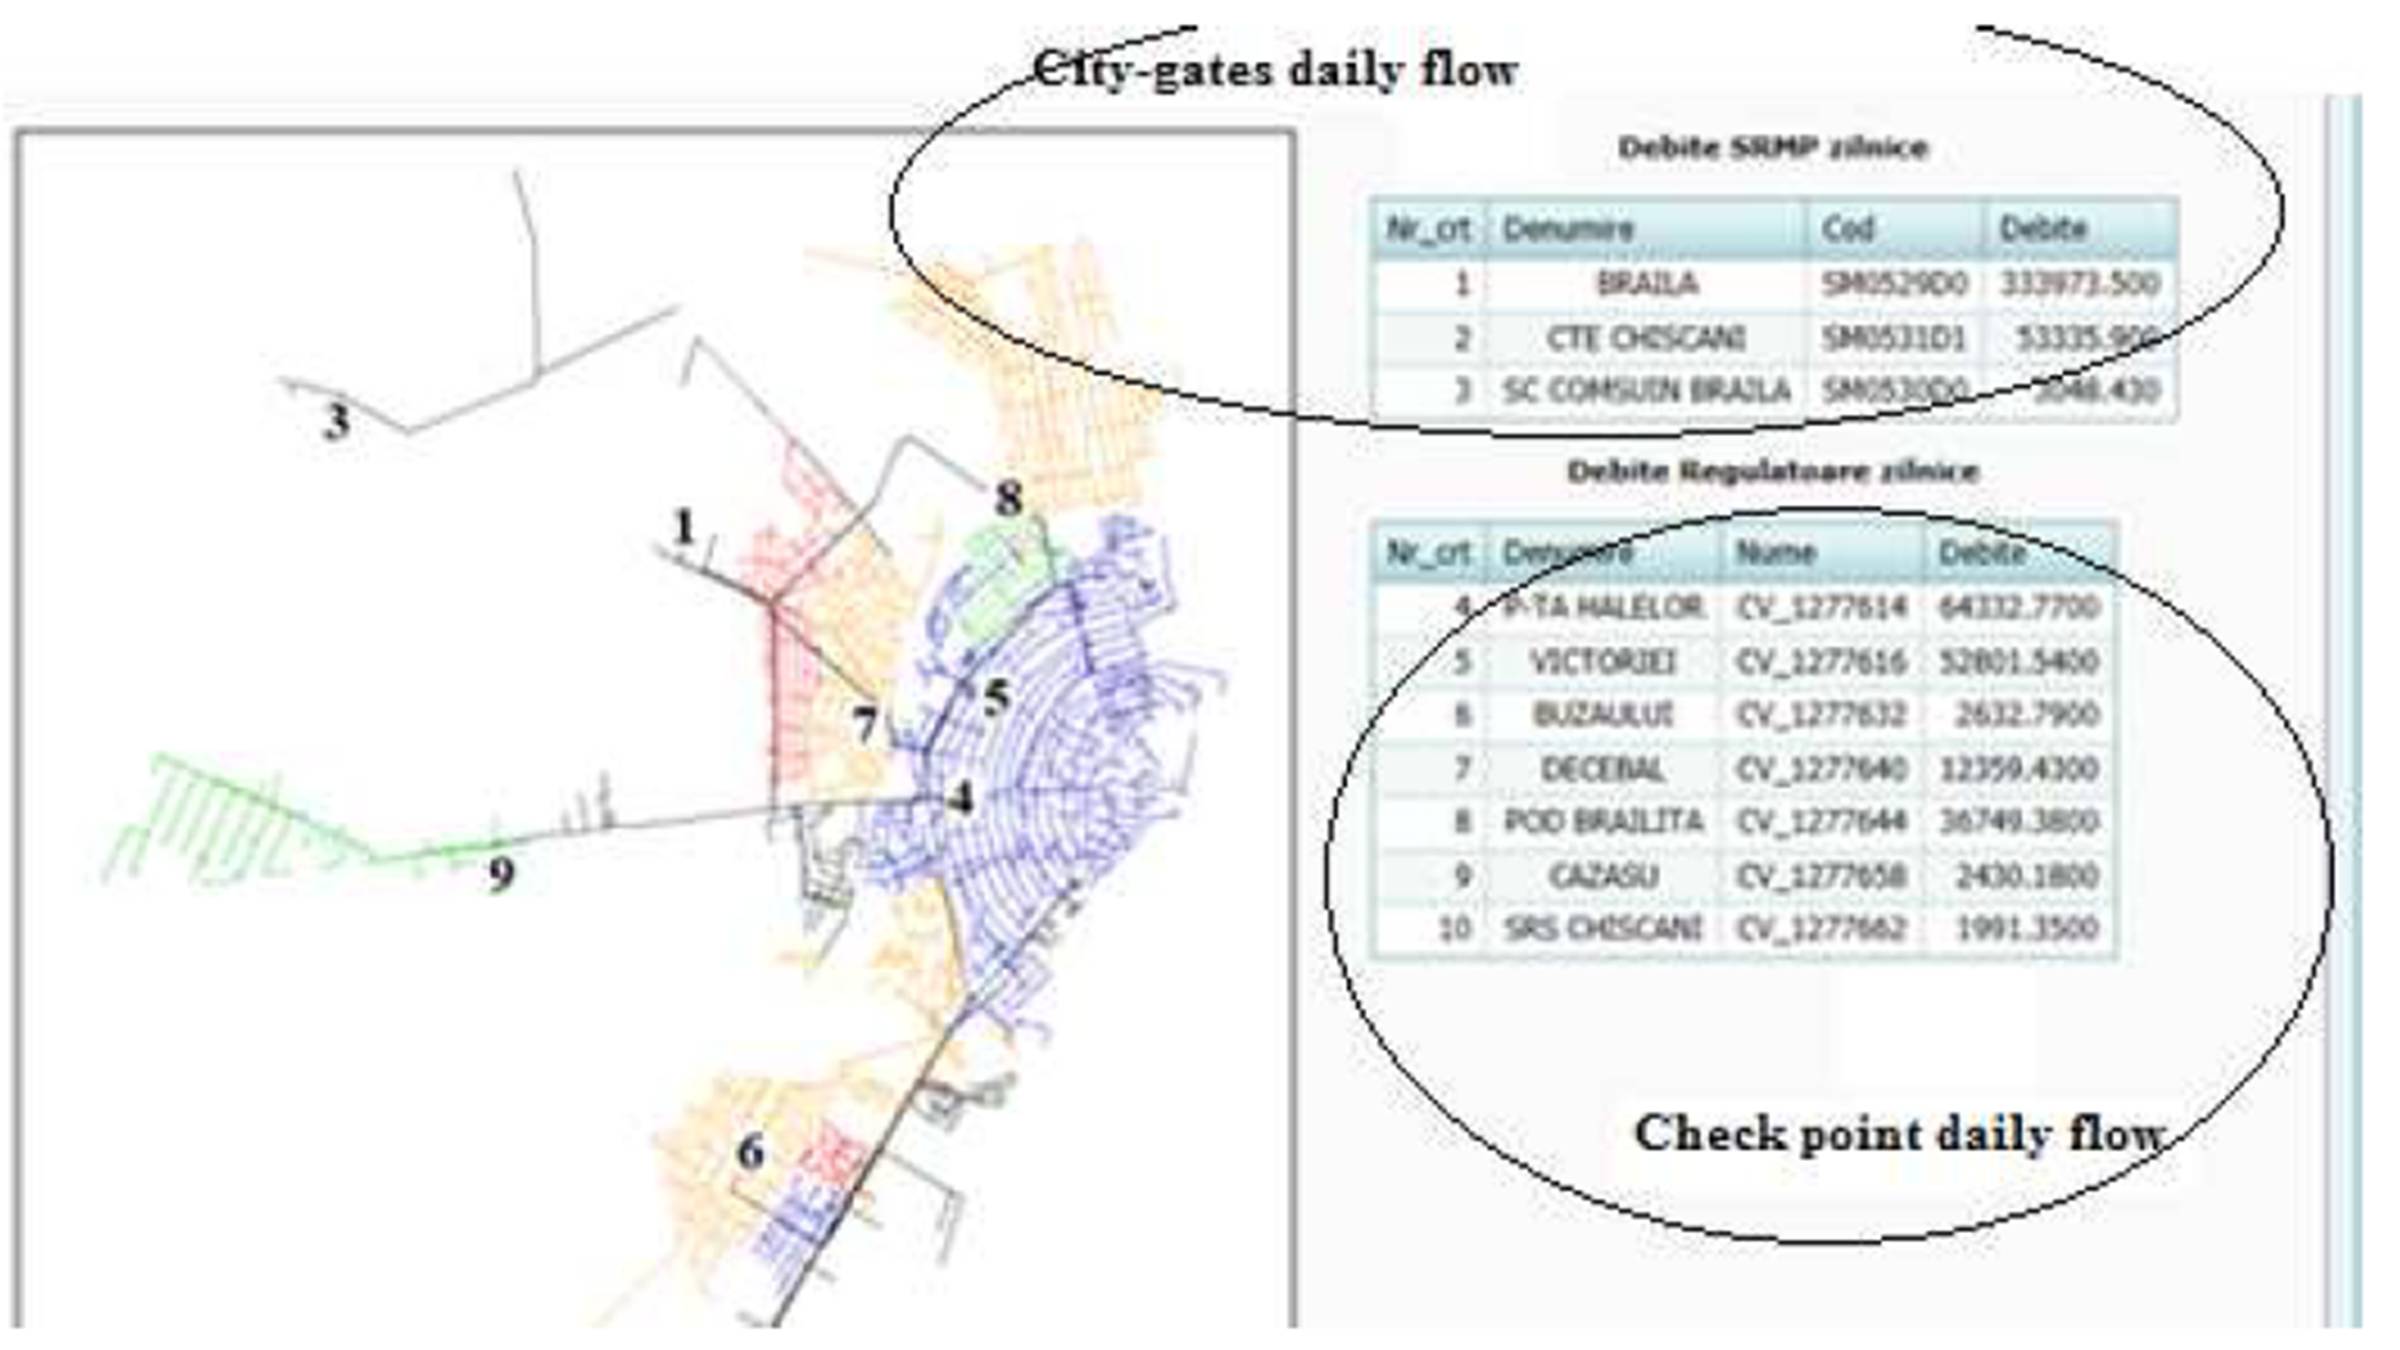
Figure 11 presents the values of the daily gas flow in the control points.
Figure 11: The daily gas flow in the monitored city-gates and SRS-s
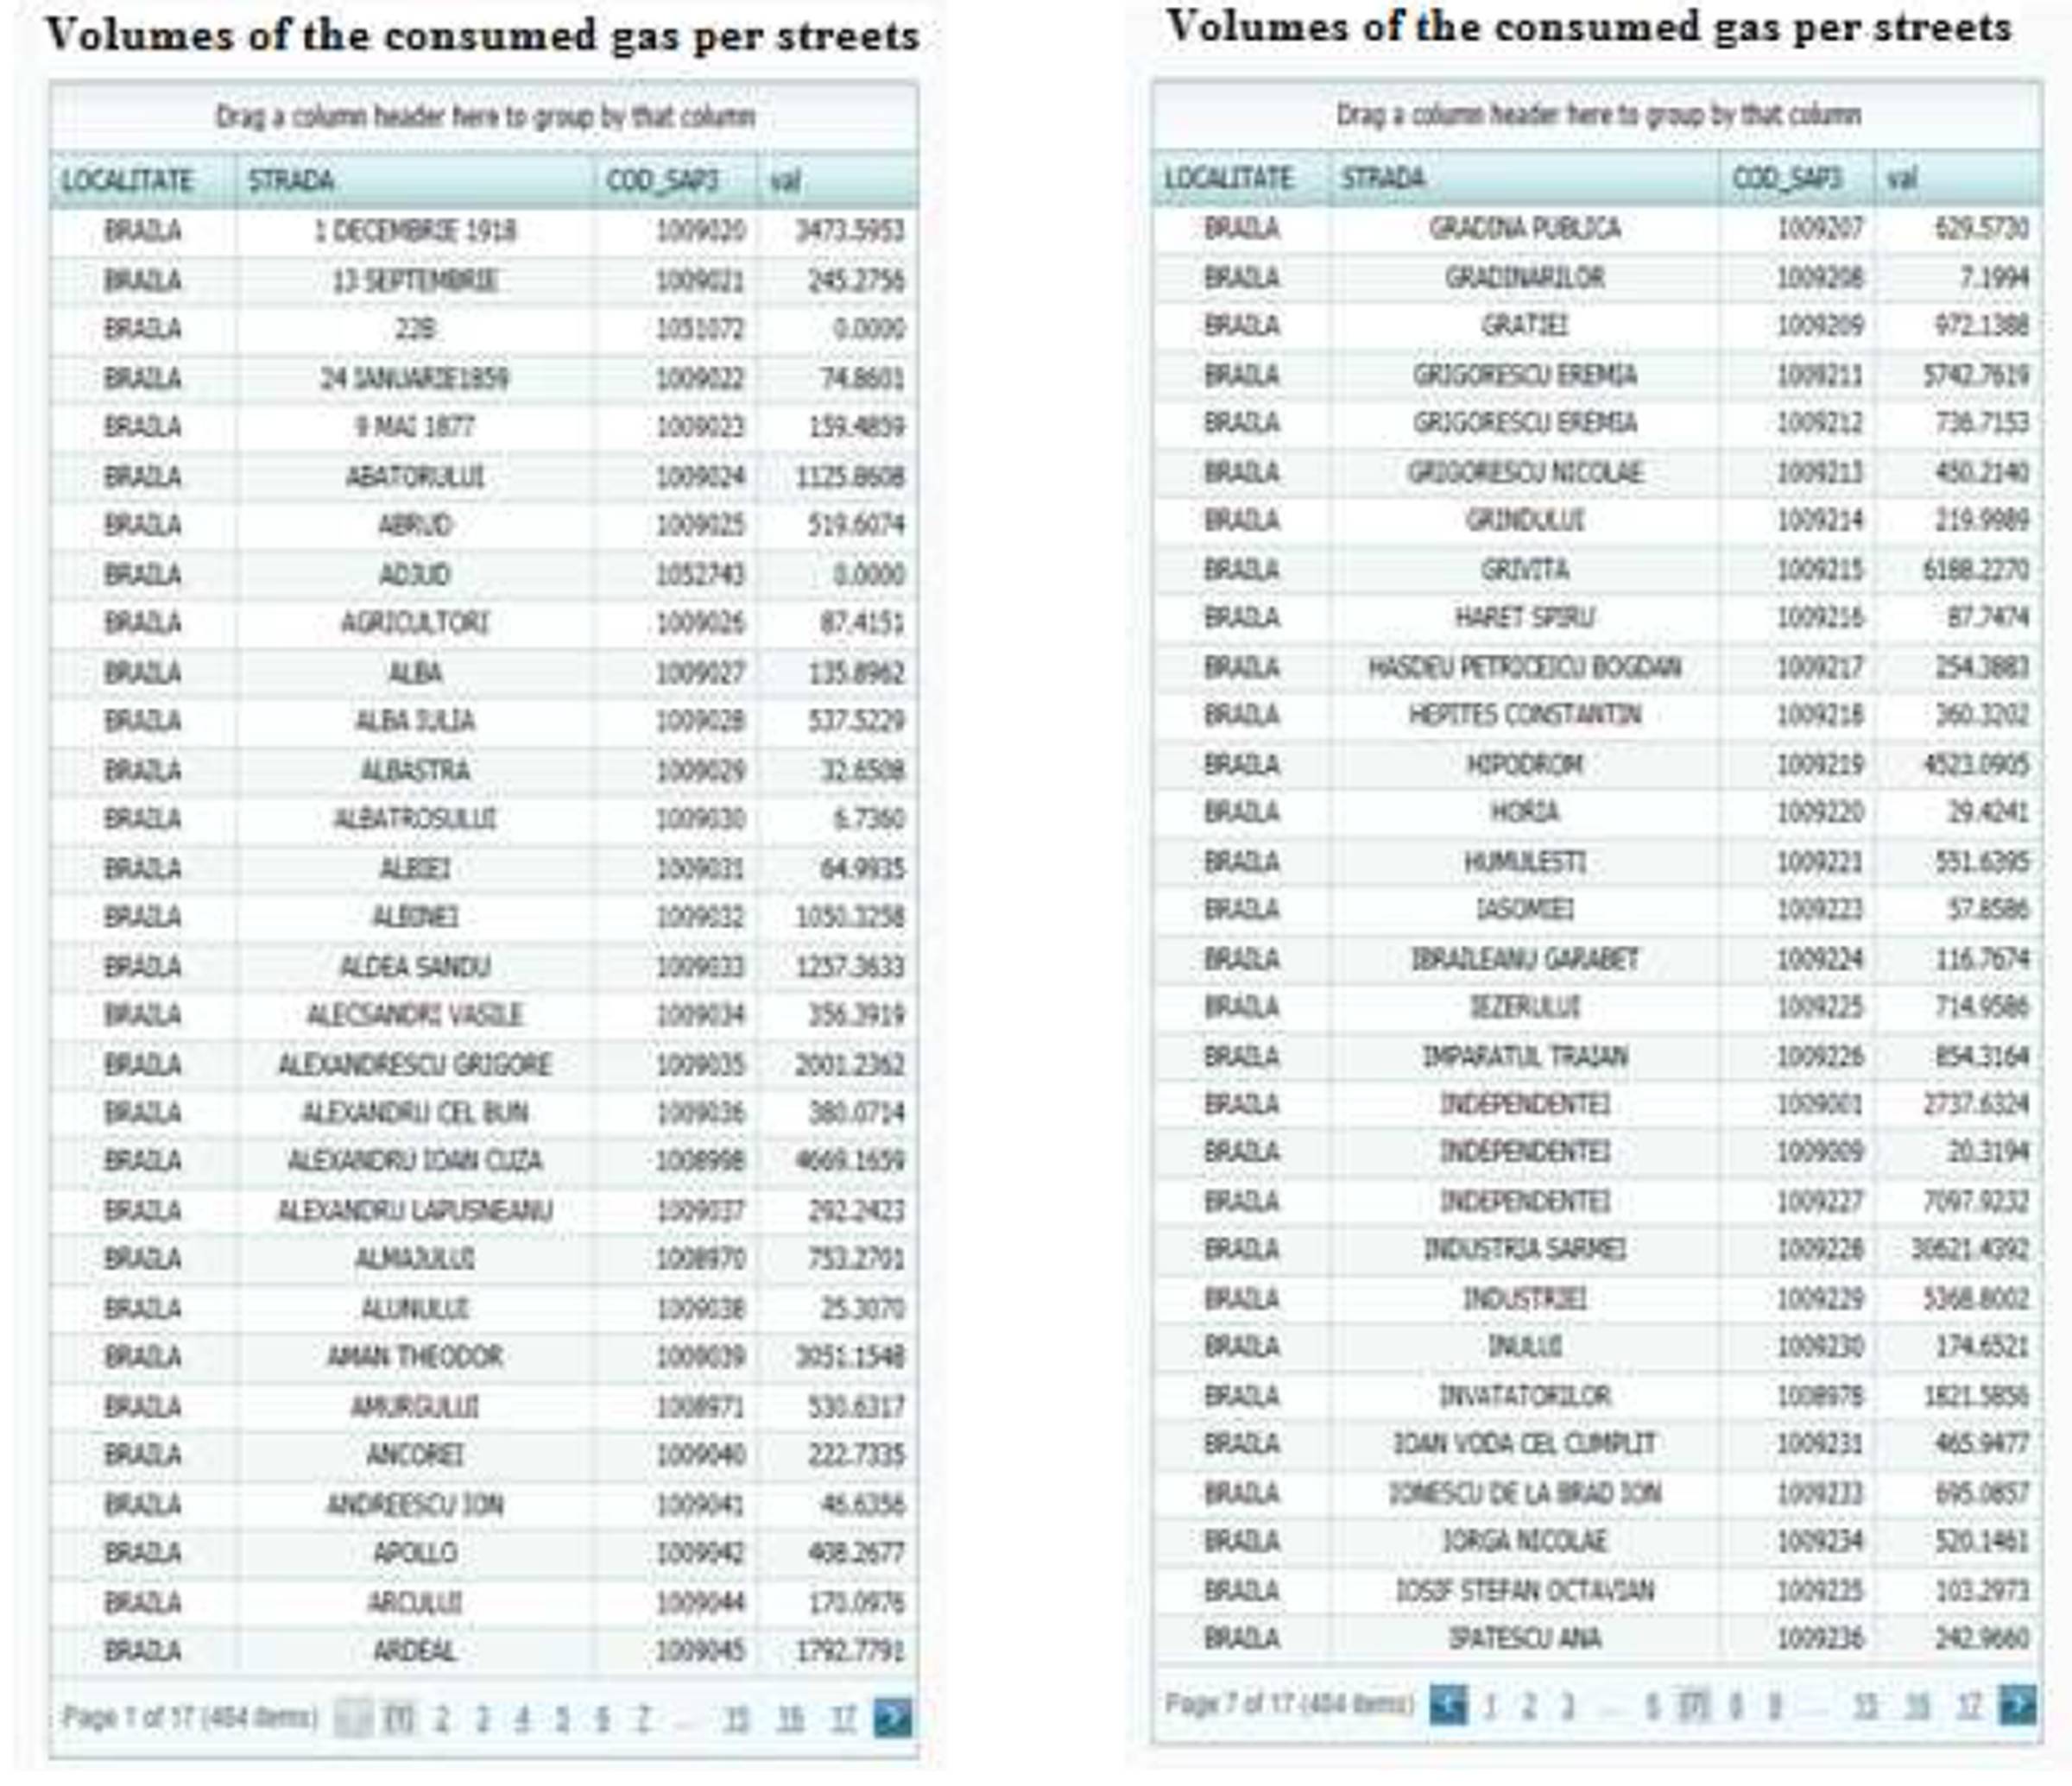
Once the volume of gas distributed to the pipelines is determined, the volumes of gas per streets are calculated, by associating pipelines to the streets (Figure 12).
Figure 12: Volumes of the consumed gas per streets
Conclusions
By using the method presented in this paper, the daily consumption for domestic consumers (B1-B3) could be determined for the pilot cities. In order for the daily consumption values to be as near as possible to the real ones, double closing is applied, which means that, every 3 months when reading of the clients is made, the estimated daily gas values are readjusted in the network balance, so that the balance may be closed for each client.
The model presented in the paper enables various simulations that may be used in the analysis of critical situations and in finding the best solutions. By means of the computer-generated model, there may be also studied different modalities to operate the distribution system under various conditions (winter, summer) in order to define the most efficient operating programmes.
One may notice the imbalance between the output volumes of gas and the inputs, fact that may be explained by the presence of a quantity of buffer gas in the pipelines.
Network balance for a gas day represents the total of hourly balances for that day. For the dynamic balance, the input data had to be processed, so that the values correspond to the same periods of time. The dynamic calculation is much closer to the real network operation.
Besides the input data (i.e. flows, pressures), the location of the valves in the system — the operating elements of the network — are extremely important in the simulating process. The manoeuvres carried out in the physical network must be introduced in the simulator in the moment they were realized.
For B1-B3 categories consumers, hourly consumption profiles determined by means of the input data dynamics were introduced.
The results of simulations may highlight, whenever the case, the areas with abnormal gas consumptions.
The computer-generated model of gas distribution enables:
– Predictive simulations made on the basis of temperature prognoses, in order to define necessary operating manoeuvres.
– The analysis of special situations (the lack of supply in certain points, the commissioning for big consumers, breakdowns), and defining operating manoeuvres to maintain the distribution system functional.
– The analysis of the influence of hourly consumption profiles and the necessary measures (operating, pressure level) that are to be taken to overcome possible problem.
Based on the obtained physical balance, a precise commercial balance may be done. The differences between the current method to calculate the commercial balance and the proposed method, implying daily calibration on the basis of simulations, consist in several percents.
References
Albulescu, M., Neacşu, S., Trifan, C. and Ionescu, E.M. (2008), ‘Theoretical Considerations and Experimental Measurements Concerning the Defining of Correction Coefficients in Case of Measuring Natural Gas Volumes for Household Consumers,’ Materiale Plastice, 45 (1), 38-41.
Google Scholar
ANRE, (2013), ‘Codul Retelei pentru sistemul naţional de transport al gazelor naturale,’ http://www.anre.ro/ documente.php?id=739.
Eparu, C., Albulescu, M., Medrea, L. and Metea, V. (2011), ‘Analysis Regarding the Influence of the Atmospheric Pressure on Natural Gas Consumption,’ Petroleum-Gas University of Ploiești Bulletin: Technical Series, LXIII (3), 68-76.
GTE, (2005), ‘Comments on ERGEG “Gas Balancing” Discussion Paper, Gas Transmission Europe, Brussels, www.energy-regulators.eu
Keyaerts, N., Meeus, L. and D’haeseleer, W. (2008), ‘Natural Gas Balancing: Appropriate Framework and Terminology,‘ Katholieke Universiteit Leuven, Last update June 08, TME Working Paper, http://www.mech.kuleuven.be/en/tme/research/energy_environment/Pdf/WPEN2008-03.
Neacşu, S., Eparu, C., Stoica, C., Rusu, A. and Olteanu A. (2011), ‘Metodă de estimare a consumurilor de gaze naturale folosind profilele de sarcină ale clienților,’ Termotehnica Revue, XV (1), 18-26.
Google Scholar
Neacşu, S., Trifan, C. and Albulescu M. (2008), ‘Considerations on the Errors Associated to the Measuring of the Amounts of Natural Gas Delivered to Household Consumers,’ Chemistry Magazine, 59 (7), 796-801.
Google Scholar
Simone 5.7, http://www.simone.eu/simone-company-about.asp.
Trifan, C., Albulescu, M. and Neacşu, S. (2005) “Elemente de mecanica fluidelor şi termodinamică tehnică,” Petroleum-Gas .University of Ploiești Publishing House, Ploiești.
Google Scholar