Introduction
Welfare economics is a branch of economics that evaluates economic well-being relative to competitive general equilibrium within an economy. Social welfare can be thought of in terms of individuals but it is also used to refer to a more collective form of well-being such as the nation.
Welfare may be measured either cardinal or ordinal in terms of Pareto efficiency. In applied welfare economics, such as in cost-benefit analysis, money-value estimates are used, particularly where income-distribution effects are factored into the analysis. Sometimes it refers to very material aspects of well-being such as access to economic resources. At other times it is used to mean less tangible conditions such as contentment, happiness, an absence of threat, and confidence in the future.
The work of the economist Amartya Sen (1979) seeks to relate social welfare to the value of total income or total consumption. In that matter one of the approaches consists in considering a representative agent who consumes X and who’s utility U(X) is identified to social welfare.
The Samuelson (1956) approach consists in assuming that X is optimally distributed and under this assumption there is a welfare function that depends on total consumption. The limitation of this approach is that it assumes that wealth can be redistributed at will by transfers and that the status quo is socially optimal.
Another approach consists in decomposing social welfare into a sum and a distributive component ignoring the distributional aspect of social welfare as in Kolm (1969), Atkinson (1970), Graaff (1977) and Slesnick (1998) work.
Jorgenson (1997) and Slesnick (2001) adopt a particular specification for the indirect utility function of households, defining a social welfare function that includes some degree of inequality aversion, and computing an index of social welfare. However, this method cannot be extended to comparisons of situations across populations with different preferences.
Another issue regarding welfare is whether social welfare, in the intergenerational context, should be defined as a discounted sum of utility. Without discounting a social welfare function with finite aversion to inequality faces a problem of infinite sum. In that matter many recent developments were made.
As Pigou (1932) stated the economic welfare may increase if people are willing to save in the present and protect the interests of the future against the effects of irrational discounting and of their preference for themselves over their descendants.
The problem of infinite horizon may be separated in two different issues: measuring the social welfare for certain generations and forecasting the evolution of social welfare for the future generations.
The literature on sustainability has pointed to the requirement of guaranteeing that future welfare will not decrease. Although we can say that once the guarantee of non-decreasing future welfare is established, it should be up to the present generation to decide how much sacrifice it wants to make in favour of its descendants.
Nowadays there are many wealth indicators that combine various domain indicators of economic, social and environmental performance. Prominent indicators include the Human Development Index (HDI) and the indicators computed by Osberg, Sharpe and Miringoff (2002). The weights of the various domain indicators in the general index are conventional and rarely formulate a framework for a rational discussion about what these weights should be.
A problematic feature of these indicators is that they are not individualistic. In conclusion, it is difficult to see what is gained from the existing aggregate social indicators in comparison with the simple publication of lists of domain indicators.
Investing in innovation driven factors requires important monetary resources and time. In order to invest it is necessary to sacrifice your current needs for the future ones, a characteristic not present in the human behavior. Unfortunately in order to progress and evolve in the actual economic conditions thinking in the future seems to be the key of survival.
The social welfare is a complex concept debate in many researches and studies across different nations and period of times. Many opinions and approaches were made but one thing remains certain that there isn’t only one way to describe this phenomenon.
Measuring Welfare
Due to the fact that the economic welfare is an extremely ambiguous concept, it is very difficult to measure it. There are many definitions of this concept, but none of them offers a way of calculate it as an index or indicator, and the attempts to measure are much debated.
Nevertheless there were many economists as Bergson and Samuelson, Arrow, Rawls, Sen that developed a series of welfare functions that described these controversial phenomena. Thus, the Rawls (1971) welfare indicator is calculated as the sum of the income for all individuals in the society regardless the distribution of it. The aim of total welfare is obtained by maximizing the income of the poorest individuals in the society: W = max (Y1, Y2 ,…, Yn ).
This type of indicator is not very appropriate for our analysis since there are no data regarding the level of the income for the poorest people in a given society. Even if we will take into consideration the S80/S20 income quintile share ratio this data are not available as well.
Amartya Sen (1982) is proposing a different kind of indicator based of the Gini index:
WGini = Incomeper capita(1-G) where G is the Gini index.
Unfortunately the data for the Gini index are not available for a continuous period of time and for all the UE 27 countries and a consistent analysis cannot be developed.
Since welfare has also been described as a multifaceted concept a composite indicator has been created. Although this method is rather controversial, it has been applied increasingly.
But, a composite indicator can only give an overall picture of a phenomenon, and thus it can only be used as a started point for a more detailed analysis.
The Methodology of the New Welfare Index
The welfare index was computed using four pillars based on the methodology presented in the study Comparing welfare of nations developed by the Department for Economic Statistics in Sweden in 2004. In that matter we will shortly describe the welfare index components.
Economic Standard (National Income PPP) Index
Economic factors influence the economic welfare of any country, not directly, but through the national dividend or national income. The economic welfare is that part of total welfare which can be brought directly or indirectly into relation with a money measure, and the national dividend is that part of the real income, including, the income derived from abroad.
The two concepts, economic welfare and the national dividend, are coordinated that any description of the content of one of them implies a corresponding description of the content of the other.
Leisure Time Index
The leisure is an important factor for well being and social relationships that involves complex social bounds and evolved interactions between individuals. Also more and more social groups especially youth and well-educated people live for their work instead of working to make a living.
This kind of behavior seems to affect the human capacity to resist on the long run. The ratio between work and leisure time is very important for the human kind development.
The methodology used to calculate the leisure time indicator is presented in the study: Society at a glance 2009: OECD social indicators/Chapter 2 Measuring Leisure in OECD Countries (2009). The leisure time indicator used in our analysis is considering maximum leisure time as the amount of time that is not spent in paid work.
Even if there are limitations of this approach its advantage is that data on hours worked are available on a comparable basis for all the 27 UE countries for sufficient periods of time.
Since the data regarding holiday leave, early retirement, housewives and other reasons that people of working age are not part of the labor force were not available we used the average number of actual weekly hours of work in main job.
In the neoclassical approach regarding work and labor supply the theoretical and empirical attention focuses on the labor and/or leisure choice ignoring other uses of time. It examines the margin between paid work and all other uses of time, which include leisure time as well.
Continuing Mincers work, Gronau (1976) argues for a need to distinguish between unpaid work (home production) and leisure and develops a formal model which includes leisure, home production and paid work, assuming that marketed goods obtained from paid work and home produced goods are perfect substitutes. A rise in the income level increases leisure, reduces paid work, and leaves home production unchanged.
The empirical work of Bloch and Gronau (1977) using United States and Israeli data suggests that leisure amongst couples is positively related to the husband’s wage income, negatively related to the wife’s wage income, and positively related to non-wage income. In addition, higher numbers of children, and especially pre-school children, reduce leisure time.
Environment Index
For this indicator we took into consideration the main air polluters in all the sectors of emissions for the national territory such as: sulphur oxides expressed in tones, nitrogen oxides expressed in tones, greenhouse gas emissions expressed in tones (CO2 equivalent).
Health Index
In this area we weight 3 main indicators:
- Mortality rate (the number of infants dying before reaching one year of age per 1000 live births in a year);
- Life expectancy for female (the number of years a new-born female infant would live if prevailing patterns of mortality at the time of its birth were to stay the same throughout its life);
- Life expectancy for men (the number of years a new-born male infant would live if prevailing patterns of mortality at the time of its birth were to stay the same throughout its life).
After we collected all the necessary data we aggregated and transform them in order to obtain the new welfare index. The formula used for the new welfare index was:
Where:
- GNI: gross national income (PPP)
- SO, NO, CO (sulphur oxides index, nitrogen oxides index, greenhouse gas emissions index)
- MR, LEF, LEM (mortality rate, life expectancy for female index, life expectancy for men index)
Computing the Welfare Index
When calculating the new welfare index we used two methods:
The Benchmark Method
We named this method that way since for each year and for each indicator one country from our list was chosen to be the leader, the trend setter.
For this method we calculated all the indicators and sub-indicators based on the maximum/minimum value registered in one of the 27 states taking into analysis in the period 2000-2010.
For example: the maximum value in the year 2009 for the GNI per capita indicator was registered in Luxembourg and for that reason this country received the maximum value for this indicator 25 points.
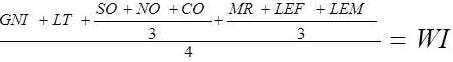
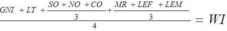
Table 1: Welfare Index by Benchmark Method
Given our calculation Luxembourg and Switzerland are the absolute leaders for the entire analyzed period, the only countries with values greater than 60 points. On the next three places are the Nordic countries: Netherlands, Sweden and Denmark with very tight scores. At the bottom of the ranking are the new members of the EU27 Bulgaria and Rumania fighting constantly for the 26th position.
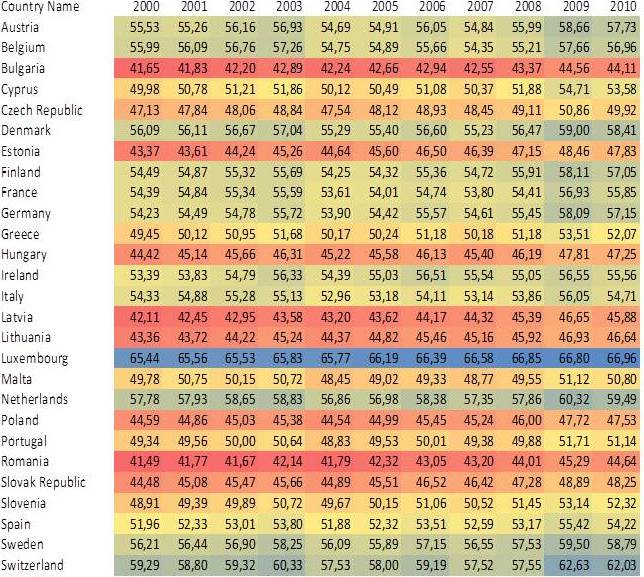
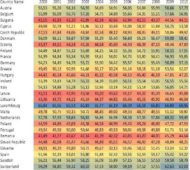
The EU27 Average Method
We name it that way since for each year and for each indicator we chosen the EU27 average as the trend setter so the maximum/minimum value for one country could exceed 100 points.
For this method we calculated all the indicators and sub-indicators based on the EU27 average registered in the period 2000-2010. For example: the EU27 average value in the year 2010 for the mortality rate indicator was 4,216839 (25 points) and the minimum value for this indicator was registered in Luxembourg, 2.1 (50.2 points).
The results obtained using this method keep the ranking resulted from the benchmark method with Luxembourg leader and Bulgaria and Rumania on the last places.
Table 2: Welfare Index EU27 by Average Method
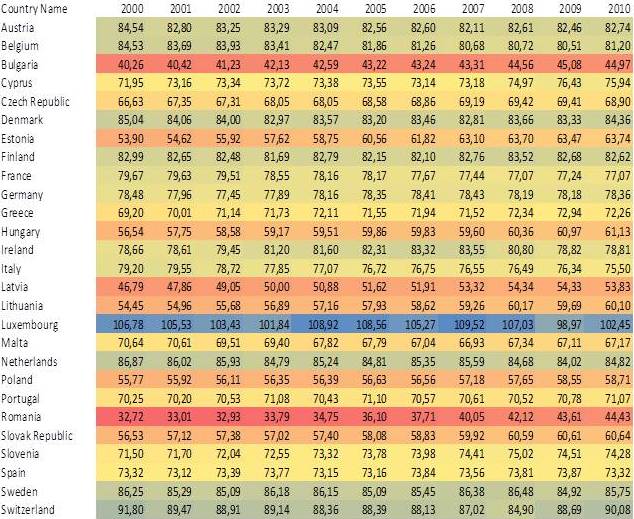
In the graph below is represented the position of each EU27 country for each of the 10 years analyzed.
The purpose of this representation was to make out the performance of each UE member in terms of welfare. According to our results 10 countries improved their positions, 11 maintained their welfare levels and only 6 worsen their ranking between 2000 and 2010.
All the states with better results gained two places over the 10 years analyzed. Even if Estonia climbed only 2 positions it was the state with the biggest growth, improving the welfare level by 10% due to income per capita growth (+103%) and constant reducing of its mortality rate (-57%).
Nevertheless, the biggest fall was registered by Belgium from 5th place in 2000 to 9th place in 2010, its welfare level growing with only 2% in the analyzed period. This poor evolution it is mainly because of a modest GNI growth (only 39%) even if the environment indicators registered smaller values.
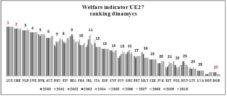
Fig. 1: Ranking Dynamics of Welfare Index E.U. Countries
At a closer look it seems that all the states in top 3 maintained their advantages and kept their positions for a long period of time, the only exception was in 2008 when Netherlands took Switzerland’s place and occupied the second position.
Also it can be notice that Bulgaria and Rumania, the bottom two states did not accommodate very well in the new structure since their welfare levels did not improve significantly after they become members of the EU.
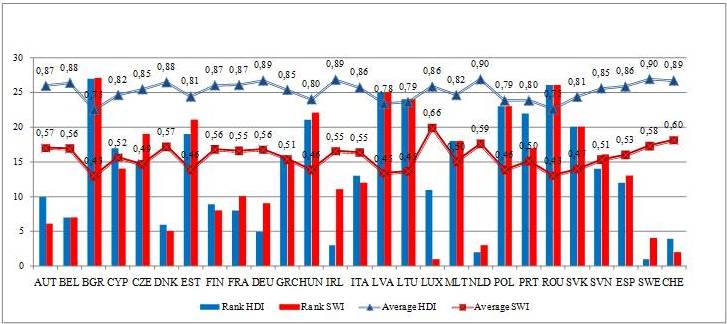
Furthermore we have analyzed the similarities and differences between the welfare index (SWI) and the Human Development Index taking into consideration the average values for each indicator and the resulted rank of each country. The averages were calculated for the values registered in 2000, 2005, 2009 and 2010.
Given the analyzed period the HDI method used to calculate it was the one promulgated by the United Nations Development Program valid until 2011 when a new formula was applied.
The old formula weighted each sub index with 1/3: life expectancy index, education index and GDP index. In contrast with the health pillar present in the welfare index which includes life expectancy as well, the index used for HDI is calculated as the difference between total life expectancy and 25 divided by 60. Also, both indicators have in their composition an indicator expressing the economic standard such as GDP for HDI and GNI for the welfare index.
Comparing the welfare index with the Human Development Index (fig. 2 ) there is no a broad correlation: some countries keep their ranking place (Belgium, Latvia, Lithuania, Malta, Poland, Slovak Republic, Romania and Bulgaria), or make nearly score (Netherland, Denmark, Italy, Finland, Greece, Hungary and Spain), but there are important discrepancies (Ireland – 3th rank for HDI and 11th rank for SWI, Luxemburg – 11th for HDI and first rank for SWI, Sweden – first rank for HDI and 4th for SWI).
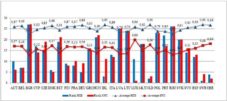
Fig. 2: Ranking and Average Levels of HDI and SWI for E.U. Countries
Econometric Analysis
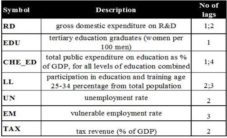
In this section we analyzed the correlation between welfare (SWI) and different positive indicators that are innovation driven such as: research and development expenditure (RD), tertiary education graduates (EDU), long learning (LL) and public expenditure on education (CHE_ED). The data used were collected from the Eurostat (http://epp.eurostat.ec.europa.eu) and World Bank (http://data.worldbank.org ) databases for the period 2000-2010, for the 27 European Union states.
In order to obtain relevant and consistent estimators all data suffered modifications. The endogenous variable is the new welfare indicator presented in the previous sections (SWI). We have chosen the indicator calculated with the benchmark method. For the independent variables we selected:
Table 3: The Description of the Econometric Analysis Variables
We tried to test the correlation between SWI and these variables by using 3 econometric equations, starting with the ones assumed to have a positive influence and completing the analysis with another one assumed with negative influence:
Positive Factors Regressions
Eq.1: SW(t) = 0.421785SW(t-1) + 0.440763RD(t-1) + 0.417241RD(t-2) + 0.01303EDU(t-1) + 0.056876LL(t-2) + 26.23321
Eq.2: SW(t) = 0.396276SW(t-1) + 0.634561RD(t-2) + 0.013030EDU(t-1) + 0.091650LL(t-3) – 0.696634CHE_ED(t-1) + 0.424923CHE_ED(t-4) +30.71747
Negative Factors Regression
Eq. 3: SW(t) = 0.289734SW(t-1) + 0.613345RD(t-2) + 0.036235TAX(t-2) – 0.062104EM(t-3) – 0.170819UN(t-2) + 37.56089
Interpretation of the Results
The econometric regressions show that for the analyzed period there is a stronger determination between the welfare, research and development expenditure, no of graduates on the tertiary, long learning, unemployment and vulnerable employment (R2 adjusted= 0.9%).
As for the coefficients of the explanatory variables, the models show also a particular modification of the dependent variable taking into consideration the number of lags.
Between the positive factors and the endogenous variables there is a direct relation.
In that way we identified a strong positive correlation between the level of welfare in the current year and the one of the last year, which shows the autoregressive feature of welfare meaning that the actual variable depends on the values in the past.
Also, we notice that an increase in the expenditure on research and development level of last year and the present year too, will produce an increase on the next year’s welfare level according to the positive coefficient of +0.4 points, for 1 lag and 2 lags RD variable.
The long learning programs for people with ages between 24 and 35 years old also have a positive influence on welfare but at a distance of 2 years given the number of lags for the LL variable.
Also, it seems that there is a weak positive correlation between the numbers of graduated students in tertiary education and welfare, but since the coefficient value is only 0.01 we consider it insignificant.
Since in the previous equation (eq.1) we discover that the correlation between EDU (represented by the number of tertiary graduates) and welfare isn’t significant we replace it in the second one (eq. 2) with the public expenditure on education as a percentage from GDP.
The results show that the immediate effect of education expenditure on welfare is negative taking into consideration the coefficient sign for the 1 lag variable which means that it takes time for the investment programs in education to produce positive effects.
The last affirmation is sustained by the fact that a 4 lag variable it is positively correlate whit the endogenous term. So, it seems that it takes at least 4 years for the improvements in education to produce a positive modification in the social welfare levels.
In order to understand the mechanism of the new welfare indicator we added, to the positive factors tested in the first two equations, the unemployment and vulnerable employment rates which we characterized as being the negative factors.
Our classification was sustained by the sign of those variables showing that an increase in their levels will negatively affect the welfare’s score. As in the expenditure on education variable case the effect of the negative factors isn’t instantaneous given the 2 lags for unemployment and 3 for vulnerable employment.
In the third equation we also introduced the tax revenue as a percentage of GDP but since the value of the coefficient is closer to 0 (+0.036235) we consider that it has no effect on the welfare index.
Conclusions
Because we noticed that there is a real need for consensus when it comes to the calculation method for the welfare index, in this study we tried to calculate a suitable index for social welfare by using the so called index method. Furthermore we described the social welfare of E.U. member states as a composite indicator and although this method is rather controversial, it has been applied increasingly lately.
Our proposal for a welfare index shows some concordance with the Human Development Index, but also some disparities for a panel of E.U. member countries.
Moreover we analyzed the connections between the new welfare index, calculated using the so called benchmark method, and those factors that we demonstrated to have a particular positive influence on the well being of the society, in our case the European Union.
By using an econometric panel model we discover that research and development investments and education expenditure are strongly correlated with the new welfare indicator.
The assumption of positive influence on welfare for the innovation driven analyzed factors was sustained by the econometric tests. The tendency is maintained also in the cases of the negative assumed factors and their negative influence on the endogenous variables.
There are important positive impacts on welfare from R & D, public expenditure for education, but a low level of influence for tertiary education and long learning. The results also emphasized an important negative influence on the welfare variable, when it comes to unemployment, but a low impact of the vulnerable employment.
Also, our econometric equations showed an important inertial effects in the welfare index dynamics since the coefficients on first lag autoregressive component were significant.
Nevertheless we underline once more that in order for the welfare’s level to improve we have identified some of the ways for this to happen and they are: investing in research and development programs, continuously improving of the educational system, reducing the unemployment rates corroborated with the decrease of the vulnerable employment levels, using regenerative resources and reducing pollution, improving and developing the health system.
References
Blanchard, O. (2011). Macroeconomics: Updated Edition, 5th Edition, Pearson Education.
Publisher
Chapple, S. & Ladaique, M. (2009). “Society at a Glance 2009: OECD Social Indicators,” 19-51, http://www.oecd-ilibrary.org/social-issues-migration-health/society-at-a-glance-2009_soc_glance-2008-en;jsessionid=
geo2d9r3yqfk.epsilon.
Publisher
Dinu, M. (2006). ‘Fundamentarea si Coordonarea Politicilor Economice in Uniunea Europeana,’ Editura Economica, Bucharest.
Google Scholar
Durlauf, S. N. & Blume, L. (2008). The New Palgrave Dictionary of Economics (8 Volume Set), Palgrave Macmillan.
Publisher – Google Scholar
French, E. (2005). “The Effects of Health, Wealth, and Wages on Labor Supply and Retirement Behavior,” Review of Economic Studies, 2 (4), 395-427.
Publisher – Google Scholar
Hagén, H. (2004). “Comparing Welfare of Nations,” Statistics Sweden, Department for Economic Statistics, [Online], [Retrieved July 15, 2012], http://www.scb.se/Statistik/OV/OV9999/2004A01/OV9999_2004A01_BR_X100ST0415.pdf.
Publisher
Henkel, J. & von Hippel, E. (2005). “Welfare Implications of User Innovation,” The Journal of Technology Transfer, 30 (01), 73-87.
Publisher – Google Scholar
Petrin, A. & Warzynski, F. (2012). “The Impact of Research and Development on Quality, Productivity and Welfare,”University of Minnesota. [Online], [Retrieved June 14, 2012], http://web.lexis-nexis.com/universe/document.
Publisher – Google Scholar
Ramey, V. (2006). “A Century of Work and Leisure,” National Bureau of Economic Research Cambridge. [Online], [Retrieved June 20, 2012], http://pages.uoregon.edu/harbaugh/Readings/w12264.pdf.
Publisher
van Baalen, B. & Muller, T. (2005). “Social Welfare Effects of Tax-benefit Reform Under Endogenous Participation and Unemployment,” Research Papers by the Department of Economics, University of Geneva, [Online], [Retrieved August 10, 2012] http://econpapers.repec.org/paper/gengeneem/2005.03.htm.
Publisher