Introduction
The European Social Model (ESM) — is mostly used to describe the sustainable economic growth and social cohesion within the European Union (Jepse, Serrano Pascual, 2005). This concept is used as a model for the construction of European society in opposition to both the neo-liberal model promoted by the USA (which leads to the polarization/disintegration of society) and, more recently, to the regulated social market model which more often than not involves economic inefficiency.
In the mid 90s, Jacques Delors promoted the vision of European Social Model (ESM) to designate an alternative to thepure form of capitalism in the U.S. market. The main idea of the ESM was that economic and social progress must bedirectly correlated, meaning that, the economic growth must correspond to the social cohesion (Jepsen and SerranoPascual, 2005).
One of the first definitions of ESM appears in the “White Paper on Social Policy” of the EU. In the White Paper, ESM is defined as a set of shared values that define the concept of democracy, individual freedom, social dialogue, equal opportunities for everyone, social security and solidarity towards the disadvantaged in society. This is the definition thatestablished the broad sense in which the literature approaches ESM in terms of regulations (European Commission,1994).
It can be noted that, ever since the European Council Conclusions were formulated at the Lisbon Summit (2000), the focus has been laid on the upgrading of ESM and the directions have been guided by the need for education and training, the adaptation of one’s skills and the lifelong process of learning, the reform of the social security system, and finally, thepromotion of social inclusion. It is noted that these new directions aim at the human capital and especially at the labour market supply (European Council, 2002).
In terms of social protection, the focus was laid on the fiscal sustainability of pensions, on the profitability of labour and at the same time, on the social inclusion and the promotion of full employment. Therefore, it is notable that the upgrading of ESM leads to the consolidation of individual capacities of the European citizens so that they are able to cope with and survive in the continuously changing global economic environment.
Ferrera, Hemerijck and Rhodes (2001) describe the key features of the model as: a comprehensive basic social securityfor all citizens, a high degree of interest and coordination of social negotiation and a greater equity in terms of income distribution. They argue that these elements are institutionalized to varying degrees in the EU and liberal models asthose of Great Britain and Ireland are two exceptions among European groups. Moreover, countries like the Netherlands, Denmark and Austria are considered by these authors as good examples to show how economic growth can beaccompanied by a generous social policy.
Globalization is an intensifying competition for markets around the world. At the same time, in recent years, the EU growth rates have not lived up to expectations. This has brought claims that in a more competitive environment, Europe can no longer afford the ’luxury’ of strong welfare measures (Batić, 2011). The EU must cut spending on social protection and ease regulation for business if it is to compete with developing economies like China and India (Tausch, 2011). The EU’s social legislation creates an important safety net of minimum standards, preventing a downward spiral of social dumping.
It is true that some Member States, and in particular the Nordic countries, have been more successful in achieving a high growth and a low level of unemployment (Magnusson, 2007). The EU needs to learn from examples of ’best practice’ and examine whether systems such as ’flexicurity’ – whereby greater mobility between jobs is accompanied by active welfare measures – can be adapted more broadly.
By implementing the Europe 2020 Agenda, the EU wants to create a modern European Social Model, more flexible to global economic changes, one that can ensure both competitiveness and social justice. The EU can achieve bothproductivity growth and the increase in employment rates without compromising its social dimension. The existing trade-off between macroeconomic efficiency and long term sustainability of national welfare systems can be avoided by themodernized European Social Model. Aiginger (2010) believes that this is not a barrier against increasing competitivenessif it is reformed in the direction of stimulating economic growth, improving incentives and workforce skills.
Methodology
In order to see the impact that the European Social Model (ESM) has on the EU economy we estimated the effects ofsome representative variables of ESM on unemployment rate and poverty rate, hence labour market and living standards.
In the panel model we considered the unemployment rate and poverty rate after social transfers endogenous variablesand in terms of exogenous variables, we took into account the share of social benefits in GDP, the growth rate of real GDP, the employment rate and the tax burden on labour, expressed as implicit tax rate on labour.
For the first model we used annual time series to analyze the period 2000-2010, and for the second model we analysed the period 2004-2010. The source of the data is the European Union database, Eurostat.
We believed that it was important to analyze the unemployment rate since in the EU there is a high level of unemployment in most countries, and this was associated with the high impact that social expenditures made bygovernments have on GDP. Also, the amount of expenditures for social protection has a high share in the revenues of the states, many of which are extremely rigid costs (pension and health care).
The tax burden on labour is of great importance in unemployment, as it reduces the incentives to work and inhibits theinvestors’ initiative to create jobs.
In 2010, the average implicit tax rate on labour in the EU was 36% and 38% in the euro area, but now, at the EU levelthere is a tendency to amend the fiscal burden from three main directions (consumption, labour and capital) and several countries are adopting a higher consumption tax and a reduction in the tax burden on labour, at least at the beginning, on those with relatively lower incomes (1).
In spite of the developments of the European Union (EU), poverty in the EU is still at a relatively high level. Europe 2020is the EU’s strategy for smart, sustainable and inclusive growth for the next decade. For the first time, reducing poverty has been made a target. EU leaders have pledged to bring at least 20 million people out of poverty and exclusion by 2020.
Approximately 80 million people in the EU (16% of the population) live on less than 60% of their country’s average household income, 19% of children in the EU are also currently in or at risk of poverty and 17% of Europeans suffer from material deprivation, their living conditions are severely affected by a lack of resources (Eurostat).
The first model equation has the following form:

Where i stands for each country and:
RUit — rate of unemployment for each country in year t;
SPBit — social protection benefits (2) in GDP for each country in year t;
RGDPit — growth rate of real GDP for each country in year t;
LTAXit — labour implicit tax rates for each country in year t;
ε – residual error.
The second model equation has the following form:

Where i stands for each country and:
RPOVit — poverty rate after social transfers for each country in year t;
SPBit — social protection benefits (2) in GDP for each country in year t;
RGDPit — growth rate of real GDP for each country in year t;
REMit — employment rate for each country in year t;
ε– residual error.
In order to observe the effects that the European Social Model has on the EU unemployment rate, we applied a panel econometric model on three groups of countries:
- European Union (EU27): Austria, Belgium, Cyprus, Denmark, Estonia, Finland, France, Germany, Greece, Ireland,Italy, Latvia, Lithuania, Luxembourg, Malta, United Kingdom, Netherlands, Poland, Portugal, Czech Republic, Slovakia,Slovenia, Spain, Sweden, Hungary, Romania and Bulgaria;
- Euro Area countries (EU17): Belgium, Germany, Estonia, Ireland, Greece, Spain, France, Italy, Cyprus, Luxembourg, Malta, Netherlands, Austria, Portugal, Slovenia, Slovakia, Finland;
- Central and Eastern Europe countries (EU10): Estonia, Latvia, Lithuania, Poland, Czech Republic, Slovakia,Slovenia, Hungary, Romania and Bulgaria;
Empirical Results
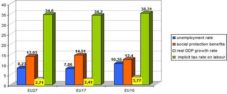
By creating a short descriptive statistics in the EU countries (Figure 1) we see that in the 10 countries in Central and Eastern Europe, the average social expenditure in the period 2000-2010 was 12.4% of GDP, while the average growth rate of real GDP of the region was around 3.7%.
Data source: Eurostat
Fig. 1. Average Values of the Variables Used in the First Model for the Three Groups of Analyzed Countries (%)
At the same time, the average unemployment rate was around 10%, while the implicit tax rate on labour was 35.3%. Thus, e venif — in the analyzed period – the countries underwent economic growth rates higher than the EU27 average(3.7% average growth of the real GDP, versus 2.7% in EU27), the real GDP growth had less impact in the economies ofthese countries, thus the average unemployment rates remained at an overall higher level (10.3% versus 8.2% in theEU27).

Data source: Eurostat
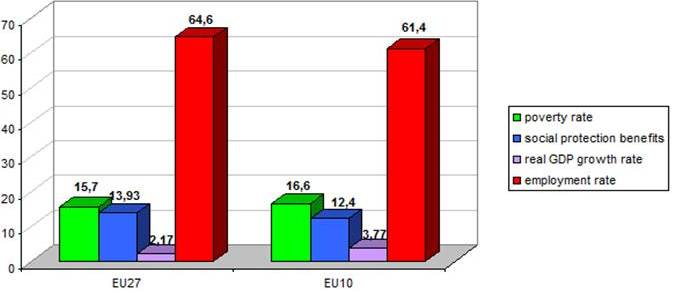
Fig. 2. Average Values of the Variables Used in the Second Model for the Two Groups of
Analyzed Countries (%)
Figure 2 presents the descriptive statistics of the variables analyzed in the second econometric model. It can be seenthat the average growth rate of the real GDP between 2004 and 2010 was approximately 2.2 percent, and the poverty rate was 15.7 percent in the EU27. At the same time, in the EU10, the average poverty rate was almost one percentage point higher than in the EU27, respectively, 16.6%, and the average growth rate of the real GDP was 3.7 percent. Aminimal difference can also be observed in terms of the average employment rate, which in the EU27 was 64.6% while in the EU10 was 61.4%. The maximum average employment rate in the EU27 occurred in Denmark in 2008 (77.9%), and for the EU10 in Estonia, 69.8%, also in 2008.
Data source: Eurostat
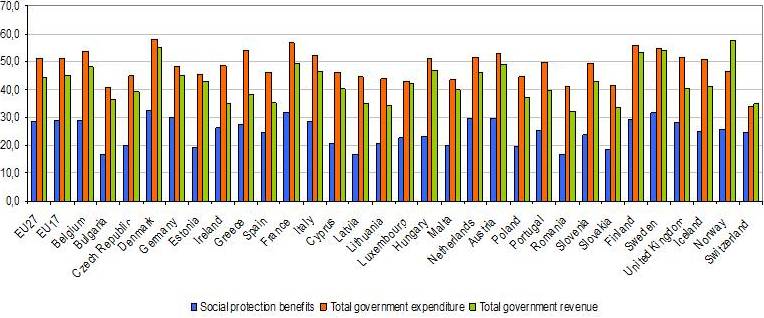
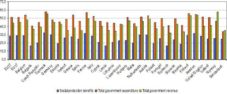
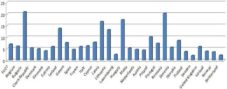
Fig. 3. Expenditure on Social Protection, Total Government Spending and Total Budget Revenues in 2009 (Shareof GDP)
In Figure 3 we can see that the EU average social protection expenditures are at around 30% of GDP. Above the EU average thereare several countries known for their social policy, like Denmark (33.4%), France (33%), the Netherlands(31.6%) and Sweden (32.1%), while Latvia, Romania and Bulgaria have the lowest share of social protection expenditurein GDP (16.8%, 17% and respectively 17.2%).
Data source: Eurostat
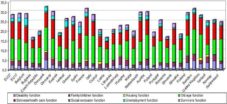
Fig. 4. Structure of Expenditure on Social Protection in 2009 (Share of GDP)
In Figure 4 the expenditures on pensions and health care are the largest as a share of GDP, as these two categories of expenditure have an average share of 8.4% respectively 12.7% for the entire Community. The countries with the highestshare of GDP of expenditures on pensions are Italy (16%), France (14.4%), Austria (14.6%), Greece (13.5%) and Sweden (13.2 %).
At the same time, Ireland (6.6%), Slovakia (7.6%) and Latvia (7.8%) are the European Union countries that have spentthe lowest percentage of GDP on pensions. Along with the ageing process of the population, which characterizes almost all EU countries, it is expected that these expenses should increase.
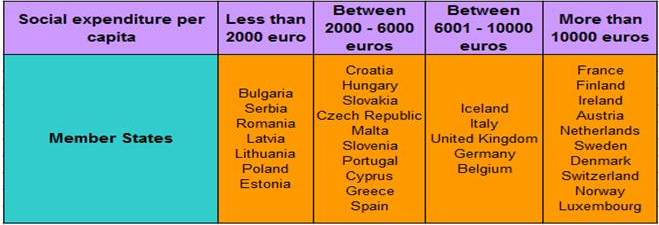
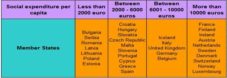
In terms of empirical evidence, in the European Union there is a high heterogeneity of the expenditures on social protection per capita (Table 1).
Table 1. Social Expenditure per Capita in EU in 2010
Data source: Eurostat
The lowest level of expenditures on social protection per capita are to be found in the latest two countries that joined theEU, Romania and Bulgaria, 1017 Euros, respectively 864 Euros. At the same time, the EU average is 7962 Euros percapita, while the average value in the Euro area is about 8400 Euros.
Data source: Eurostat
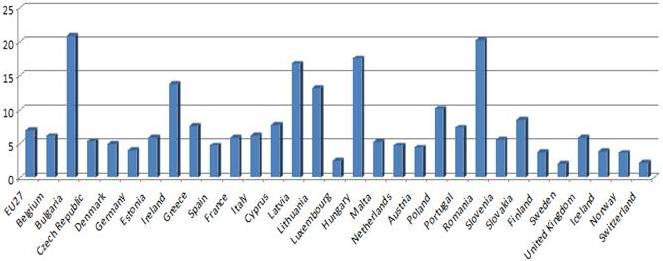
Fig. 5. Reduction of Poverty Rate after Social Transfers in EU in 2010 (%) (3)
Figure 5 presents the difference between the poverty rate before social transfers and the poverty rate after social transfers. The latest states that joined the EU in 2007 (Romania and Bulgaria) register the highest decrease in thepoverty rate after social transfers, 20.3%, respectively 20.9%. This highlights the fact that in these countries a significant number of people in poverty rely on social welfare as the main source of income. The countries that manage to decrease the poverty rate with more than 10 percent are Hungary (17.6%), Latvia (16.8%), Irish (13.8%) and Lithuania (13.2%).
Regarding the estimation for the EU27 we obtained the following equation:
RU = – 17,872 + 0,668*SPB — 0,222*RGDP(-1) + 0,504*LTAX
[-7,244]* [6,513]* [-6,241]* [8,476] **
Where between brackets are the t-Statistics values and *, ** stand for 1%, 5% significance.
At the EU level, the results obtained are consistent with the results expected in terms of theory, by using the panel datamethodology with fixed effects. They show that, for the analyzed period 2000-2010, the unemployment rate was in a direct relation with the evolution of social expenditure and with the level of the tax on labour in the European Union.
Thus, an increase in taxation by 1% leads to an increase in the unemployment rate by 0.5%, while an increase in social expenditure (social benefits) by 1% leads to an increase in the unemployment rate by 0.66%. This confirms the neoclassical hypothesis of the disadvantageous impact of a generous package of welfare measures regarding thepropensity to participate in the labour market. Furthermore, the evolution of the unemployment rate is in a negative relation with the GDP growth, as the results indicate that an increase in GDP by 1% leads to a 0.22% decrease in the unemployment rate with a year lag (delay). This correlation econometrically highlights Okun’s law — backward interpreted and with one lag delay.
In order to quantify the effects of GDP on unemployment, we chose a one-year lag because we believed that an increase in production and, hence, an increase in goods demand are transmitted on the labour force demand with delay due to the rigidities that characterize labour markets in most EU countries, both in terms of employment and redundancies.
For the EU17 group, we obtained the following econometric results:
RU = – 18,076 + 0,574*SPB — 0,179*RGDP(-1) + 0,528*LTAX
[-5,168]* [5,182]* [-4,132]* [6,151] **
Where between brackets are the t-Statistics values and *, ** stand for 1%, 5% significance.
For the euro area model the results show an upward change, meaning that the unemployment rate increased by 0.57% for a 1% increase in social benefits and by 0.52% for a 1% increase in the implicit tax rate on labour. This factemphasizes a more competitive environment on the labour markets in these countries. Also, the unemployment rate has decreased by 0.17% for the real GDP growth of 1% in the previous year, as in these countries the unemployment rate sensitivity is influenced by an expansion of the real GDP. Thus, the relation between unemployment and real GDP is more moderate among these countries, indicating that unemployment is less sensitive to an increase in macroeconomicoutcomes, having other causes, which largely explains the high level of this indicator for the old Member States of the EU. However, the average unemployment rate for the period 2000-2010 was at its lowest level compared to the other two blocks, thus suggesting that unemployment in the region is predominantly structural and less influenced by fluctuations in the economic cycle in absence of other complementary measures. Furthermore, social benefits had the highest share of GDP in the euro area, and had an average level of 14.5% for the specified period.
As for the EU10 group, the estimated equation has the following form:
RU = – 25,465 + 0,993*SPB — 0,194*RGDP(-1) + 0,691*LTAX
[-6,275]* [4,860]* [-3,507]** [7,691] **
Where between brackets are the t-Statistics values and *, ** stand for 1%, 5% significance.
By reducing the area of analysis to only 10 member states of the European Union in Central and Eastern Europe, the results comply with the economic theory, meaning that the unemployment evolution is negatively correlated with GDPdevelopment and positively correlated with social expenditure and the taxation level, but the intensity is different. ForEU10 the result was that an increase in social spending by 1% leads to an almost directly proportional growth of the unemployment rate (0.99%), while an increase of 1% in the implicit tax rate on labour leads to an increase by 0.69% in the unemployment rate. The correlations are normal and show a high level of social protection, but absolutely necessary to compensate for welfare losses borne by the population as a result of the transition shocks to the market economy.Similarly, the costs associated with the taxes for the use of the labour force support to a greater extent the dynamics of unemployment, indicating that the tax burden is more acutely felt by new businesses in the economic environment of transition.
This can be explained by the fact that these emerging economies are intensive in terms of the labour production factor, which makes them more sensitive to changes in variables that directly affect the participation of people on the labour market. Regarding the influence of the GDP evolution, the results show that a 1% increase in real GDP leads to a decrease in the unemployment rate by 0.19%, which is below the level reported for the whole block.
We applied the second model for both the EU27 and the EU10 groups in order to highlight the integration level of Central and Eastern European countries into the EU in terms of the living standards increase (poverty rate decrease).
Regarding the estimation for the EU27 we obtained the following equation:
RPOV = 37,859 -0,504*SPB — 0,198*RGDP (-1) – 0,225*REM
[12,905]* [-5,752]* [-3,297]** [-5,555] *
Where between brackets are the t-Statistics values and *, ** stand for 1%, 5% significance.
The results obtained are consistent with what was expected from a theoretical point of view, since all exogenousvariables (social benefits, real GDP growth rate and employment rate) help to reduce poverty rate (endogenous variable).Thus, the aggregated results for all the 27 European Union member states show that a one percentage point increase insocial benefits leads to a decrease in the poverty rate of 0.5%, and these, in fact, have the greatest impact on thepoverty rate. However, an increase in the real GDP by 1% leads to a decrease in the poverty rate by 0.19%. The contribution of the real GDP growth on reducing poverty rate appears to be modest, confirming that an economic growth which is not accompanied by measures of wealth redistribution cannot contribute to one of the major objectives ofeconomic development – poverty eradication. At the same time, an increase in the employment rate by 1% leads to a decrease in the poverty rate by 0.22%.
An explanation of the last two results can be the fact that more often than not, the GDP growth is not distributed across all social categories and the influence level of the employment growth is low because in the EU there are many peoplewho are still at risk of poverty although they have a job (in the EU, in 2010, 8% of the working population were at risk of poverty, according Eurostat).
For the EU10 group, we obtained the following econometric results:
RPOV = 54,965 – 1,364*SPB — 0,340*RGDP (-1) – 0,333*REM
[7,476]* [-7,336]* [-4,283]* [-3,286] **
Where between brackets are the t-Statistics values and *, ** stand for 1%, 5% significance.
If we reduce the analyzed group to only the 10 countries in the Central and Eastern Europe that joined the EU in 2004and 2007, it can be observed that in these countries there is a strong influence of the social expenditures (benefits), an increase of 1% of them leading to an over-unit decrease in the poverty rate. The result is absolutely normal because theeconomic shocks generated by the transition to a market economy aggravated the population poverty rate in these countries, requiring a series of active measures of social protection.
At the same time, as generally speaking, the countries involved are in a catching-up process, the influence of the othertwo variables is stronger than in the case of EU27. A GDP growth by one percentage point leads to a decrease in poverty rate of the population by 0.34% and an increase in the employment rate by one percent reduces the poverty rateby 0.33%. This demonstrates that along with the macroeconomic performance improvement, the poverty level also improved, and the fact that the employment rate has the lowest level of influence on reducing the poverty rate can be also due to the low level of wages in these countries compared to the EU average, which is insufficient to support a realimprovement to the living standards.
Conclusions
In the context of fiscal consolidation programs that dominate the politic and economic development of many countries in the European Union and under the need to reduce public debt, rethinking the social model is a stake of the economic and political programs of recovery from the crisis. We can already see that many states have already announced their intention to reform — to different degrees – the social benefits system or the labour market, as many have different problems in these areas, such as Portugal or Italy (Taxation trends in the European Union. Data for the EU Member States, Iceland and Norway, 2012).
According to the equation coefficients, there is a tendency towards reducing social benefits, as the unemployment rate is more sensitive to this variable in all the three groups of countries analyzed (EU27, EU10 and the euro area), especially in the Central and Eastern Europe countries, where the influence of the social benefits on the unemployment rate is almostdirectly proportional. Close to these results there are also those regarding the implicit tax rate on labour, in the case of which the coefficients were more than 0.5 for each group of countries.
Regarding the most useful tool to reduce the poverty rate, results showed that social benefits have the strongest influence both in the EU27 and the EU10 group, while the effects of a GDP or employment rate growth are lower. This can be explained by the fact that in many European countries economic growth (and that real Gross Domestic Product) is not distributed across all social categories, and the influence of the employment growth is low because in the EU there are many people with low incomes although they have a job.
In this respect, the EU should focus on developing the capacities and skills of individuals, which would ultimately lead to a higher degree of adaptability to rapid changes in the global economy, where new important actors appear, by expandingemerging countries growth and social phenomena, such as population ageing which will significantly affect labour marketchanges after the year 2035 according to the latest report of the European Commission (2012).
It is obvious that the current configuration of the social model cannot be sustained for a longer period of time and itsreforming involves rethinking the roles that both individuals and society play.
A rapid return to growth and well designed employment and education policies are crucial to reduce poverty and social exclusion. At the same time, efforts to restore sound public finances and reform social protection systems should both aim at ensuring their sustainability and adequacy. This will also help preserving their important role as automatic stabilizers. In doing so, Member States should aim at combining effectiveness, efficiency and fairness. The most vulnerable should be protected from bearing the brunt of the consolidation measures (Europe 2020 Strategy).
The success of the Europe 2020 Strategy depends on an integrated and coherent approach between all relevant policy areas in particular social, employment and economic policies as well as close cooperation between all levels of government, social partners and civil society. Linking EU funds to Europe 2020 priorities and supporting social innovation will enhance effectiveness.
The EU response to the current crisis is the creation of a more socially sustainable economy. Such an economy would be characterized by the relative independence of citizens’ livelihoods from capital accumulation and market-mediated exchange. The public sector, including public services, the welfare state and labour-market policy play an important role in re-embedding markets in a wider society. Hyman (2005) emphasized that the economy must be embedded in social relations and not social relations in the economy. Perhaps this is what most Europeans associate with the European Social Model.
Endnotes
(1). Taxation trends in the European Union. Data for the EU Member States, Iceland and Norway, Comisia Europeană, 2012
http://epp.eurostat.ec.europa.eu/cache/ITY_OFFPUB/KS-DU-12-001/EN/KS-DU-12-001-EN.PDF
(2). According to Eurostat social benefits (other than social transfers in kind) paid by the government are transfers to households, in cash or in kind, intended to relieve their financial pressure generated by a number of risks or needs (by convention: illness, disability, work accident or work disease, pensions, maternity, family, employment, unemployment, education, housing, educational and other general needs) achieved by government units through collective schemes, or outside such schemes.
(3). The indicator was calculated by the difference between the poverty rate before social transfers and the poverty rateafter social transfers.
References
Aiginger, K. (2010). Typologies of Social Models in Europe, WIFO.http://karl.aiginger.wifo.ac.at/fileadmin/files_aiginger/publications/2008/GEMSE_final.pdf
Publisher
Batić, J. (2011). “Crisis of the Welfare State in the European Union,” Megatrend Review, Vol. 8 (2).
Publisher
Bouget, D., Buchs, M., Guillen, A., Manning, N. & Vobruba, G. (2003). Researching the European Social Model from a Comparative Perspective, Economic & Social Research Council.
Publisher – Google Scholar
European Commission (1994). White Paper – ‘European Social Policy: A Way Forward for the Union,’ Luxembourg: Office for Official Publications of the EC.
Google Scholar
European Commission (2012). Annual Report on the European Community’s Development and External Assistance Policies and their Implementation in 2011.
Publisher
European Council (2002). ‘Presidency Conclusions. Lisbon European Council 23 and 24 March 2000,’ Brussels: European Council.
Google Scholar
Ferrera, M., Hemerijck, A. & Rhodes, M. (2001). “The Future of the European “Social Model” in the Global Economy,”Journal of Comparative Analysis: Research and Practice 3.
Publisher – Google Scholar
Golinowska, S., Hengstenberg, P. & Zukowski, M. (2009). Diversity and Commonality in European Social Policies: The Forging of a European Social Model, Warsaw; http://library.fes.de/pdf-files/bueros/warschau/06223.pdf
Publisher
Hyman, R., (2005). “Trade Unions and the Politics of the European Social Model,” Economic and Industrial Democracy,Vol. 26 No. 1.
Publisher – Google Scholar
Jepse, M. & Serrano Pascual, A., (2003). The European Social Model: An Exercise in Deconstruction, European Trade Union Institute; http://www.seeurope-network.org/homepages/seeurope/file_uploads/jep_serr_1003.pdf
Publisher
Magnusson,L. (2007). “The Swedish Labour Market Model in a Globalised World,” Friedrich Ebert Stiftung, Stockholmhttp://library.fes.de/pdf-files/bueros/stockholm/05005.pdf
Publisher
Shackleton, J. R. (2006). “Has the European Social Model a Future?,” World Economics Vol. 7, No. 3.http://relooney.fatcow.com/00_New_731.pdf
Publisher
Tausch, A. (2011). “The Efficiency and Effectiveness of Social Spending in the EU-27 and the OECD — A 2011 Reanalysis,” Corvinus University of Budapest, Innsbruck University, Department of Political Science. http://mpra.ub.uni-muenchen.de/33516/1/MPRA_paper_33516.pdf
Publisher
Walker, A. (2007). Globalisation and Welfare Reform East and West, University of Sheffield, UK.
Publisher – Google Scholar
*** http://ec.europa.eu/europe2020/index_en.htm
Publisher
*** http://epp.eurostat.ec.europa.eu/portal/page/portal/eurostat/home/
Publisher
***www.ifm.org
Publisher
***www.oecd.org
Publisher