Introduction
Fiscal policy decisions are made to impact and direct the evolution of the economic and business environment. In our current study, we will focus on changes in taxation, as part of the fiscal policy decisions, and their impact on the business environment. We will use business confidence indicators to quantify the effect of tax policy changes on different sectors of the economy: the industrial sector, the construction sector, the services sector and the retail sector.
The research aims to analyze the relationship between fiscal pressure and business confidence indices. We will analyze data from Japan and the USA and estimate regression models with the manufacturing business confidence indices as a dependent variable. The current study is structured in three main sections: a short literature review, a description of the research methodology that was employed and a presentation of the obtained results. These are followed by a summary of the research conclusions.
Literature Review
Fiscal policy decisions are reflected in changes in the tax burden and they lead to changes in the economic environment. Therefore, researchers have studied the tax burden for decades. As a result, there are numerous studies regarding the economic impact of fiscal policy decisions and ways of measuring the tax burden, such as Musgrave and Thin (1948); Atkinson (1980); Devarajan, Fullerton, and Musgrave (1980); Auerbach and Rosen (1980); Kiefer (1984); Atrostic and Nunns (1991); Metcalf (2006). The fiscal burden has remained in the limelight of debates and research studies as a means of evaluating the impact of different fiscal policy decisions on the social and business environment.
One way of analyzing the evolution of the economy is to use business confidence indicators. Business confidence has also been an issue of great interest amongst researchers. Jacobs (1988) and Quinn (1989) both studied business confidence models and class power. Darling (1955) published a study on measuring business confidence using the relationship between corporate dividends and earnings as a surrogate. The mentioned author also did a statistical analysis of the covariation between business confidence and stock market prices. The idea was not entirely new.
Taylor and McNabb (2007) studied whether indicators of consumer and business confidence can predict movements in GDP over the business cycle. They also analyzed the predictive power of business confidence and reached the conclusion that business confidence indicators play a significant role in predicting downturns. Hohnischa, Pittnauerc, Solomond and Stauffere (2005) proposed a stochastic model of interactive formation of individual expectations regarding the business climate in an industry, based on data from business climate surveys conducted in Germany since 1960.
Our research uses the previously mentioned studies as a starting point and aims to add and enhance the results presented by other researchers. We will present a new avenue of research and an original approach, using the most recently available data. The current research regarding Japan and the USA is a continuation of previous similar research done by the author using data for the OECD Eurozone Member States (Vintila & Tibulca, 2013).
Research Methodology
There are several types of indicators of business confidence that can be built based on the information obtained through business trends surveys. Instead of being used as responses to a single question, a set of variables can be combined into a single composite confidence indicator, expectations and summarizing economic evaluations on the overall economic situation. In our research, in order to quantify business confidence, we chose 4 different composite confidence indicators: the industrial confidence index (ICI), the construction confidence index (CCI), the retail confidence index (RCI) and the services confidence index (SCI). These composite indicators are considered useful for many countries and they are built by using similar calculation methodologies both by analysts of the European Commission and by the OECD. Japan and the USA use the OECD methodology to calculate and report a business confidence index similar to the ICI and it is called the manufacturing confidence indicator (MCI). This is the business confidence indicator used in the following regression estimations.
In order to reach some empirically grounded conclusions on the impact of fiscal policy decisions on the economy, we decided to use econometric analysis tools for the relationship between the level of taxation and the confidence indices in various sectors of the economy. The analysis included two of the largest economic powers of the world, Japan and the USA. The choice was also meant to include economies situated on different continents, but with well developed manufacturing sectors in their industry. The data used were extracted from the OECD online database.
The database includes information regarding the tax burden in each country, as well as the manufacturing business confidence indicator. In order to quantify the fiscal pressure, data were collected regarding the direct tax burden (DFP), the indirect tax pressure (IFP) and the tax burden of social security contributions (SSFP). The direct tax burden refers to the tax revenues collected from taxes on income, profits, assets and capital. The indirect tax burden includes tax revenues from taxes on production, sales and imports. The social security contribution tax burden refers to tax revenues from both contributions paid by employers and those paid by the employer. We also used data regarding the overall tax burden (TFP) calculated as total tax revenues as a percentage in the GDP. All of the variables are expressed as percentage from the GDP.
Business confidence in the manufacturing sector was quantified using MCI. The confidence indicator is calculated on a quarterly basis and was converted into annual data using a simple arithmetic average, on the basis of seasonal adjusted initial data. The variables regarding taxation (DFP, IFP and SSFP) were also presented annually. All the variables were finally calculated as relative growth from one year to the next, using the previous year as a basis. This also insures that the time series used in the econometric analysis are stationary. The selected time period is 1975 — 2012, the widest available data range for both countries.
The quantitative research is based on estimations of multiple regression models for each country, using the MCI as a dependent variable and the different types of fiscal pressure previously presented as independent variables. Initially, the estimations included one regression model for each country. Each model was subsequently adjusted in an attempt to reach an econometrically valid regression model for the MCI.
Research Results
In our analysis of the impact of the tax burden on business confidence in the manufacturing sector in Japan and in the USA, we estimated two regression models. The results are presented below.
Research Results for the USA
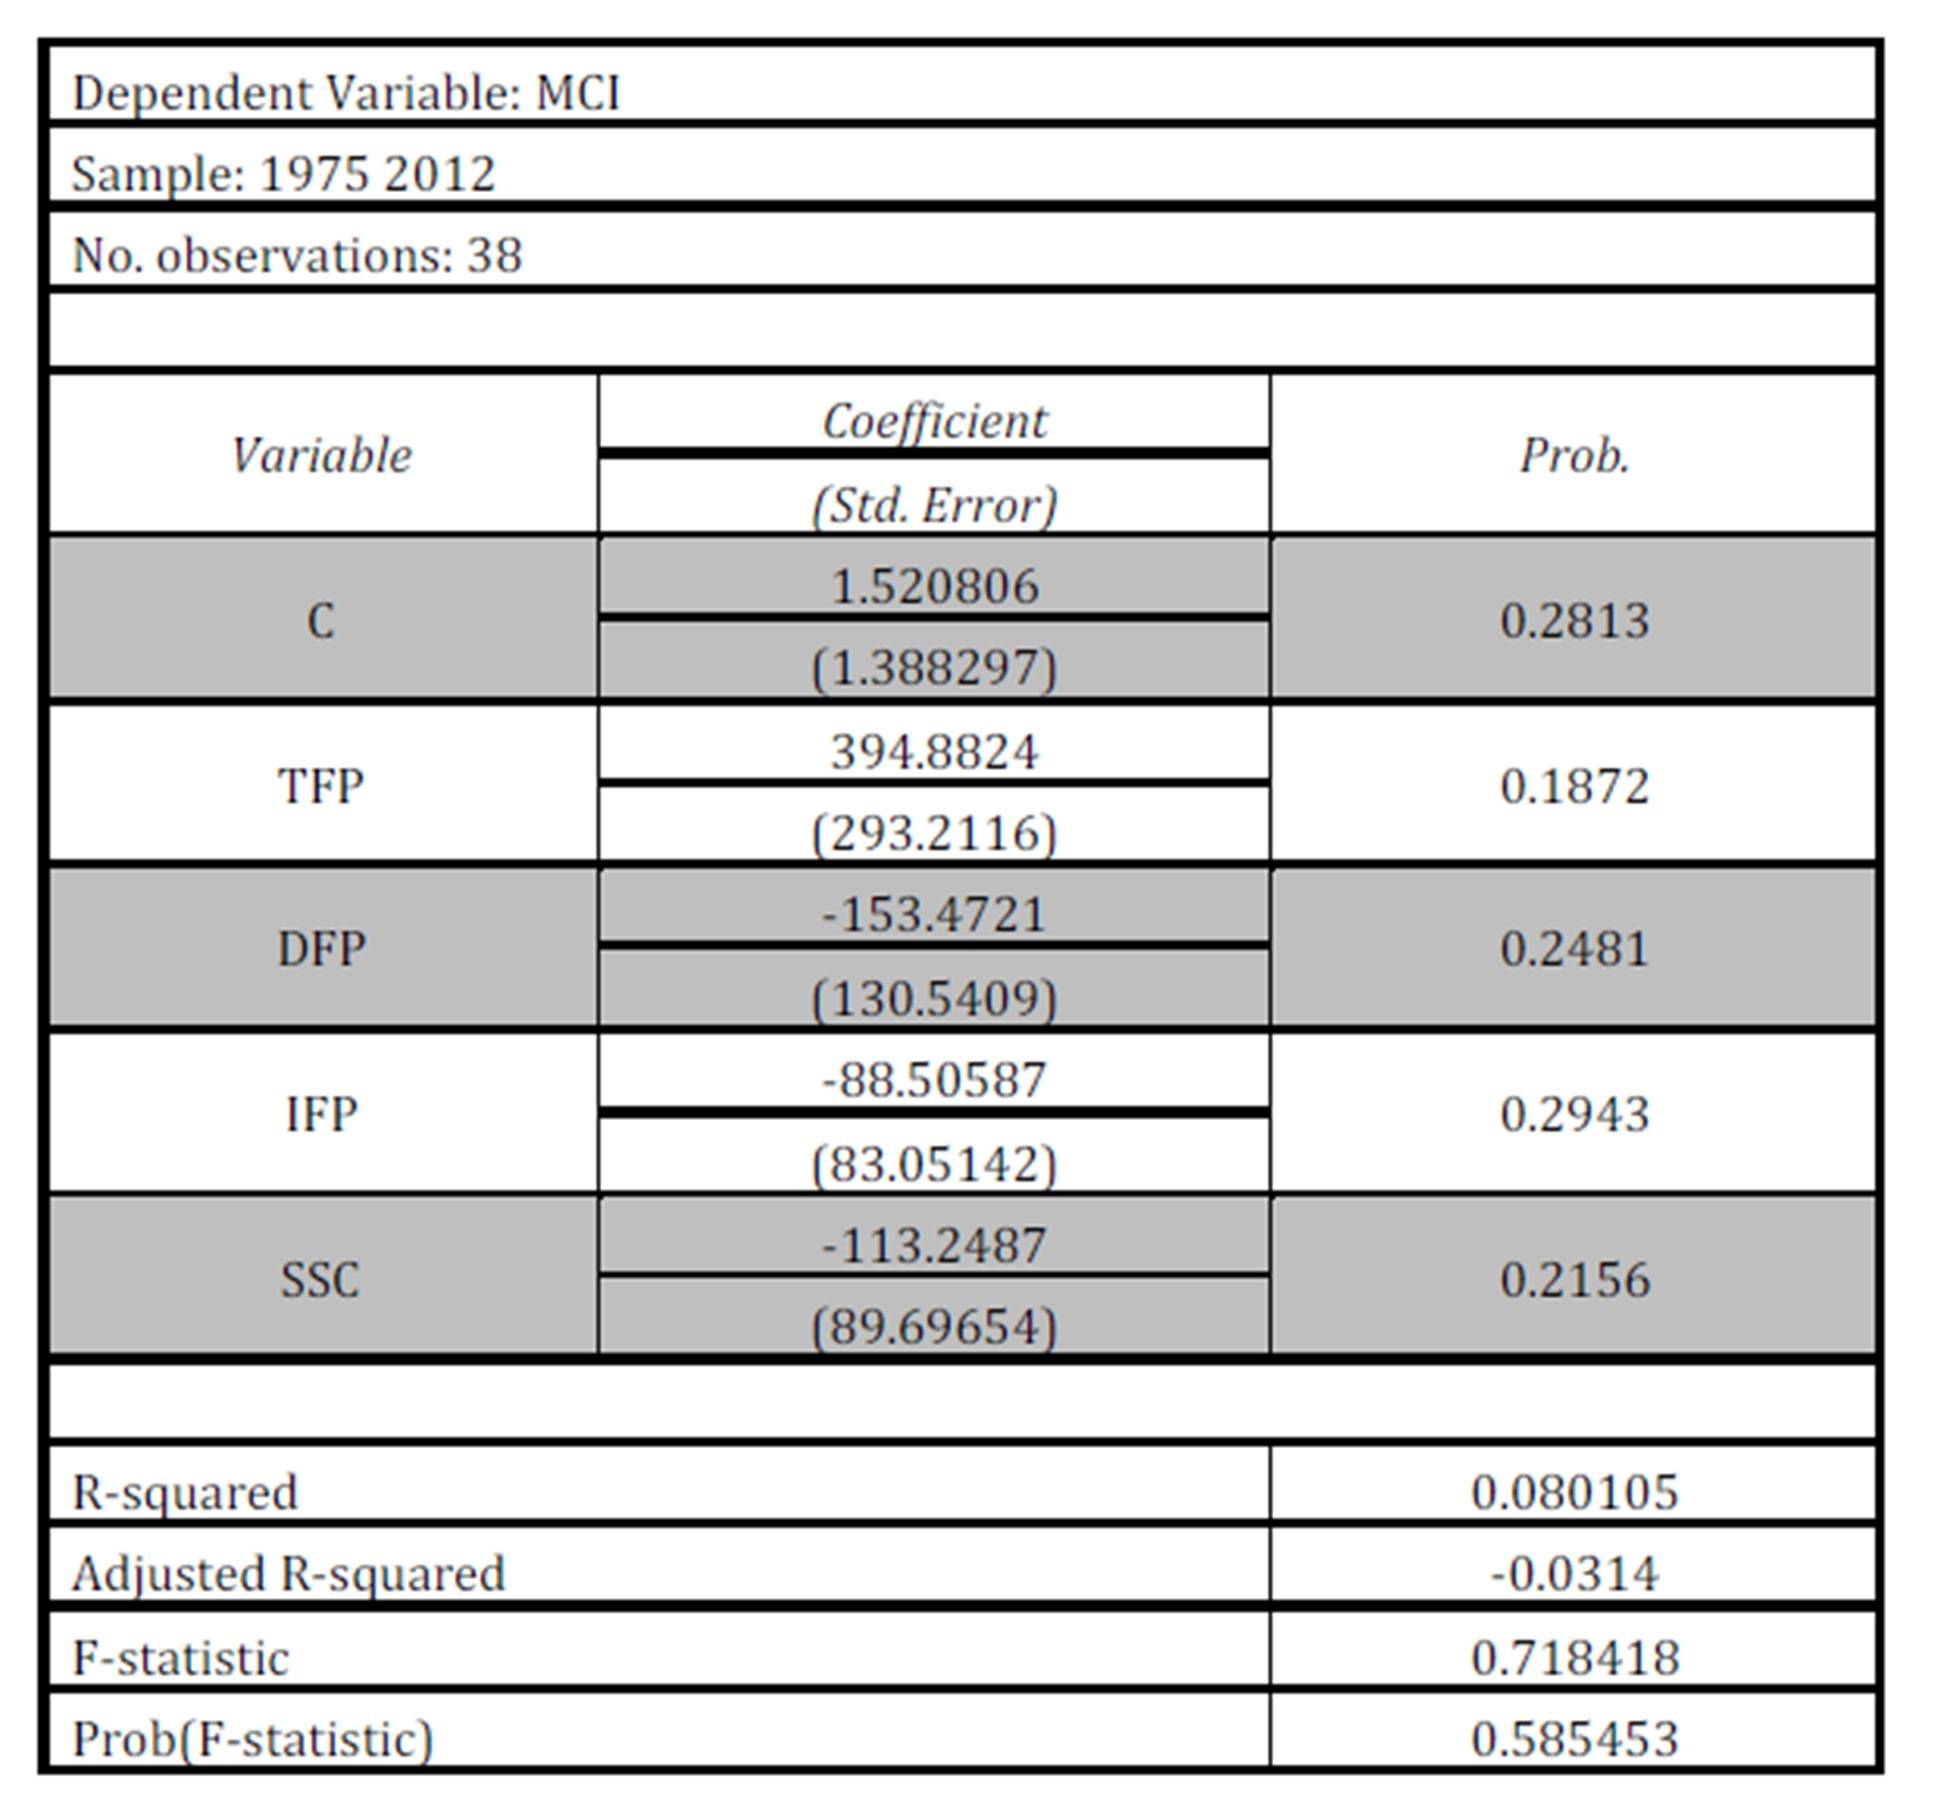
Table 1: Estimation results for the initial regression model for the USA
Source: own calculus
Using data collected from the OECD database for the USA, an initial regression model was estimated. The dependent variable is the MCI and there are 4 independent variables, all referring to fiscal pressure: TFP, DFP, IFP and SSC. The results of the estimation of the regression model are presented in Table no.1.
The regression model has a low value for R2, only 8%. This, together with the probability associated with the F-statistic test of 58% and the results for the significance tests for the estimated coefficients, suggest that the coefficients are not statistically significant and the regression model cannot be validated. Consequently, the model was adjusted by eliminating the overall tax burden (TFP) from the regression model. This was also done based on reasons related to data redundancy issues. The results for the estimation of the new regression model are presented in Table no.2.
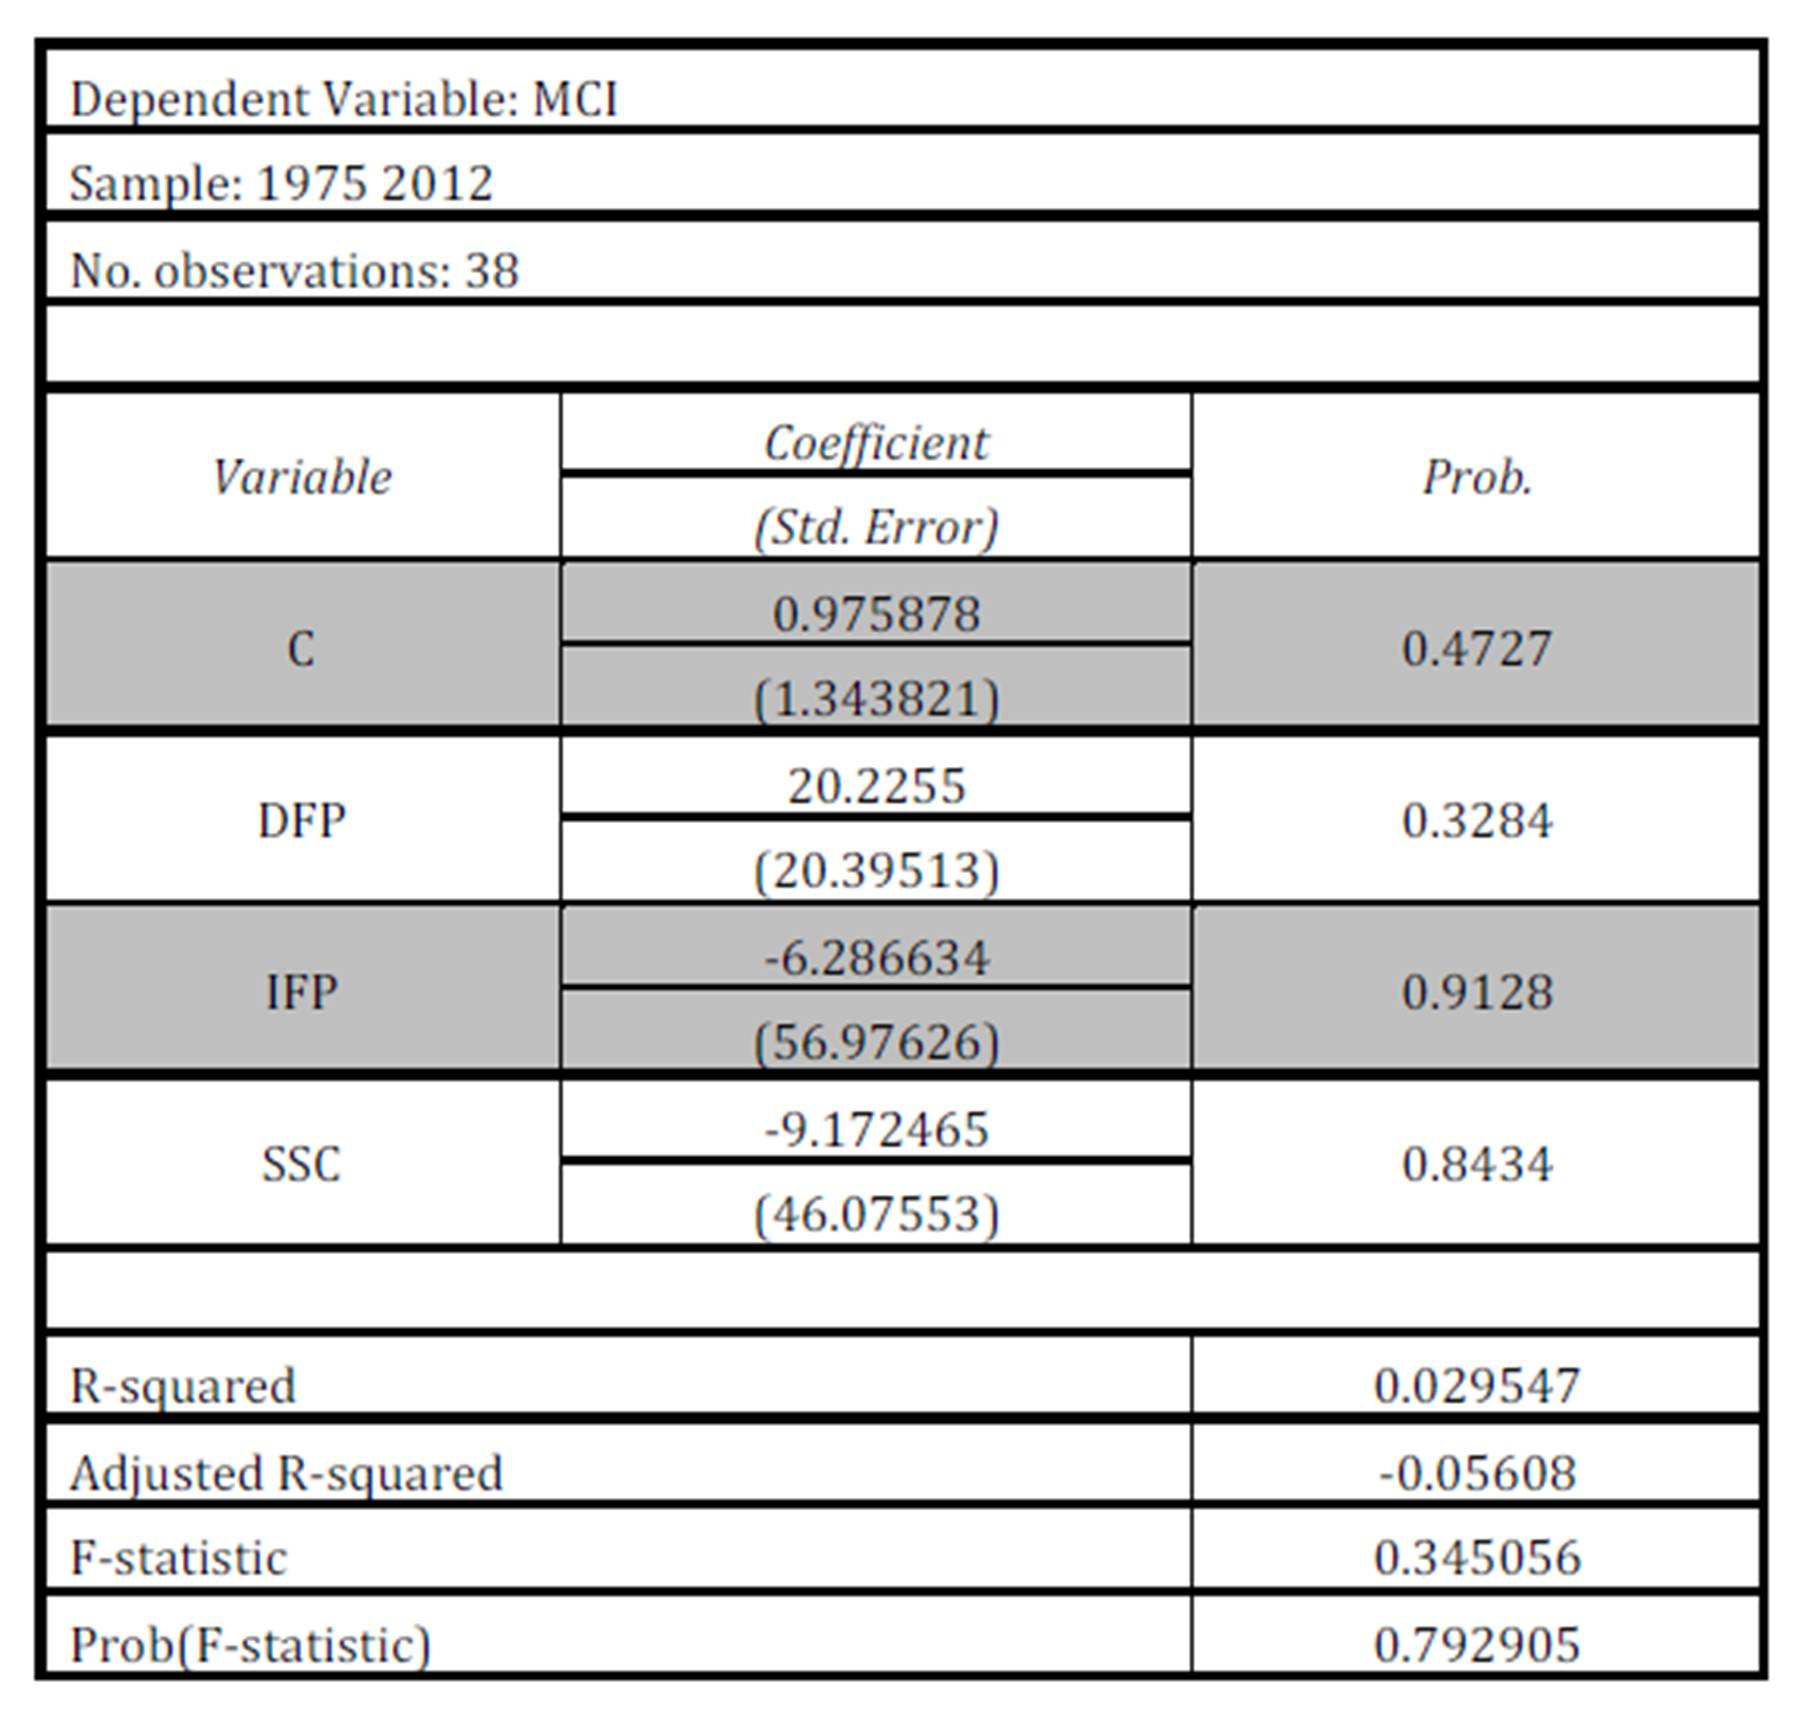
Table 2: Estimation results for the adjusted regression model for the USA
Source: own calculus
The estimation of the adjusted regression model leads to an even lower value for R2 (2.9%) than that of the initial model. Also, the probability associated to the F-statistic is now much higher, 79%, as well as the probabilities associated to the t-statistics for the estimated coefficients. Therefore, even after adjusting the regression model, the conclusion is still the same. The regression model for the USA cannot be validated.
Research Results for Japan
In order to reach empirically based conclusion regarding the impact of taxation on the manufacturing sector in Japan, we used data from the OECD database and estimated a regression model with the MCI as the dependent variable and the 4 different measures for the tax burden as independent variables (TFP, DFP, IFP and SSC). The results for the estimation of the initial regression model for Japan are available in Table no.3.
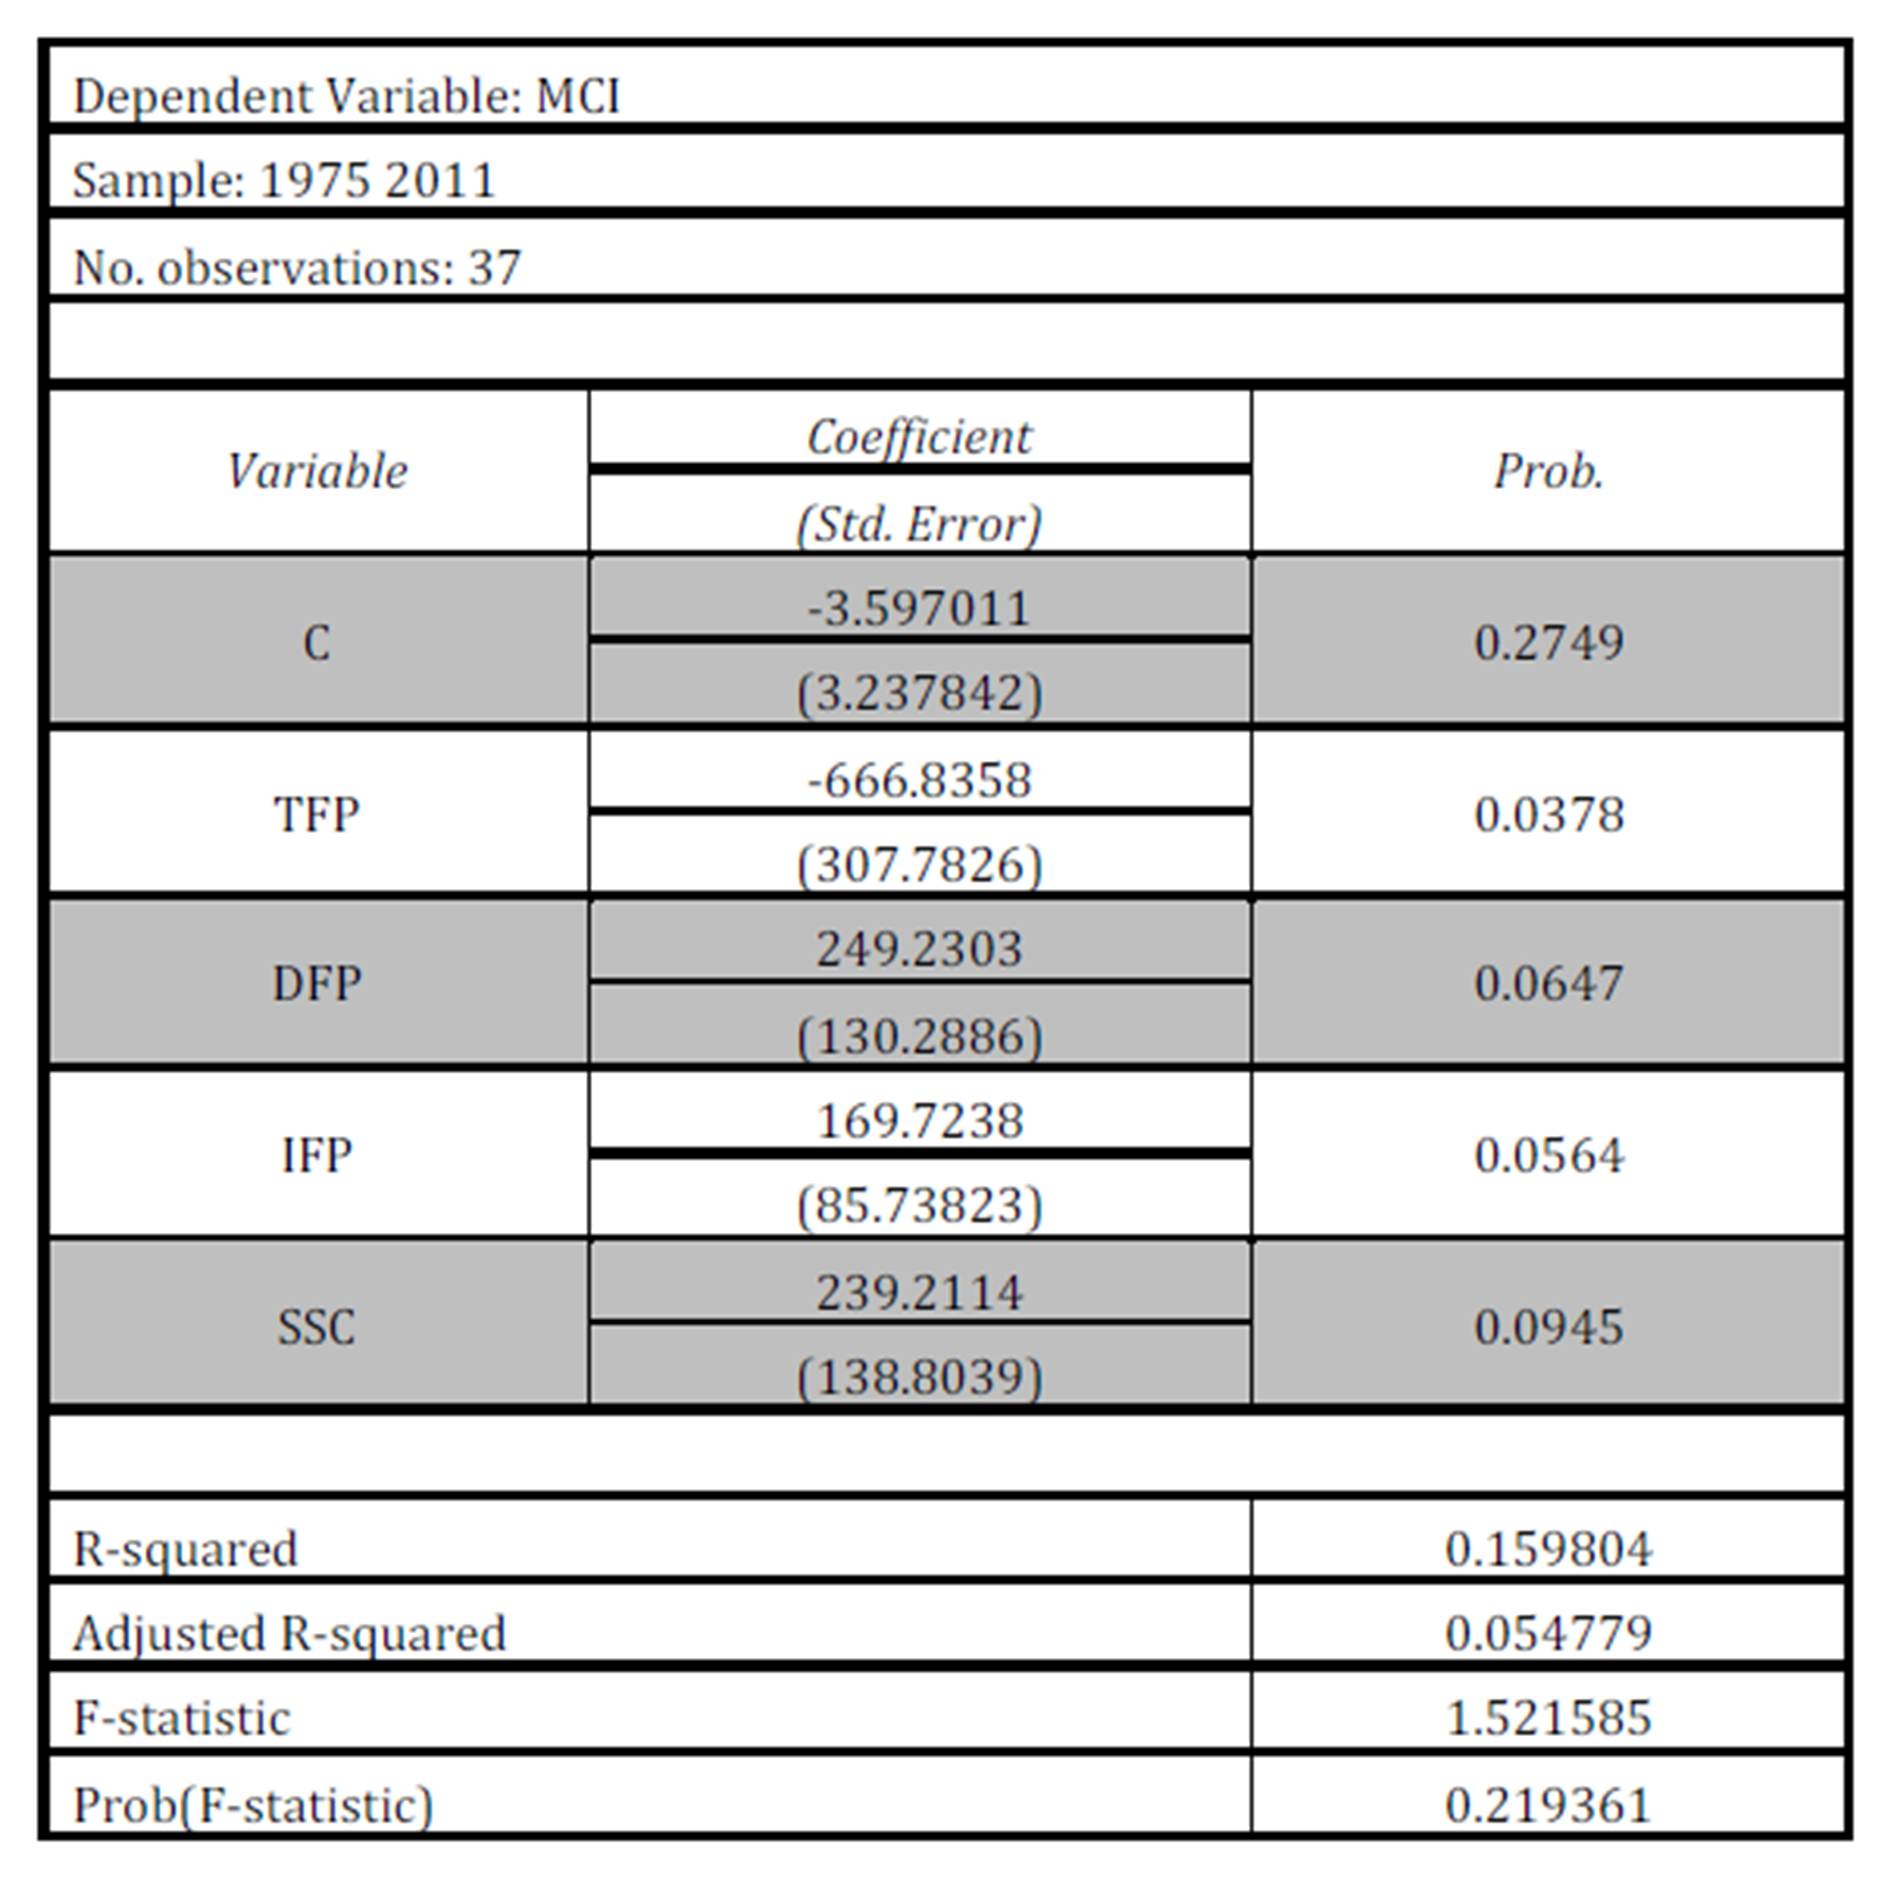
Table 3: Estimation results for the initial regression model for Japan
Source: own calculus
After the estimation of the initial regression model for Japan, we have obtained a 16% value for R2. Even if the value is not a very high one, the model can still be validated, if we consider the large number of factors that influence business confidence in the manufacturing sector. To be able to say that 16% of the evolution of the MCI is due to taxation is enough to consider the regression model valid. However, the value of the probability associated to the F-statistic is almost 20% and the estimated coefficients can only be considered statistically significant for a 10% level of the t-statistic probability. Therefore, we can only validate the regression model with some reservations. This is the main reason for adjusting the initial regression model for Japan by removing the overall tax burden (TFP) from the independent variables. The results of the new estimation are presented in Table no.4.
As Table no.4 shows, the adjustment made to the initial regression model for Japan did not help. On the contrary, the new regression model cannot be validated because the estimated coefficients are no longer statistically significant, the probability associated to the F-statistic is 74% and the value for R2 is very low, only 3%.
Table 4: Estimation results for the adjusted regression model for Japan
Source: own calculus
Conclusions
The purpose of our research was to quantify and explain the impact that fiscal policy changes have on the manufacturing sector. Consequently, we tried to illustrate the effect of the tax burden on business confidence in the manufacturing sector using data provided by the OECD. To increase the economic relevance of our research, we selected two countries with developed manufacturing sectors and solid market economies, Japan and the USA.
The initial regression model estimated for Japan could be validated in spite of the fact that R2 is only 15%. Given the large number of factors that influence business confidence in the manufacturing sector, we believe that it is enough to say that almost 15% of the evolution of business confidence in the manufacturing sector is due to the impact of taxation. The impact of the different types of tax burden on business confidence in Japan is much more pronounced than in European countries, as presented in previous research (Vintila & Tibulca, 2013). The estimated coefficients are much larger than in the case of OECD Eurozone Member States and, therefore, even the slightest change in taxation level would impact business confidence significantly.
The same conclusion seems to be true for the USA as well. However, it is more difficult to say that the initial model for the USA can be considered a valid one. R2 is lower that 10%, but that is not the only issue. The probabilities associated with t-statistic suggest that the estimated coefficients might not be statistically significant. Therefore, we cannot reach any valid conclusions for the data available for the USA.
All in all, it is difficult to consider any of the estimated regression models valid without any reserves. Consequently, we can conclude that the influence of taxation on the business confidence in the manufacturing sector in Japan and the USA is probably not a linear one, as shown by our research results.
Acknowledgment
This work was co financed from the European Social Fund through Sectoral Operational Programme Human Resources Development 2007-2013, project number POSDRU/159/1.5/S/142115 „Performance and excellence in doctoral and postdoctoral research in Romanian economics science domain”.
References
1. Atkinson,A.B. (1980) ‘Horizontal Equity and the Distribution of the Tax Burden’, in: Aaron, H. and Boskin, M. (ed.), The Economics of Taxation, Washington, D.C. Brookings
2. Atrostic,B.K. and Nunns,J.R. (1991) ‘Measuring Tax Burden: A Historical Perspective,’ Fifty Years of Economic Measurement: The Jubilee of the Conference on Research in Income and Wealth, University of Chicago Press, 343 — 420
Google Scholar
3. Auerbach,A.J. and Rosen,H.S. (1980) ‘Will the Real Excess Burden Please Stand Up?,’ NBER Working Paper no.495
Google Scholar
4. Darling,P.G. (1955) ‘A Surrogative Measure of Business Confidence and Its Relation to Stock Prices,’ The Journal of Finance, 10, 442—458
Publisher – Google Scholar
5. Devarajan,S., Fullerton,D. and Musgrave,R.A. (1980) ‘Estimating the Distribution of Tax Burdens,’ Journal of Public Economics, 13, 155-82
Google Scholar
6. Heye,C. (1993) ‘Labour Market Tightness and Business Confidence: An International Comparison,’ Politics & Society, 21, 169-193
Publisher – Google Scholar
7. Hohnischa,M. Pittnauerc,S. Solomond,S. and Stauffere,D. (2005) ‘Socioeconomic interaction and swings in business confidence indicators,’ Physica A: Statistical Mechanics and its Applications, 345(3—4), 646—656
Google Scholar
8. Jacobs,D. (1988) ‘Corporate Economic Power and the State: A Longitudinal Assessment of Two Explanations,’American Journal of Sociology, 93(4), 852-881
Publisher – Google Scholar
9. Kiefer,D.W. (1984) ‘Distributional Tax Progressivity Indexes,’ National Tax Journal, 37(4), 497-513
10. Metcalf,G.E. (2006) ‘Tax Incidence,’ Discussion Papers Series, Department of Economics, Tufts University, [Online] http://ase.tufts.edu/econ/papers/200607.pdf
11. Musgrave,R.A. and Thin,I. (1948) ‘Income Tax Progression, 1929-1948,’ Journal of Political Economy, 56498-514
12. OECD (2003) ‘Business Tendency Surveys: A Handbook,’ Statistics Directorate, Paris
Google Scholar
13. OECD (2006) ‘Introducing OECD Standardised Business and Consumer Confidence Indicators and Zone Aggregates,’ Main Economic Indicators
14. Quinn,D.P. (1989) ‘Corporate Taxation and Corporate Economic Power: Testing Class-Power and Business-Confidence Models,’ American Journal of Sociology, 94 (6), 1419-1426
Publisher – Google Scholar
15. Taylor,K. and McNabb,R. (2007) ‘Business Cycles and the Role of Confidence: Evidence for Europe,’ Oxford Bulletin of Economics and Statistics, 69, 185—208
Publisher – Google Scholar
16. Vintilă,G. and Ţibulcă,I.L. (2013) ‘The Impact of Tax Pressure on Companies’ Performance Case Study: OECD Europe Zone,’ Romanian Statistical Review Supplement, 61(2), 35-41
Google Scholar