Introduction
Tourism provides all around the world a lot of opportunities for sustainable economic development. For some regions, the tourism is the only way to recover the economy and to accelerate the modernization of the infrastructure. In this paper, the figures cover several fields of the tourism in the European area, with a special look on Romania, as part of the EU, and also data on the enterprises in the tourism sector and the tourism expenditures.
In this regard, the adoption of the Regulation (EU) No 1051/2011, implementing Regulation (EU) No 692/2011 of the European Parliament and of the Council concerning European statistics on tourism, as regards the structure of the quality reports and the transmission of the data, was an important step toward a common system for tourism database in the European Union. By its specialization and creativity, the tourism creates more added values by employing complementary products and by developing specific markets between the different sectors. By this study, we aim to give an insight into the European tourism and in the manner in which the tourists have chosen to spend their stays. The services sector in every modern country has to be considering a promising one. In particularity in the Romanian tourism, the holiday destinations continue to face important changes because of the tourist’s preferences. In these terms, there are the economic and social challenges that have to be fit on the tourism development and build up cooperation between countries. Overall, we could point out that now the tourism sector has overcome the financial crisis, even if this was done with a significant decline in the number of tourists, with a reshape of the tourist profile and of the tourism destinations. However, using quarterly data on the number of nights spent in some tourist accommodations in Romania, we have performed an analysis of the seasonality and the forecast for the next two years. Because the reporting data was not done every year for all European countries, we have chosen to do this analyse for 6 countries. Besides Romania, we have chosen to analyse the seasonality for countries that have tradition in tourism and cover, as leisure possibilities, all forms of relief.
These countries are Bulgaria, Germany, Italy, Austria and United Kingdom. By doing an overview on the literature concerning the tourism’ sector, we have found some evidences in line with the subject. Thus, based on general approaches, the authors, Fintineru A., Fintineru G. and Smedescu D.I. (2014), stated that “tourism is an important driver of global economic system, playing a leading role both in the economic life and social action.” In addition to this idea, it was another approach that has been made by Wenshin C. and Bennett D. (2010), who noted in their study that it has „to draw attention to the significance of commonly overlooked social and political factors in the ICT research area and in turn to help IT managers to overcome those factors, so that, smoother ICT implementation and wireless network deployment process can be achieved.” One immediate issue associated, stated by Kima D.Y.,Lehtob X.Y., Morrison A.M. (2007), was to take into consideration that „The revolutionary development of information technology has dramatically changed society and people’s everyday lives, including the way travellers search for information and plan trips.” Based on a different study, Cheung R. and Lam P. (2009) said that „Traditionally, the travel industry focused on the travel agency sales channel” but meanwhile „Traditional travel agencies appear to be losing the battle against its online counterpart and the airlines”. With more empirical approaches, the authors Despa R., Huidumac C., Dumitru N.R. and Negricea C. (2010) made a research where they paid increasing attention to the tourist activity which „is considered to be independent and in particular the tourist movement is reflected by the evolution of two indicators: the number of tourists’ arrivals and the number of nights spent in the hotel, these having a significant impact on the efficiency.”Also, speaking about forecast in tourism demand, Claveria O. and Torra S. (2014) have shown that “Tourism data is characterised by strong seasonal patterns and volatility, thus the original series requires significant pre-processing in order to be used with forecasting purposes.” More specifically, Song H., Kim J.H. and Yang S. (2009) stated that „when the price of a tourism product changes, tourists’ real income also changes.
In addition, the price of the product in question, relative to the alternatives, also changes”. There was also another approach made by Guizzardi A. and Mazzocchi M. (2010) who noted that „while major business cycle fluctuations strongly influence consumer demand for goods and services, such as in times of economic recession and boom, the response of tourism demand is not necessarily immediate and straightforward because of substitution effects between types of destinations and lags between decision making and the actual holiday”.
Regarding the tourism more empirically, the authors Hairan S. and Gang L. (2008), have found that „The current review provides a full account of all methods used in tourism demand modelling and forecasting… and the main objective is, therefore, to investigate whether there are any new trends or issues emerging recently in the tourism forecasting literature and to suggest new directions for future research…”. In Romania, the tourism sector approaches a bit more than 2% of GDP (a little higher in 2013), which is still below the world and European average of 5.2 %. Regarding the number of employees in tourism, Romania has 2.3 % of the total number of employees and is again below the world average which is about 13%. Speaking about the number of tourists who spent their holidays in our country, the number of residents and non-residents this has declined after 2007, but has begun to increase in 2009. In the EU-27 is estimated that approximately 51.9 % of the population have participated to the tourism. Instead, there are indeed some major differences among the member states; for example, in Bulgaria, where this rate was 6.4% of the total population and on the opposite side, Cyprus with 90.3%. Among the holiday destinations in Europe, there are favourite countries like Spain and less favourite like Luxembourg, Lithuania and Latvia (source: http://epp.eurostat.ec).
Materials and Methods
The analysis in this paper was based on the following indicators: number of trips ranking by several criteria, nights spent in the Romanian accommodation establishments, by country of residence of the tourists, tourists’ expenditures divided by criteria and participation in tourism for personal purposes by age group. Thus, we could analyse the dynamics of the above mentioned indicators and their contextual interpretations. For the quarterly time series «total nights spent by residents and non-residents» in “Hotels; holiday and other short-stay accommodation; camping grounds, recreational vehicle parks and trailer parks”, we have focused on the analysis of the seasonality. It was also a forecast for the next two years, in quarterly time series. Concerning the database, because the quarterly data for the analysis was not complete for all European countries and for the entire period, we ultimately chosen to do the study of seasonality for 6 countries, including Romania. The analysis of the seasonality was computed by the additive and the multiplicative methods. The results were presented as average of gross seasonal deviations, corrected seasonal changes and changes due to the corrected seasonality. Also, within the analysis it was a breaking between categories “residents” and “non-residents”. In the last stage of the paper, it has been presented a quarterly forecasting (2014 and 2015years) of some data sets, based on the linear method. The database sources are Eurostat (www.eurostat.eu ) and National Institute of Statistics of Bucharest, Romania (www.insse.ro. On-line tempo series).
Results and Discussions
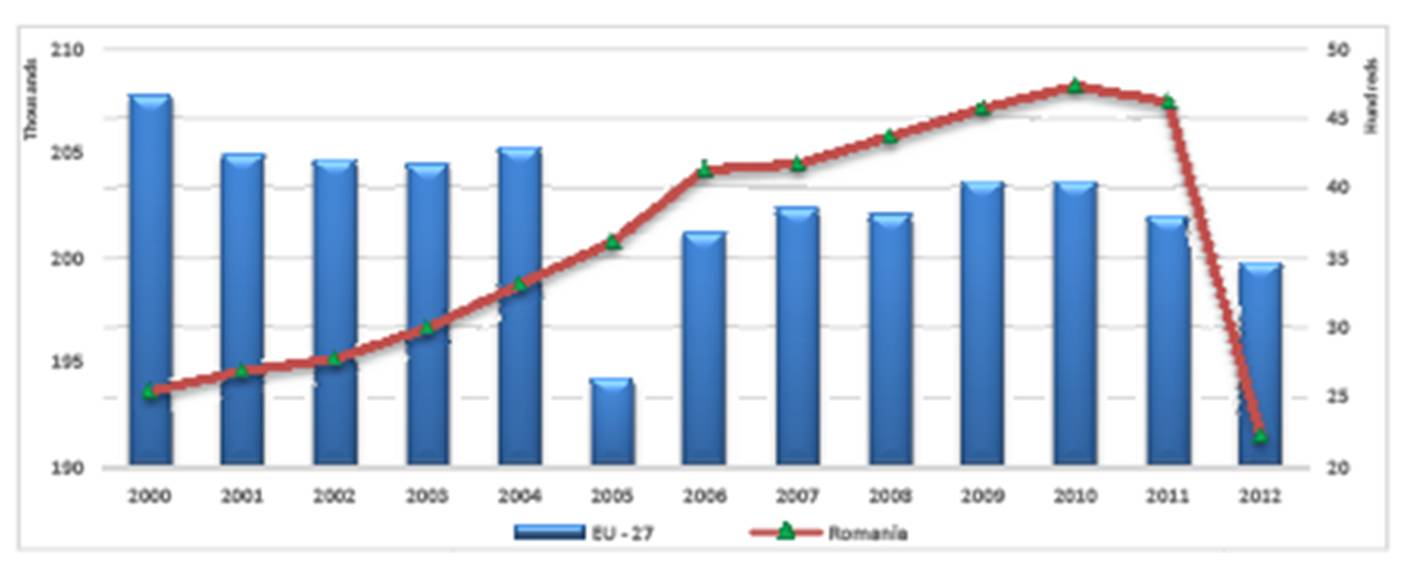
In this section of the paper we approached the results of the dynamics on the number of hotels and similar accommodation establishments in Romania and the European Union in the 2000-2012 period. Thus, in the figure below it was showed a fluctuated, but increasing trend for Romania till 2009. In addition, we mention here that, during the same period, the average number of bed-places/bedroom in hotels and similar accommodation is quite balanced in the two areas (Romania and the EU) it was within the range 1.97 — 2.07, on both areas and it was at a comparable level on the respective years. Source: Eurostat site, extracted on 25.03.14

Fig1: Hotels and similar accommodation, Number of establishements
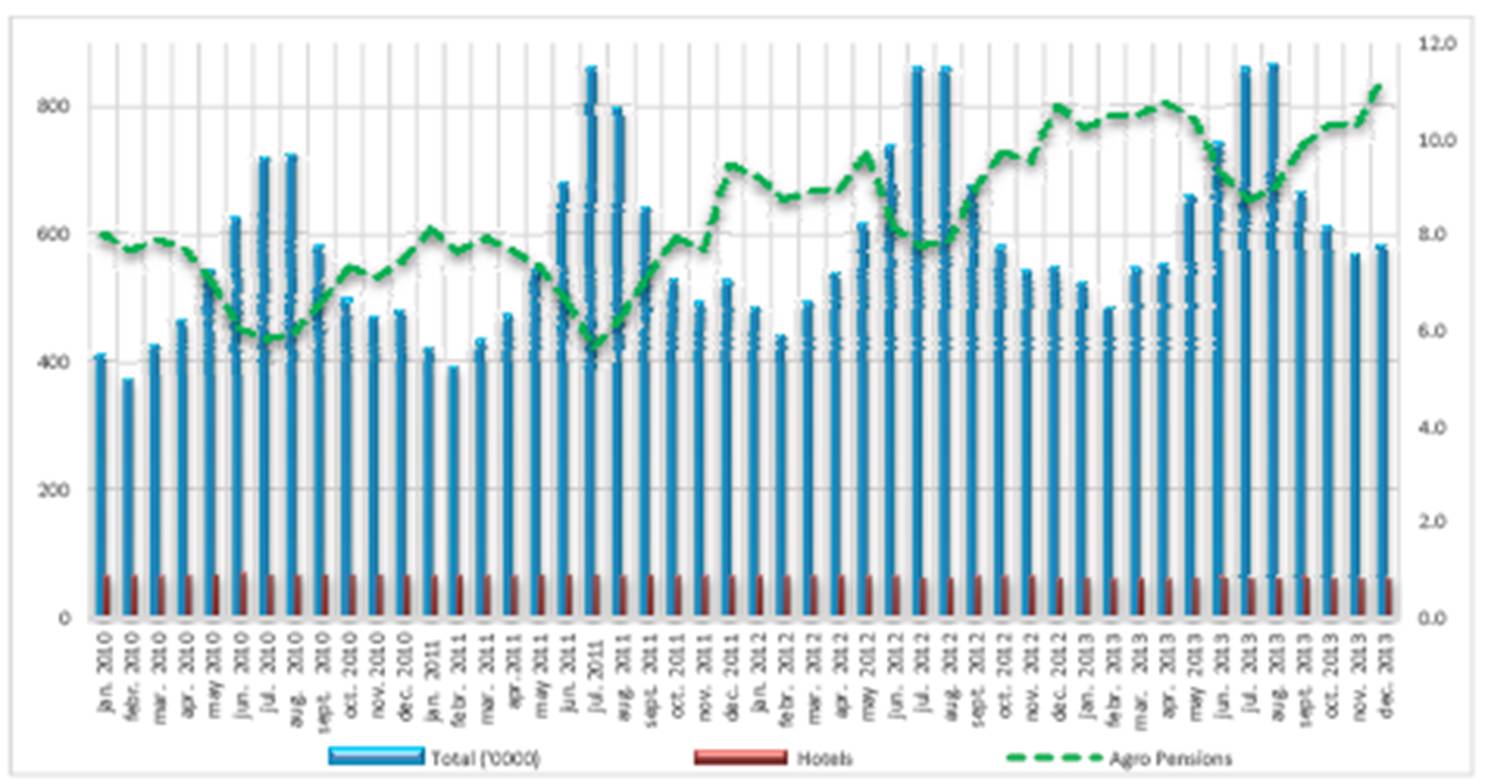
In the figure below it was presented during the 2010-2013 period, the dynamics of the monthly tourist accommodation capacity, in total, in hotels and in agro pensions. In this representation it can be seen that the total monthly tourist accommodation capacity followed the Romania’s holydays seasons; the hotel’s accomodation capacity didn’t changed very much during the 2010 -2013. The changes can be seen in the accomodation capacity of the agro-pensions; thus, there were some periods when this capacity increased in the same time when the total capacity decrease. According to this chart, we appreciated that the maximum accomodation capacity was reached in July and August and the minimum level was in November and February of each year. Source: N.I.S. Bucharest, 2014
Fig2: The monthly tourist accommodation capacity, Total and Agro pensions
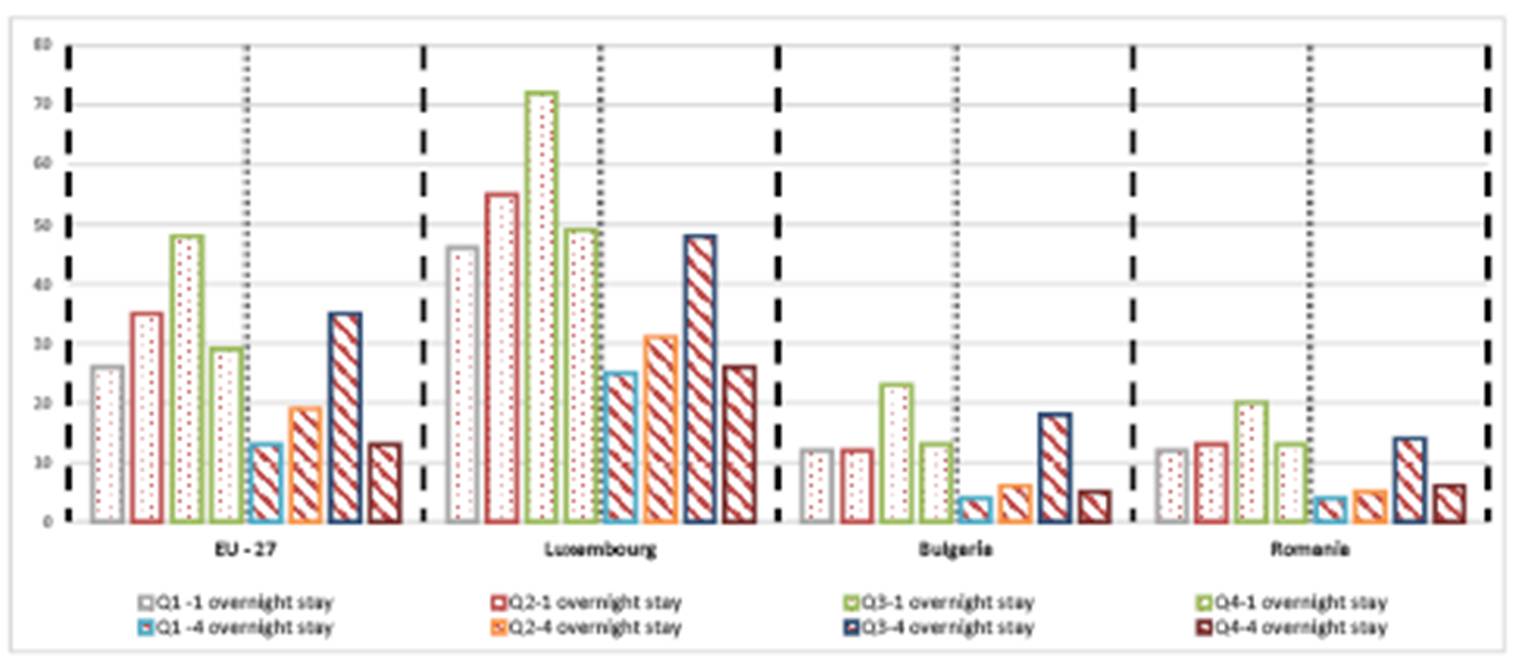
Next, as for the share of the resident population having made in 2012, at least one holiday trip of at least one overnight stays (in percentage) and, at least 4 overnights stays, we have presented in the figure below (Figure 3)the appropriate picture for quarterly data from the EU-27, Luxembourg, Bulgaria and Romania. Source: Eurostat, extracted on 25.03.2014
Fig3: Share of the resident population having made at least one holiday, 2012 (%)
Thus, in the above figure it can be seen that Romania had less than a half of the EU average data reported in all categories presented in the figure. With the similar figures as Romania, Bulgaria joins the range of our country on all quarters and types of trips. On the opposite side of this ranking, with the largest weights compared to the EU average, is Luxembourg, with almost twice the EU-27average values. For all countries analysed in the figure above, it seems that population had more holydays of 1 overnight stay than holydays of 4 overnights stays. Meanwhile, the holydays have been spent first, in the third quarter and then, in the second quarter.
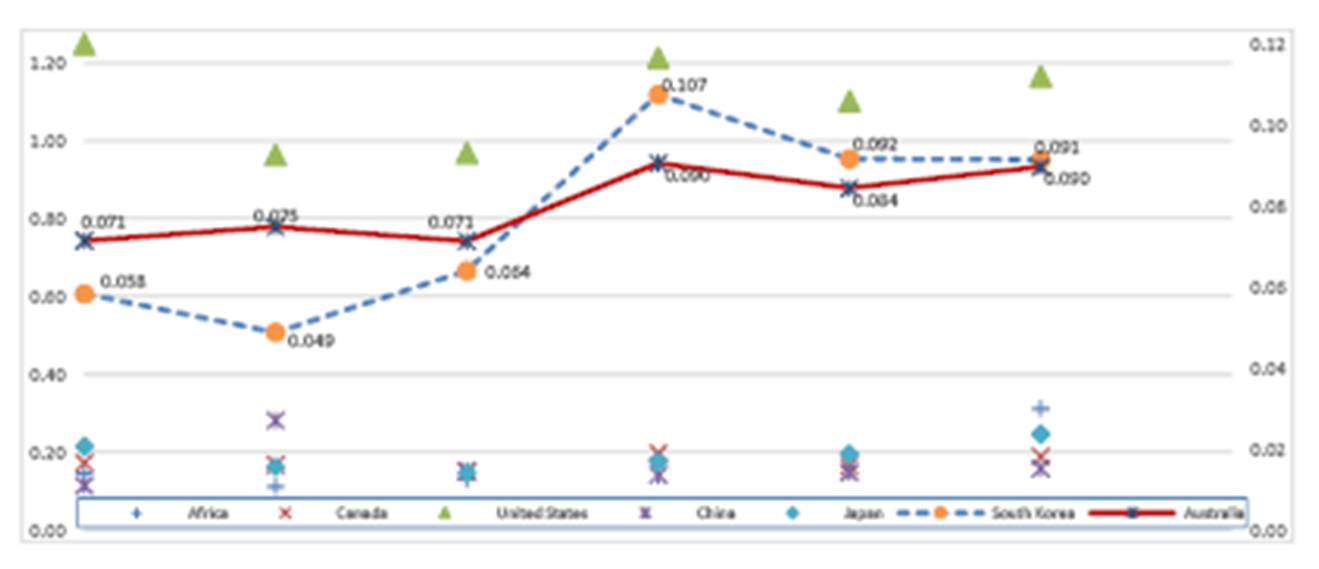
In the next part of the paper, we have taken into consideration the number of the nights spent in the Romanian tourist accommodation establishments by country of residence of the tourists. Seven countries worldwide have been taken into consideration during the 2007-2012 time period. In the figure, there were some evidences that we have noted here. The tourists coming to Romania, from the United States dominates the presentation. Thus, although the number of tourists fluctuated, the highest level was recorded in 2007 and has decreased continuously until 2009. However, after this year, the number of nights spent in Romania started to grow and stabilized. The lowest number was recorded for the visitors coming from Australia.
Fig4: Share of the total Nights spent in Romanian tourist accommodation establishments by world regions of residence of the tourists, 2007-2012
In the following part of the paper, we approached the dynamics of indicators – number of trips by region of destination and by purpose of the trip, in 2012. The figure below presents the total number of the trips for the Romanian tourists in the European countries, as world region of destination for the trips. The information was also breaking down in two trip purposes (personal and professional) and in number of nights. Source: Extracted on 25.03.14 from the Eurostat site.
Fig5: Number of trips by trip purpose and number of nights, Romanian tourists, 2012
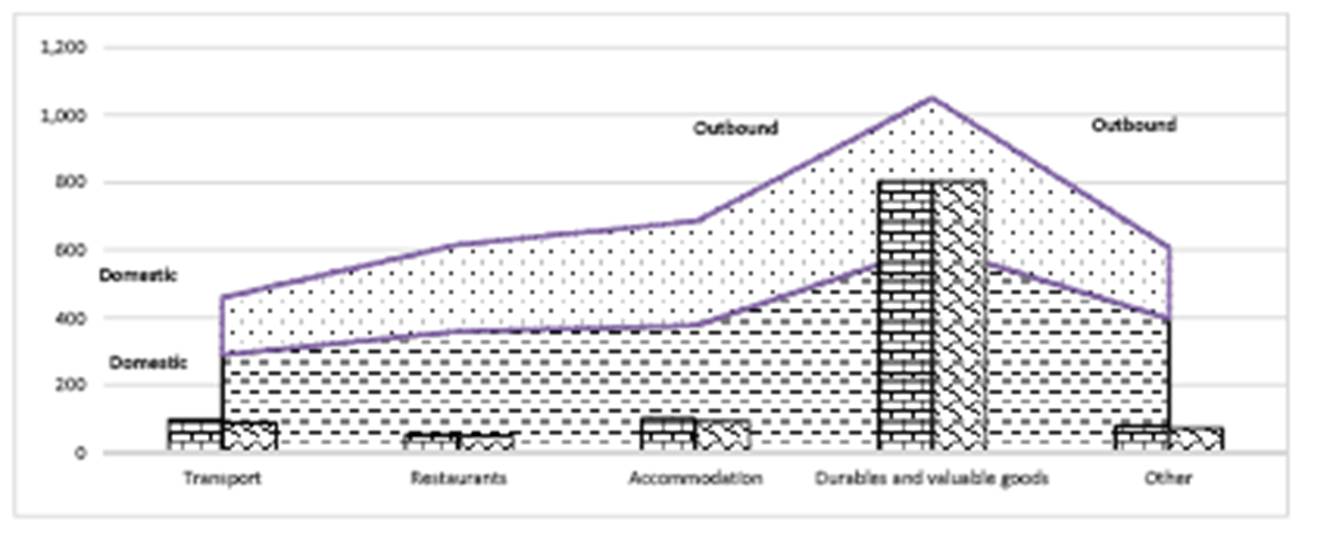
The figure 5 indicates that the Romanian tourists engaged an important number of trips, by personal purpose, compared with the trips by professional purpose. By the length of stay, personal purpose, it has been shown that, more trips are short, the higher is their number. In the case of the number of trips by professional purpose and by number of the nights spent in the accommodation establishments, it seems that for one night or 4 nights spent, the tourists made almost the same number of trips. A very low level was registered for the professional trips of 1 to 3 nights of stay. Studying the data series – number of trips and the nights spent by the tourists, we take now into consideration the level of the expenditure by categories and by the number of nights stayed in the Romanian tourist accommodation establishments. The five categories of expenditure recorded in the Eurostat database are: expenditure on transport, expenditure on restaurants, expenditure on accommodation, expenditure on durables and valuables goods and other expenditures. In that sense, the figure below (Fig. 6) resumes the appropriate data, ranked by domestic and outbound categories. Source: Eurostat database, extracted on 25. 03.2014
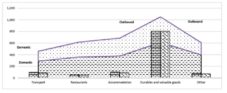
Fig6: Average expenditure per trip, by expenditure categories and by number of nights, Romania, euro, 2012
In the above figure is indicated that the Romanian tourists pay the most for the durables and valuable goods, among the five categories of expenditures. The less they pay for expenses in restaurants. Average costs for travel and accommodation are comparable whether it is a journey of one night or 4 nights. The major differences are occurring between domestic travel and outbound, these latter being more expensive than the domestic for the Romanian tourists. Thus, basically, it appears that there are no major differences between the various categories of expenditure, whether it is one night or 4 nights’ trips.
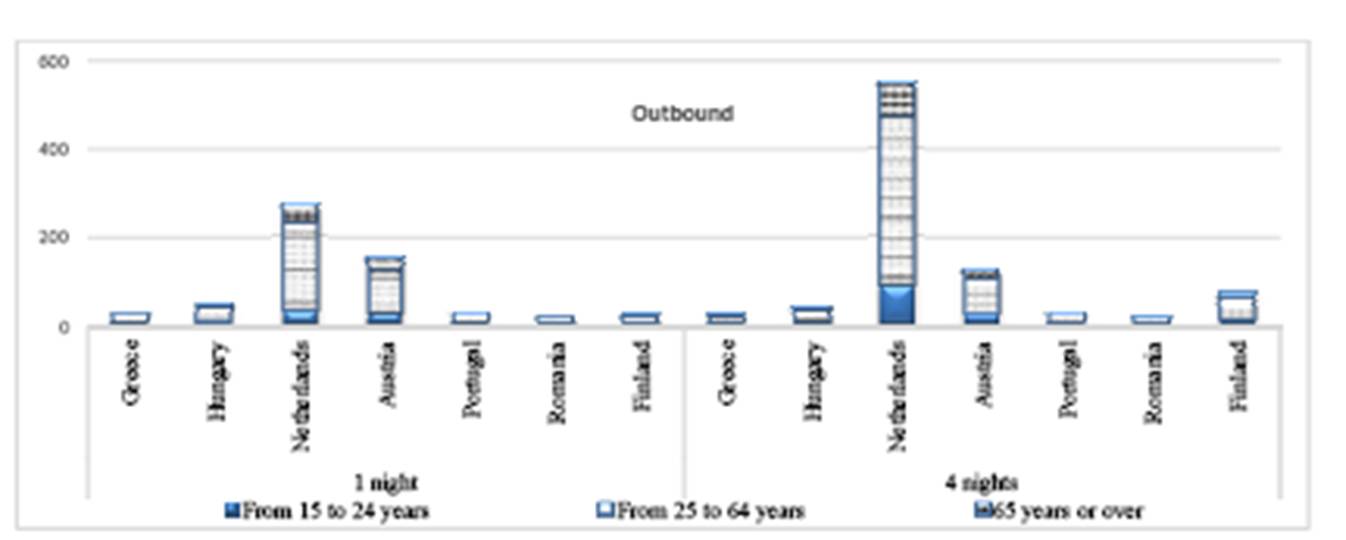
In the following part, we have presented in graphical form the share of participation in tourism for personal purposes by age group, for the domestic and outbound touristic space, in 2012. We have focused in this analysis only on the countries that had available data in Eurostat’s database. The two next figures (Fig. 7 and Fig. 8) contain information regarding domestic and outbound tourism, for one night and 4 nights’ trips.
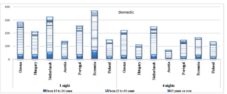
Fig7: Participation in tourism for personal purposes by age group, 2012, 1 night and 4 nights, domestic tourism
Fig8: Participation in tourism for personal purposes by age group, 2012, 1 night and 4 nights, outbound
In the two figures above it is represented the tourism by personal purposes domestic and outbound, from seven countries breaking down by age group and by number of nights of stay. The conclusion of these representations may be that the trips for personal purposes are at a higher level in domestic area for one night then the 4 nights stays; the three first countries ranged in this direction are: Romania, Netherlands and Greece. The outbound tourism for personal purposes is covered by Netherlands, Austria, Finland and Hungary. The age group that was massively represented is for the tourists within the group 25-64 years old.
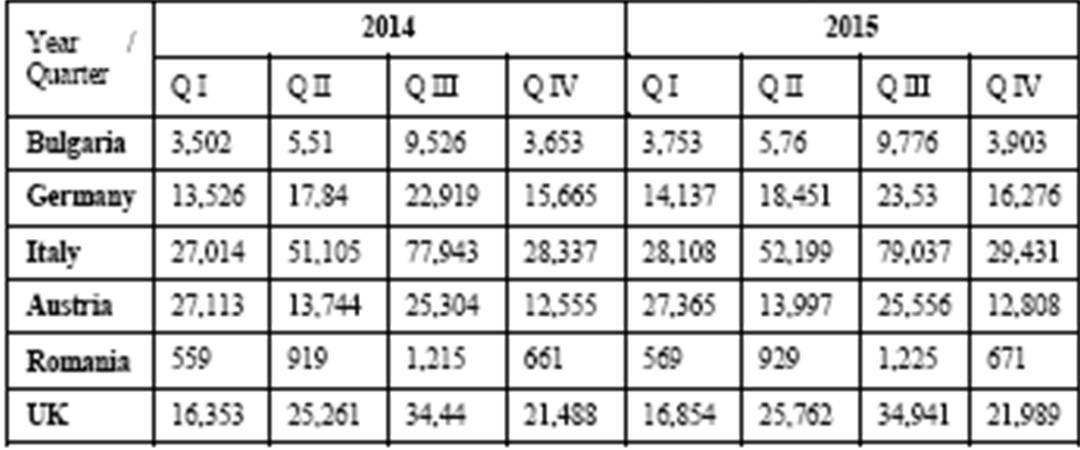
Going further to the next part of the work, this was shaped around the seasonality analysis of the data series “total nights spent”, by residents and non-residents (in thousands), in Hotels, holiday and other short-stay accommodations; camping grounds, recreational vehicle parks and trailer parks (categories as they are registered in the Eurostat database). To do this, there were chosen, except the lack of statistical data for all the European countries, six countries with touristic vocation: Bulgaria, Germany, Italy, Austria, Romania and the United Kingdom. Quarterly data analysed were extracted from the Eurostat database and spread over a12-year period, 2002-2013.
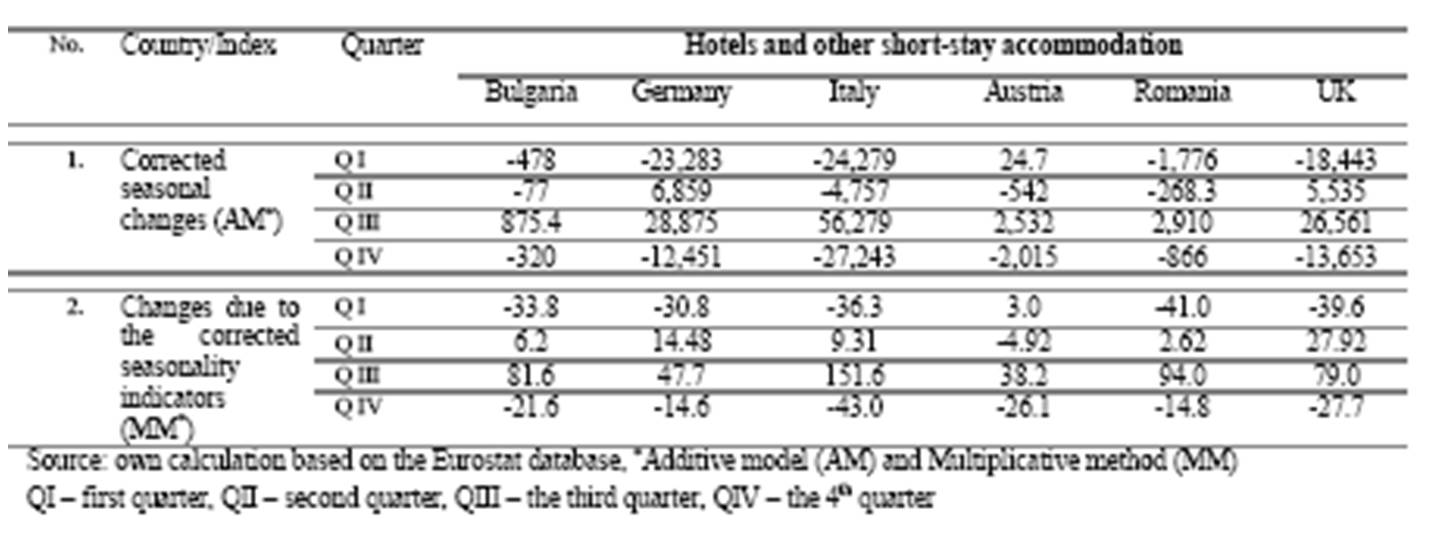
Table 1: Seasonality Index – Nights spent at tourist accommodation establishments (x´1000), Residents
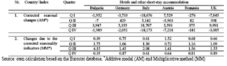
For quarterly seasonality analysis, we have applied two methods of computation; the additive and the multiplicative methods. Data interpretation was done by means of average of gross seasonal deviations and corrected seasonal changes for the first method and by the average of gross seasonal indicators and changes due to the corrected seasonality indicators for the second method. Thus, the results suggest that with the additive method, the average of gross seasonal deviations induced overall negative seasonal changes for Bulgaria and Austria; for the other countries these changes are positive. The interpretation of the corrected quarterly seasonal changes, suggests positive adjustments for all countries in Q3 of the period and negative seasonal adjustments in all countries for the 4thquarter. Second quarter for Germany and the UK also presented positive corrected changes. We can thus conclude that in Germany, the number of nights spent by resident tourists in accommodation was higher than average in the second quarter with 6859 units and with 28875 units higher in the 3rdquarter. For the UK, the effects of seasonality led to positive adjustments in Q2 with 5535 units and 26561units in the third quarter, compared to the average of the period. The major setbacks were recorded in Italy, where in the last quarter of the period, changes due to the seasonal effect caused a decrease (27243) than the average. Regarding the multiplicative method, the most important positive adjustments were in Italy, Q3, where it was a correction of approximately152% over the average of the period. Instead, as with the previous method, the most important negative adjustments were also produced in Italy, in the 4thquarter (-43%), compared to the average of the period and for analysed indicator.
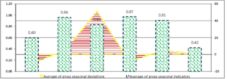
Fig9: Averages of the seasonality Index, Nights spent at tourist accommodation establishments, Residents*Additive model (AM) and Multiplicative method (MM)
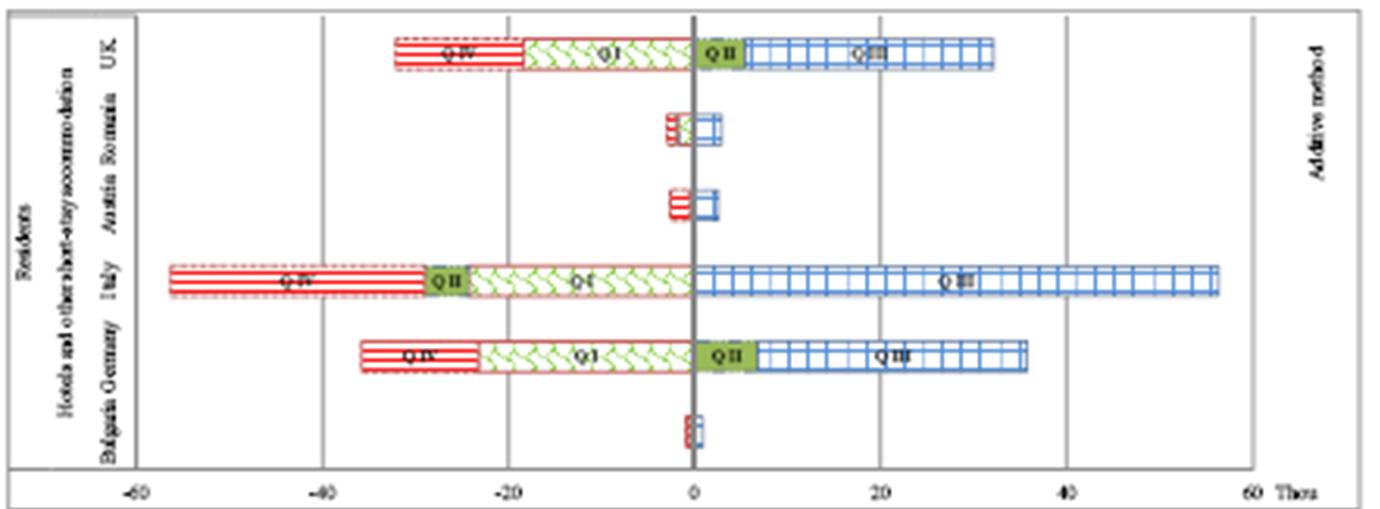
The figures below (Fig. 10) resume the dynamics of the averages of seasonality index among the six countries that have been taken into consideration for the analysis. Thus, we have found, for the additive method, the highest average corrections in Italy and the smallest in Bulgaria. For the multiplicative method, the seasonality effects for the more important positive changes in average were in Austria and the negatives ones in the United Kingdom.
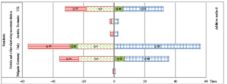
Fig. 10: Corrected seasonal changes, Additive method, 2002-2013
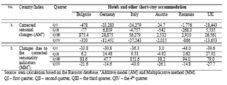
In the last part of the paper, based on quarterly data for the indicator” Nights spent at tourist accommodation establishments” in “Hotels; holiday and other short-stay accommodations; camping grounds, recreational vehicle parks and trailer parks” for Residents during the period 2002-2013 and in the six countries considered for this work, we have calculated a forecast for the next two years, 2014and2015. The method that we have use in this purpose was the linear projection and it was taken into account the seasonal adjustment of the data series achieved by the additive method. Results are listed in the table below (Table2).
Table 2: Forecasting quarterly data, additive method, Residents, Nights spent at tourist accommodation establishments (x´1000)
Source: own calculation based on the Eurostat database, 2014
In this part, we have made the analysis based on the same methodology as above, for the same time series and indicators, but now for the “non-residents” of the six countries that we have pointed out above.
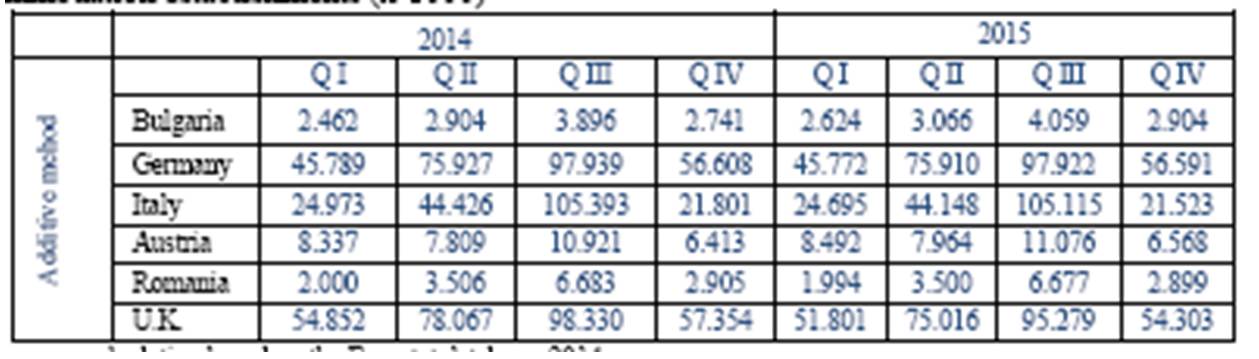
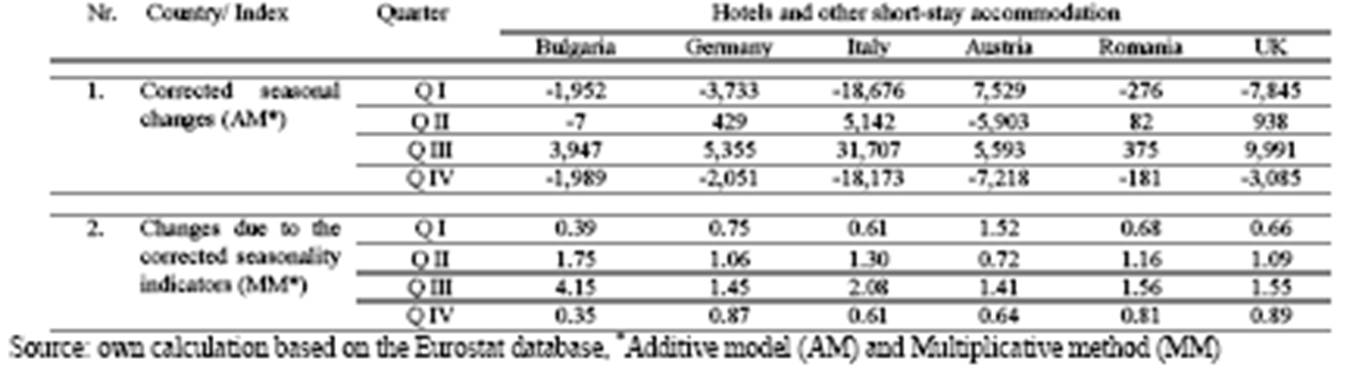
Table 3: Seasonality Index-Nights spent at tourist accommodation establishments (x´1000), Non- Residents
The results of this quarterly time series suggest that, for the nights spent at tourist accommodation establishments by the non – residents, the average of gross seasonal deviations involves negative corrections for all the countries taken into consideration in this part of the paper, except perhaps for Romania and the UK. Positive changes corrected by the additive method were obtained for the 3rd quarter, while negative values were obtained for all countries in the 4th quarter. For Q1 were also observed negative corrections due to seasonal factor in all countries, except in Austria. The 2nd quarter has also its peculiarities, registering positive values due to seasonal factor corrected for all countries, except for Bulgaria and Austria. The multiplicative method, applied for the quarterly time series Nights spent at tourist accommodation establishments ( x’1000 ), Non – Residents in Hotels ; holiday and other short – stay accommodations, resulting only positive values.

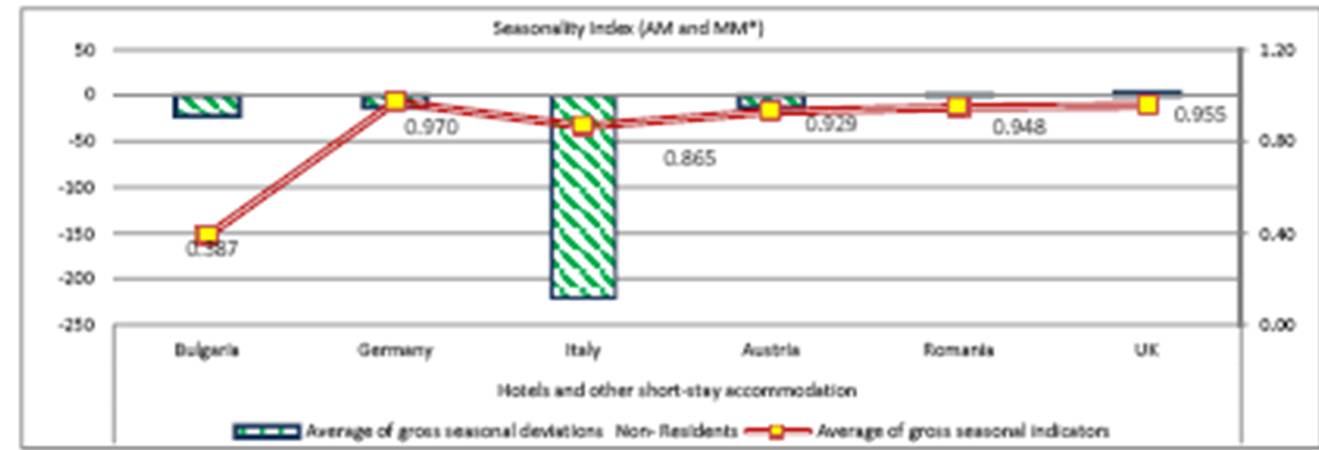
Fig.11: Averages of the seasonality Index, Nights spent at tourist accommodation establishments, non-Residents*Additive model (AM) and Multiplicative method (MM)
The figure above (Fig. 11) resumes and emphasizes the dynamics of the averages of the seasonality index among the six countries for the non-residents. Thus, we have pointed out the countries that have shown a strong seasonality in time series. Further, there are graphical presentations of the quarterly corrected changes revealed by using the additive method and multiplicative method (Fig 12).
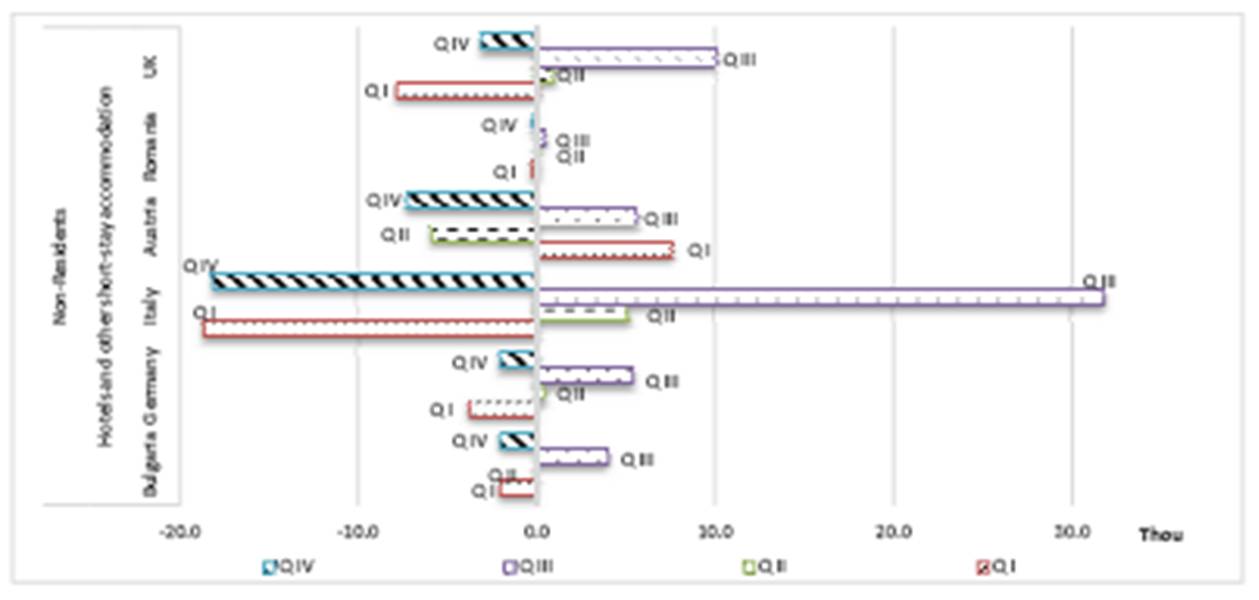
Fig. 12: Corrected seasonal changes, additive method, 2002-2013
Among the six countries shown in the chart above, we have noted that Italy has the largest gap from the average between the four quarters. In this additive method for the seasonality, it seems that Romania and Bulgaria show the most clustered values around the mean.
The forecasting of the 2014 and 2015 quarterly data is presented in the table below (table8). This data has been taken into account the seasonal corrections identified by using the additive method.
Table 4: Forecasting quarterly data, additive method, non-Residents, Nights spent at tourist accommodation establishments (x´1000)
Source: own calculation based on the Eurostat database, 2014
Conclusion
The findings of this paper can resumed the idea that Romanian tourists have travelled massively for personal purpose. Trips for professional and business purpose have represented only 2,52% from the personal ones. At the European level, Romania and Bulgaria have marked the lowest share (half of the European average) of the resident population, having made at least one holiday trip of 1 or 4 overnights stays. At the opposite, for double of the European average, is Luxembourg. Having a look on the nights spent in the Romanian tourist accommodation establishments by the foreign tourists, the United States as country of residence of the tourists, takes the first place among the seven countries ranking, for the 2007-2012 period. As for the expenditures by tourist and number of overnights stays, the Romanian tourists, have paid for 1 overnight stay as much as they paid for a 4 overnight stays. The expenditures on durables and valuable goods have the highest interest for the Romanian tourist, for all types of trips considered. The core of this study consisted in the seasonality analysis, but also it has been brought in discussion the challenges of the touristic countries and the resident tourism versus non-resident tourism. In term of season, the third quarter of each year played a major role in which concern the seasonality trips for tourists. Italy, even if it is a well-known touristic country, had to face some challenges that have led to a particular profile. Romania, as main touristic actor in the Eastern Europe, even if it is not at the world touristic level, has presented an evolution more fluid as compared with the other countries. The fact that it was or not a resident for the country, the seasonality of the nights spent at tourism accommodation establishments played a major role, which was different, shaping thus a particular touristic framework for each country.
References
1. Cheung R. and Lam P.,(2009),“How Travel Agency Survive in e-Business World?”, Communications of the IBIMA, Volume 10, ISSN: 1943-7765.
2. Claveria O., Torra S., (2014),“Forecasting tourism demand to Catalonia: Neutral networks vs. Time series models.Economic Modelling 36 (2014) 220-228, www.elsevier.com/locate/ecmod, http://dx.doi.org/10.1016/j.econmod.2013.09.024.
Publisher
3. Despa R., Huidumac C., Dumitru N.R. and Negricea C.,(2010),“The Correlation between the Number of Tourists and the Number of Nights Spent in the Hotel: Analysis Indicator of Hotel Business Efficiency”, http://www.ibimapublishing.com/journals/CIBIMA/cibima.html, Publishing Communications of the IBIMAVol. 2010, Article ID 813597, 6 pages.
4. Fîntîneru A., Fîntîneru G., Smedescu D. I.,(2014),“The macroeconomic impact of Romanian tourism”,Scientific Papers. Series “Management, Economic Engineering in Agriculture and rural development”, Vol. 14 Issue 2, Print ISSN 2284-7995, 123-126.
5. Guizzardi A.and Mazzocchi M.,(2010),“Tourism demand for Italy and the business cycle”, Tourism Management 31, pp. 367-377, www.elsevier.com/locate/tourism, doi:10.1016/j.tourman.2009.03.017.
Publisher
6. Hairan S., Gang L., (2008),” Tourism demand modelling and forecasting — A review of recent research”,Tourism Management 29 (2008)203-220, Elsevier—ScienceDirect, doi:10.1016/j.tourman.2007.07.016
Publisher
7. Kima D.Y., Lehtob X.Y., Morrison A.M.,(2007),“Gender differences in online travel information search: Implications for marketing communications on the internet”,
8. Tourism Management 28 (2007) 423—433, www.elsevier.com/locate/tourman.
Publisher
9. Song H., Kim J.H. , Yang S., (2009),“Confidence intervals for tourism demand elasticity”, Annals of Tourism Research”, Vol. 37, No. 2, pp. 377—396, Elsevier, www.elsevier.com/locate/atoures, doi:10.1016/j.annals.2009.10.002.
Publisher – Google Scholar
10. Wenshin C. and Bennett D., (2010),“When Cost-Efficient Technologies Meet Politics: A Case Study of Radical Wireless Network Implementation”, Publishing Communications of the IBIMA, http://www.ibimapublishing.com/journals/CIBIMA/cibima.html, Vol. 2010, Article ID 119470, 12 pages, DOI: 10.5171/2010.119470.
Publisher
11. http://epp.eurostat.ec
12. www.insse.ro. On-line tempo series
13. www.madr.ro