Introduction
Unemployment is a major problem in Turkey as well as in almost all other countries of the World. Unemployment is defined as the situation of being without a job. A decrease in the growth of economies is a major cause of rising unemployment. (Chowdhuryn and Hossain, 2014). According to economic theory, although the unemployment rate is regarded as an important indicator of labor market performance, there are many other indicators affecting unemployment. Some are listed as the value of imports and exports, the dollar cost of imports and exports, the exchange rate of imports and exports, the exchange rate, population growth, gross national product (GNP) growth at current prices, GNP growth at fixed prices, public investments, private investments and GNP deflator (Goktas and Isci, 2010). Studies regarding the unemployment rate for Turkey generally consider determining the relationship between unemployment and other indicators or variables. For example, Bildirici et al., (2012) investigate unemployment generating effects. Kabaklarli et al., (2011) analyze the economic determinants of the unemployment problem in Turkey. Berument et al. (2006, 2009) and Berument (2008) research the impact of macroeconomic policy on unemployment in Turkey. Dogrul and Soytaş (2010) investigate the relationship between the price of oil, interest rates and unemployment. Dogan (2012) studies macroeconomic variables and unemployment in Turkey.
On the other hand, there is a large amount of empirical literature that tries to understand the difference between geographical areas in terms of unemployment rates. For examples, Niebuhr (2003) studies spatial interaction and regional unemployment in Europe. Lottmann (2012) explains regional unemployment differences in Germany using a spatial panel data analysis. Cracolici et al. (2007) handle provincial unemployment disparities of Italian provinces for the year 2003. Lopez-Bazo et al. (2002) provide the provincial distribution of unemployment rates in Spain. Filiztekin (2009) studies regional unemployment disparities in Turkey from 1980 to 2000, using spatial and nonparametric techniques. Khamis (2012) examines the spatial pattern of each of illiteracy rate and unemployment rate in Egypt. Odeyemi (2013) considers poverty rates in Nigeria with unemployment rates and illiteracy. Kantar and Günay (2015) investigate the spatial pattern of unemployment rates with the socio economic development index (SDI) and literacy rates for 81 provinces of Turkey.
Turkey is divided into seven main geographical regions; Marmara, Aegean, Mediterranean, Black Sea, Central Anatolia, Eastern Anatolia and South Eastern Anatolia. In Turkey, there are 81 provinces which exhibit substantial differences in terms of economic and social variables. The main differences between west (Marmara and Aegean) and east (Eastern Anatolia and South Eastern Anatolia) are clearly seen. These differences are known as the basic characteristic of the geography of Turkey. In this study, we investigate unemployment rates in Turkey in order to explain differences between geographical areas. A map of Turkey’s regions and provinces is shown in Fig 1.
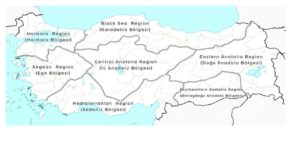
Figure 1: Turkey’s regions and provinces.
Method
In this study, we study unemployment rates, taken from the Turkish Statistical Institute, at province level in Turkey for the years 2004, 2011, 2012 and 2013 using spatial statistics tools, such as Local, and Global Moran’s I statistics to explore the geographical distribution of unemployment for the 81 Turkish provinces. All analyses are conducted in the GeoDa 095i program. Mapping analyses are used as a first step to observe spatial spillover of the unemployment rate in Turkey.
Spatial Autocorrelation Statistics
To evaluate spatial dependence, we first have to determine what is meant by two observations being close together. In other words, we have to determine the distance measure between locations. Depending on the determined distance, a weight matrix, which defines relationships between locations, is formed. W is the weight matrix with zeros (wij, i ≠j and i, j=1,2,…,n) on the diagonal and with weights (wii, i=j) on the off-diagonal. wij, i ≠j is the main component of the spatial autocorrelation measure.
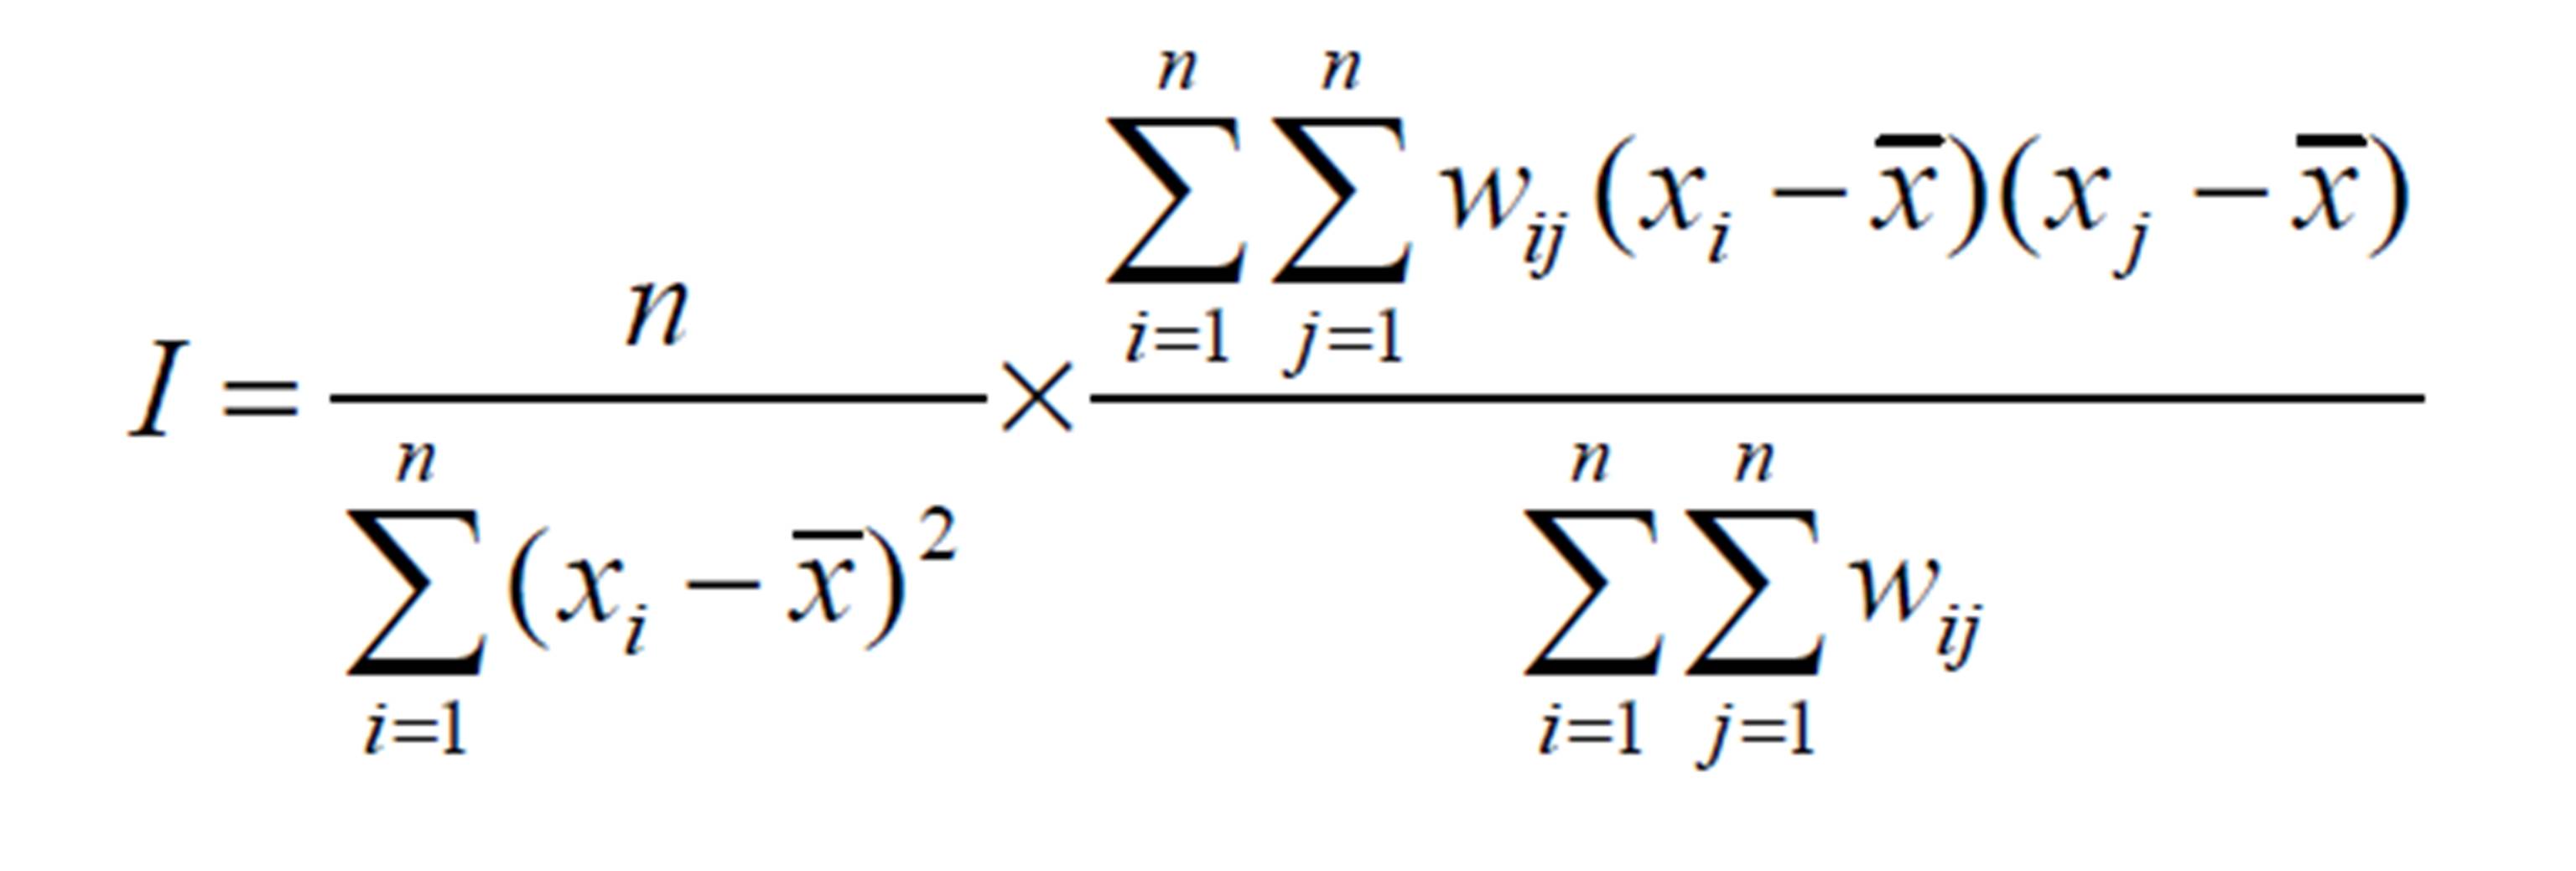
The well-known global spatial autocorrelation measure is the Moran’s I given by:
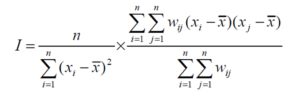
where n is the total number of spatial observations (i.e. districts), xi is the value for the spatial location i, xj is the value for another spatial location j. is the mean value of all spatial locations, wij is the spatial weight between locations i and j. Moran’s I can be positive or negative. While its positive value arises when similar values occur near one another, a negative value arises when dissimilar values occur near one another. If the Moran’s I value is zero, no spatial autocorrelation is present.
Similarly, the local Moran’s I statistics is a well-known local spatial autocorrelation measure. Based on local Moran’s I statistics, local spatial autocorrelation analysis (LISA) is conducted (Anselin, 1995). The LISA map is drawn to identify potential local clusters and spatial outliers. While the LISA significance map shows locations with significant local Moran’s I statistic, the LISA cluster map provides essentially the same information as the significance map, but shows significant locations in color, coded by the type of spatial autocorrelation. High-high (HH) and low-low (LL) regions show clustering of similar values of the considered variable, while high-low (HL) and low-high (LH) regions indicate spatial outliers (Anselin, 2005). Spatial outliers have different meanings in the context of spatial statistics. Significant spatial outliers indicate that high values are surrounded by low values while low values are surrounded by high values.
Results
Unemployment rates in Turkey from 2004 to 2014
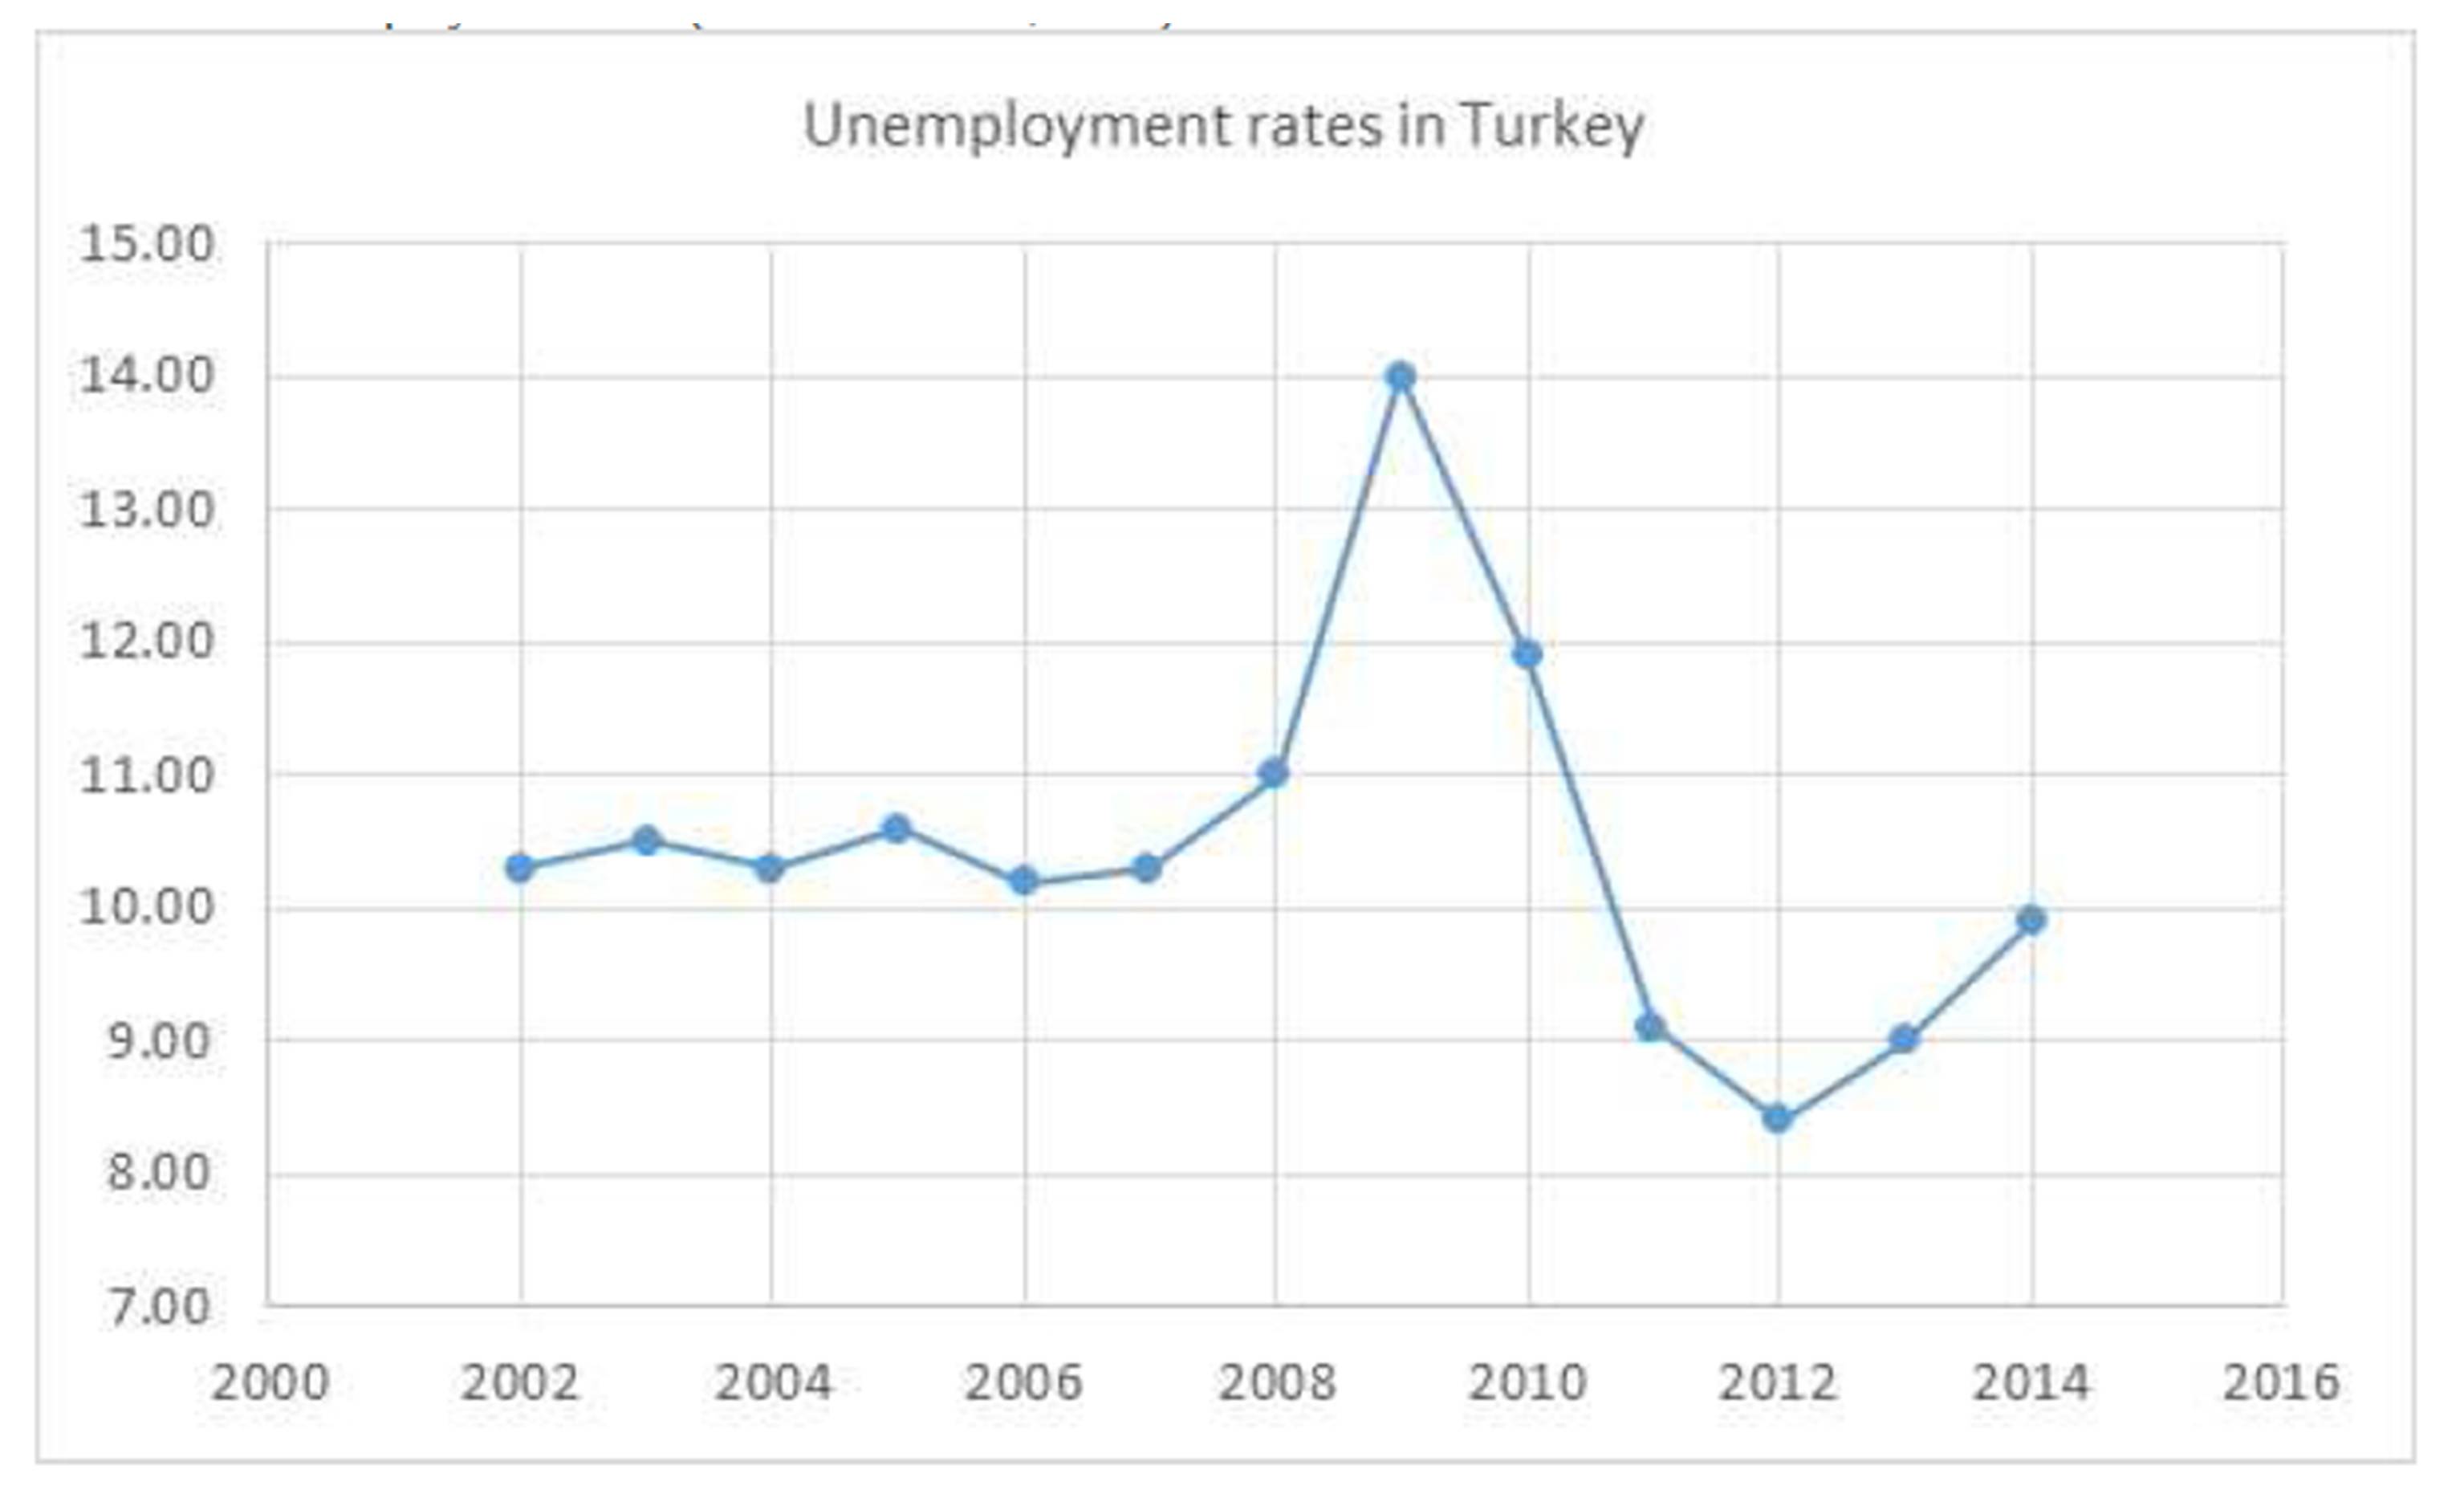
The unemployment rates in Turkey for the period 2002-2014 are shown in Fig 2. It can be seen from the figure that the unemployment rates were around 10.5% in 2004 and reached a peak in 2009 in Turkey due to the existing global crisis. The unemployment rate decreased in 2012 due to the effect of positive trends in Turkey’s economy. Consequently, the general unemployment rate in Turkey over 12 years was around 10 %, which is extremely high compared to most Europe countries. In addition, the youth unemployment rate in Turkey is nearly twice the level of the total unemployment rate (Kabaklarli et al., 2011).
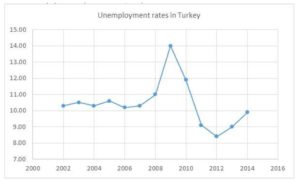
Figure 2: Unemployment rates in Turkey (http://globalpse.org/turkiyede-issizlik-sorunu-
(2002-2015)
Taking into account the last three years for all provinces in Turkey, it can be observed that 16.1% of the maximum unemployment rate is seen in Adiyaman in 2011. Next to Adiyaman, Izmir, Batman and Gaziantep have high unemployment rate. Although Izmir is one of the largest industrial provinces in Turkey, its unemployment rate is at a very high level. One reason for this is that Izmir has experienced high in-migration over the last 30 years (Isik, 2009). Kütahya, Kahramanmaraş, Manisa, Uşak and Çorum have the lowest rates, at around 4.7%. For 2012, Batman has the highest rate, at 25%. Morever, Siirt and Mardin follow Batman. Kutahya and Usak have the lowest unemployment rates in 2011, 2012 and 2013. The rates for Batman, Mardin and Siirt are, respectively, the highest in Turkey in 2013, Turkey. When the last three years are taken into account, it can be said that the province experiencing the highest unemployment rate is Batman.
Spatial distribution of unemployment rate of Turkey (2004-2013)
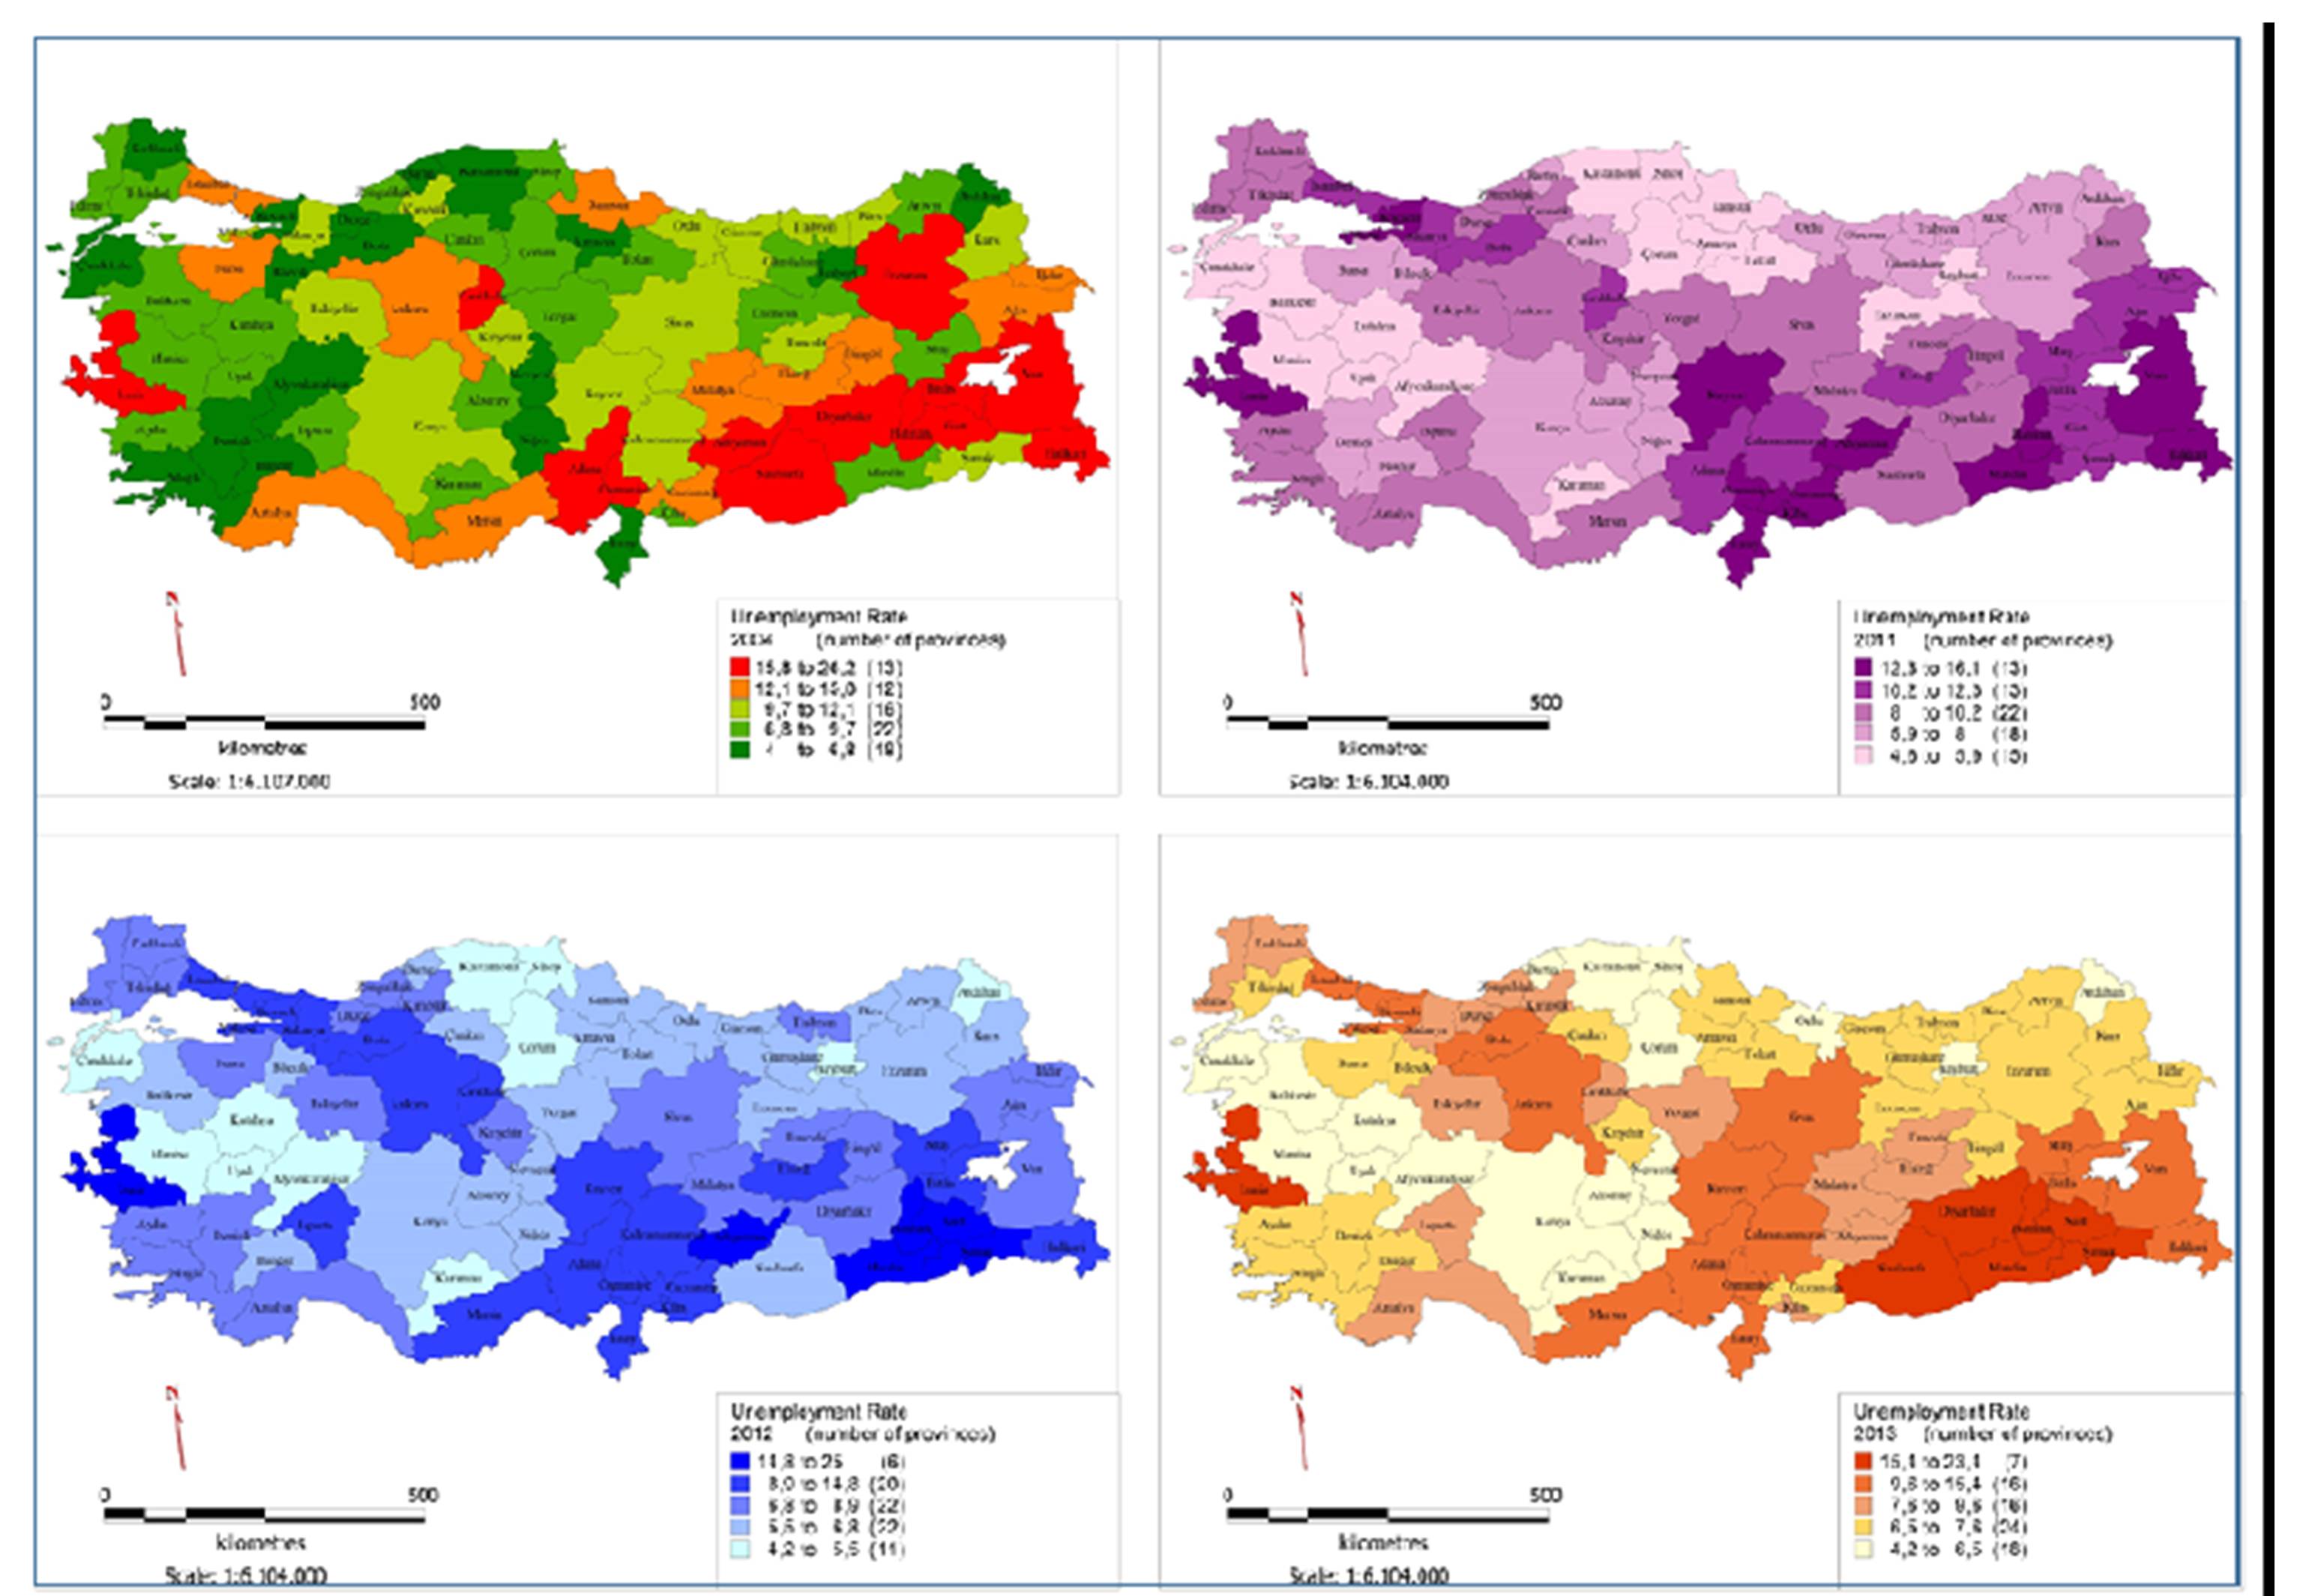
The distribution of the unemployment rate according to province is explained by maps drawn for the periods (2004, 2011, 2012 and 2013). The breakdown of the maps is calculated using the Natural Break Classification method.
The map for unemployment rates for 2004, 2011, 2012 and 2013 are respectively given in Fig 3. It can be seen from the figures that unemployment rates are low in the west, except for Izmir. Particularly high unemployment clusters are seen in the South East Anatolia. For 2011, Izmir, Kocaeli, Yalova, Gaziantep, Adıyaman and Batman provinces have high unemployment rates. In 2012 and 2013, high unemployment is seen in the provinces of the South Eastern Anatolia region.
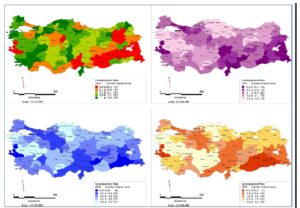
Figure 3: Map of unemployment rates for 2004-2013.
Considering all the maps, it is can be seen that unemployment rates are rather high in large provinces, such as Istanbul, Izmir, Ankara, Adana and Kayseri. Furthermore, Sanliurfa, Diyarbakır, Mardin, Batman, Siirt and Sirnak in South Eastern Anatolia Region have high unemployment rates. It is well-known that Turkey has been suffering from terrorism in South Eastern Anatolia Region and thus the unemployment rate is negatively affected by terrorist actions in this region.
Global spatial autocorrelation analyses
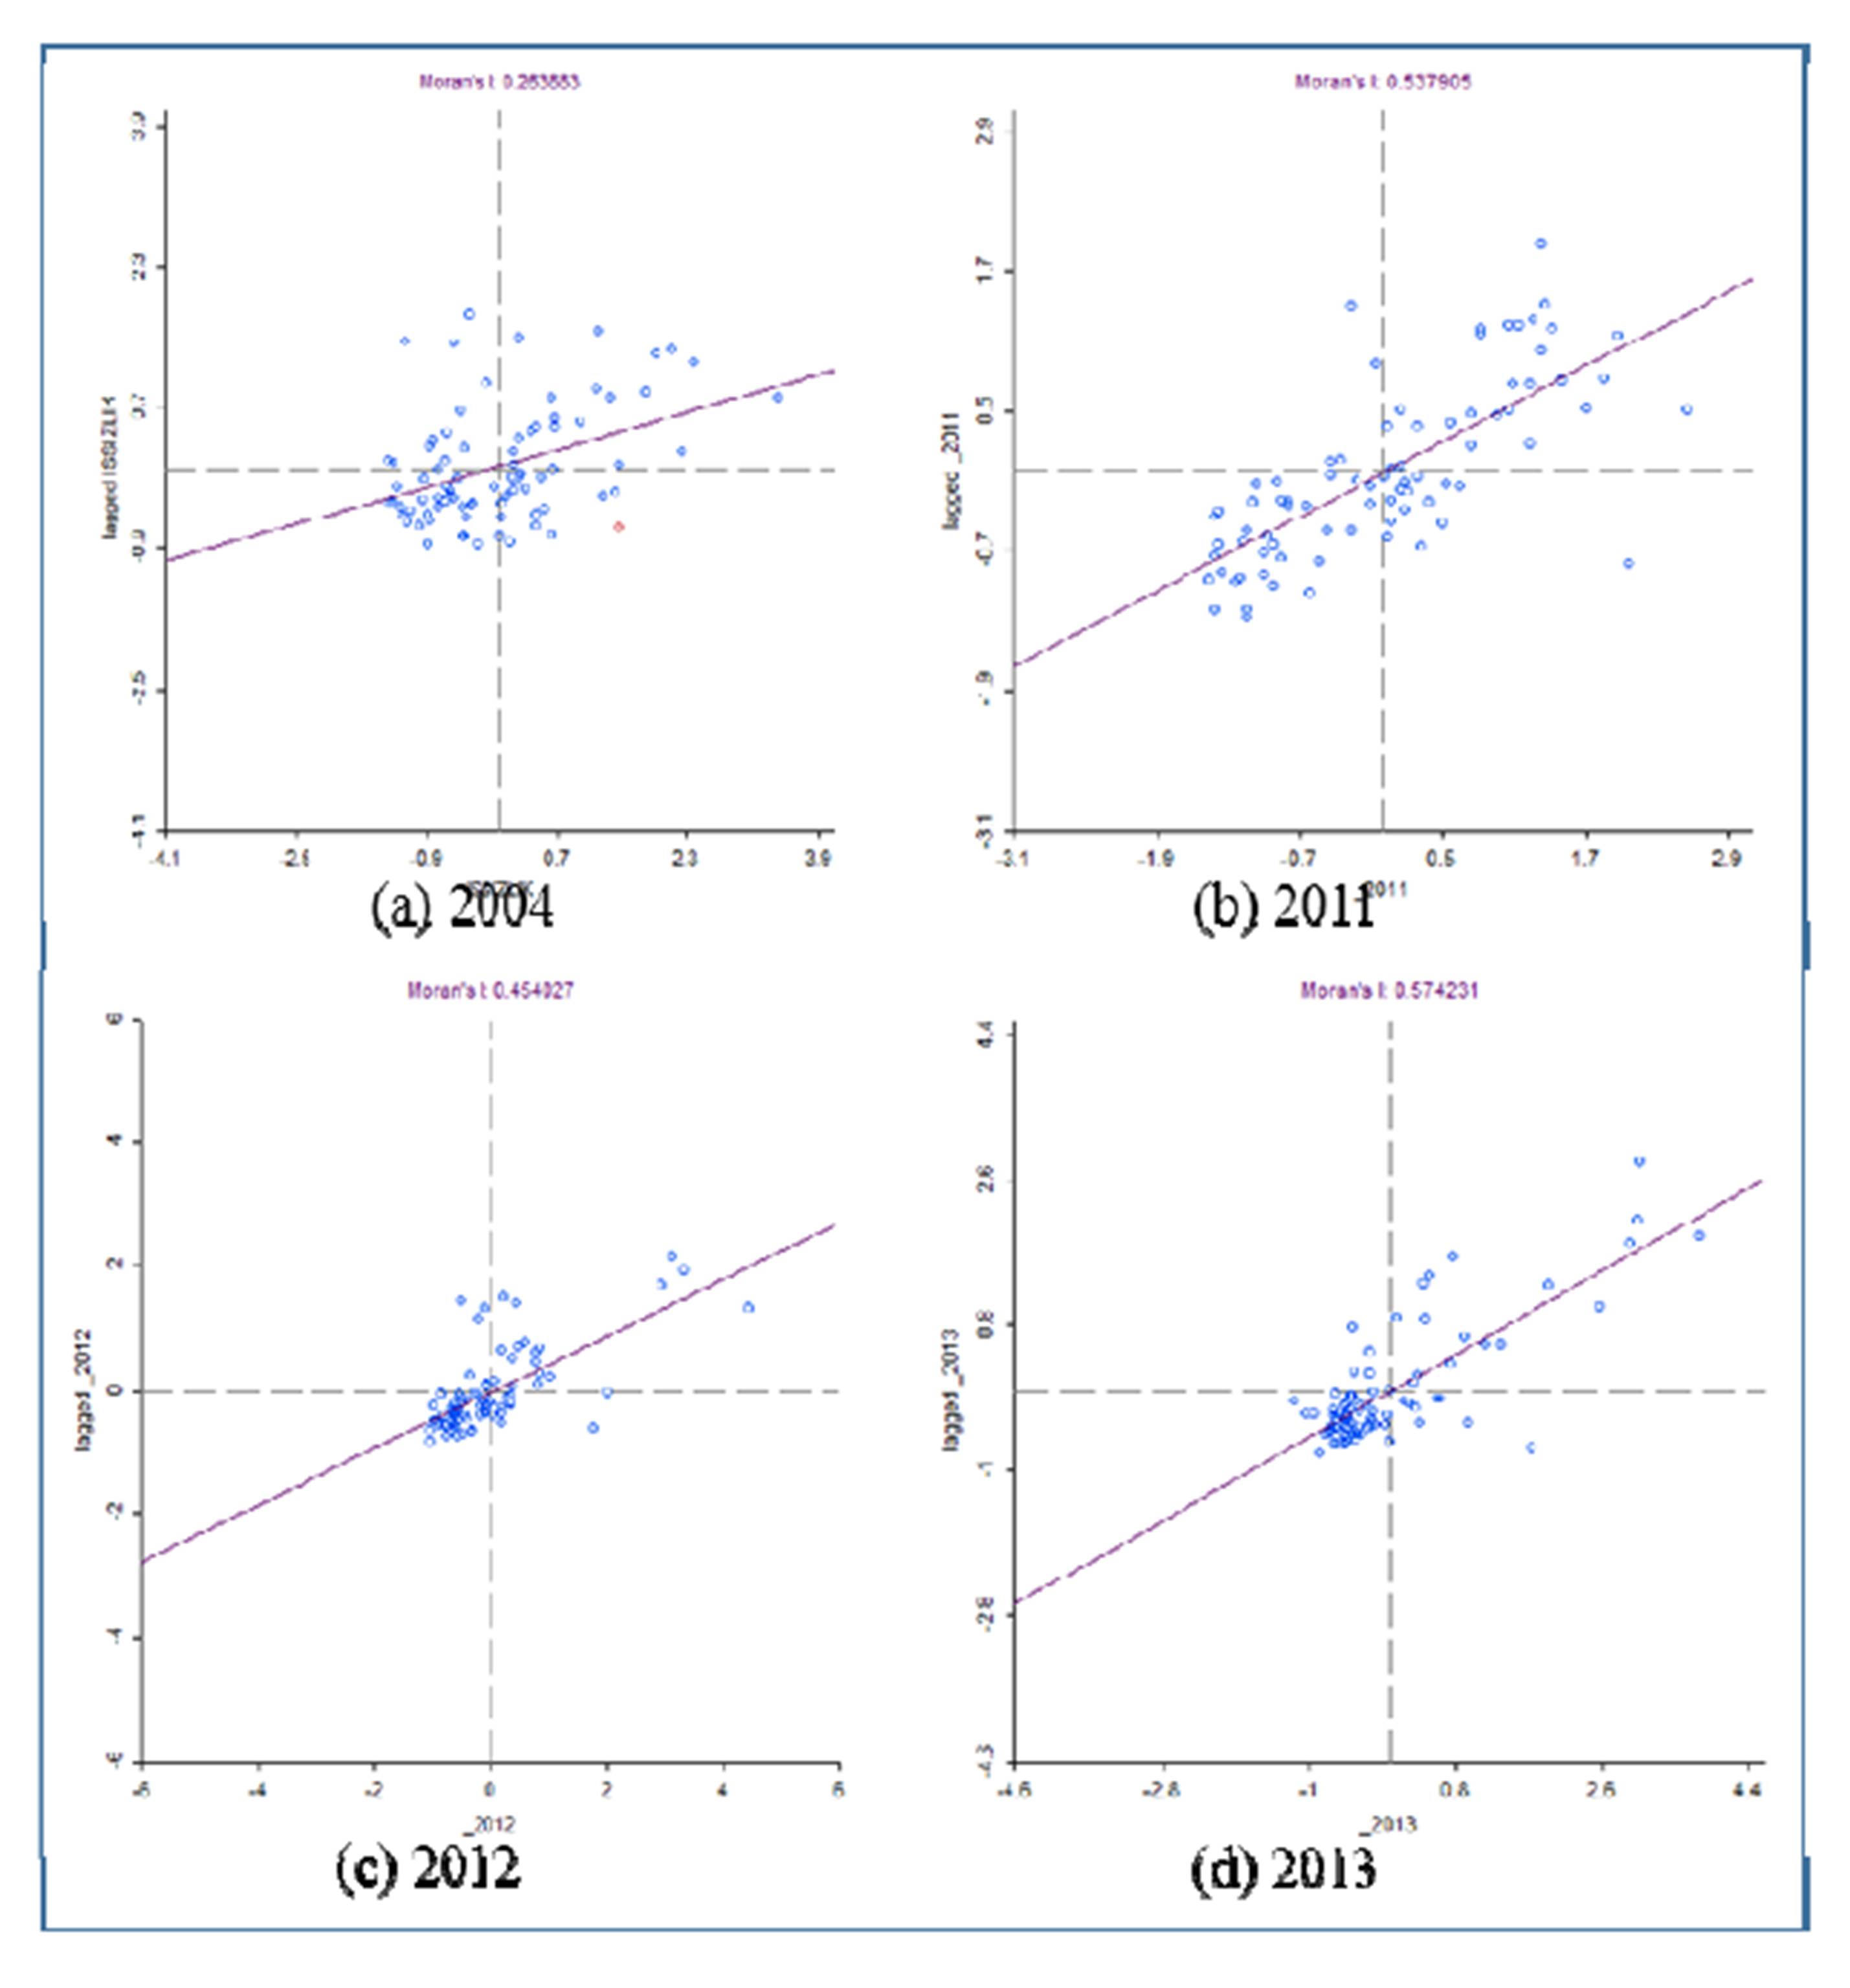
In this study, a spatial weights matrix based on the Queen Contiguity measure is used. Global Moran I’s scatter plots of unemployment rates are demonstrated in Fig 4., for 2004, 2011, 2012 and 2013. It can be observed that the X- axis shows the unemployment rate and the Y- axis shows the lag-unemployment rate defined by the weights matrix.
As seen from Fig 4. (a-d), the regression line of the scatter plot of the Moran’s I as a slope is reasonably accurate. For 2004, Moran’s I for the unemployment rate is 0.2638 which suggests a clustered spatial pattern in the distribution of the unemployment rate for Turkey since the p-value of Moran’s I is less than 0.05 and thus, Moran’s I is statistically meaningful. Moran’s I increases in 2011, 2012 and 2013. They are all greater than 0.45, and the associated p-values are less than 0.05. This means that there is spatial autocorrelation between geographical areas in terms of the unemployment rates at a provincial level in Turkey.
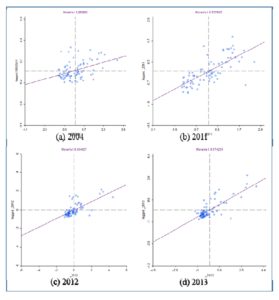
Figure 4: Moran’s I scatter plots for unemployment rates. Standardized unemployment rates are on the X-axis and standardized average of neighbors’ unemployment
rates are given on the Y-axis.
Local spatial autocorrelation analyses
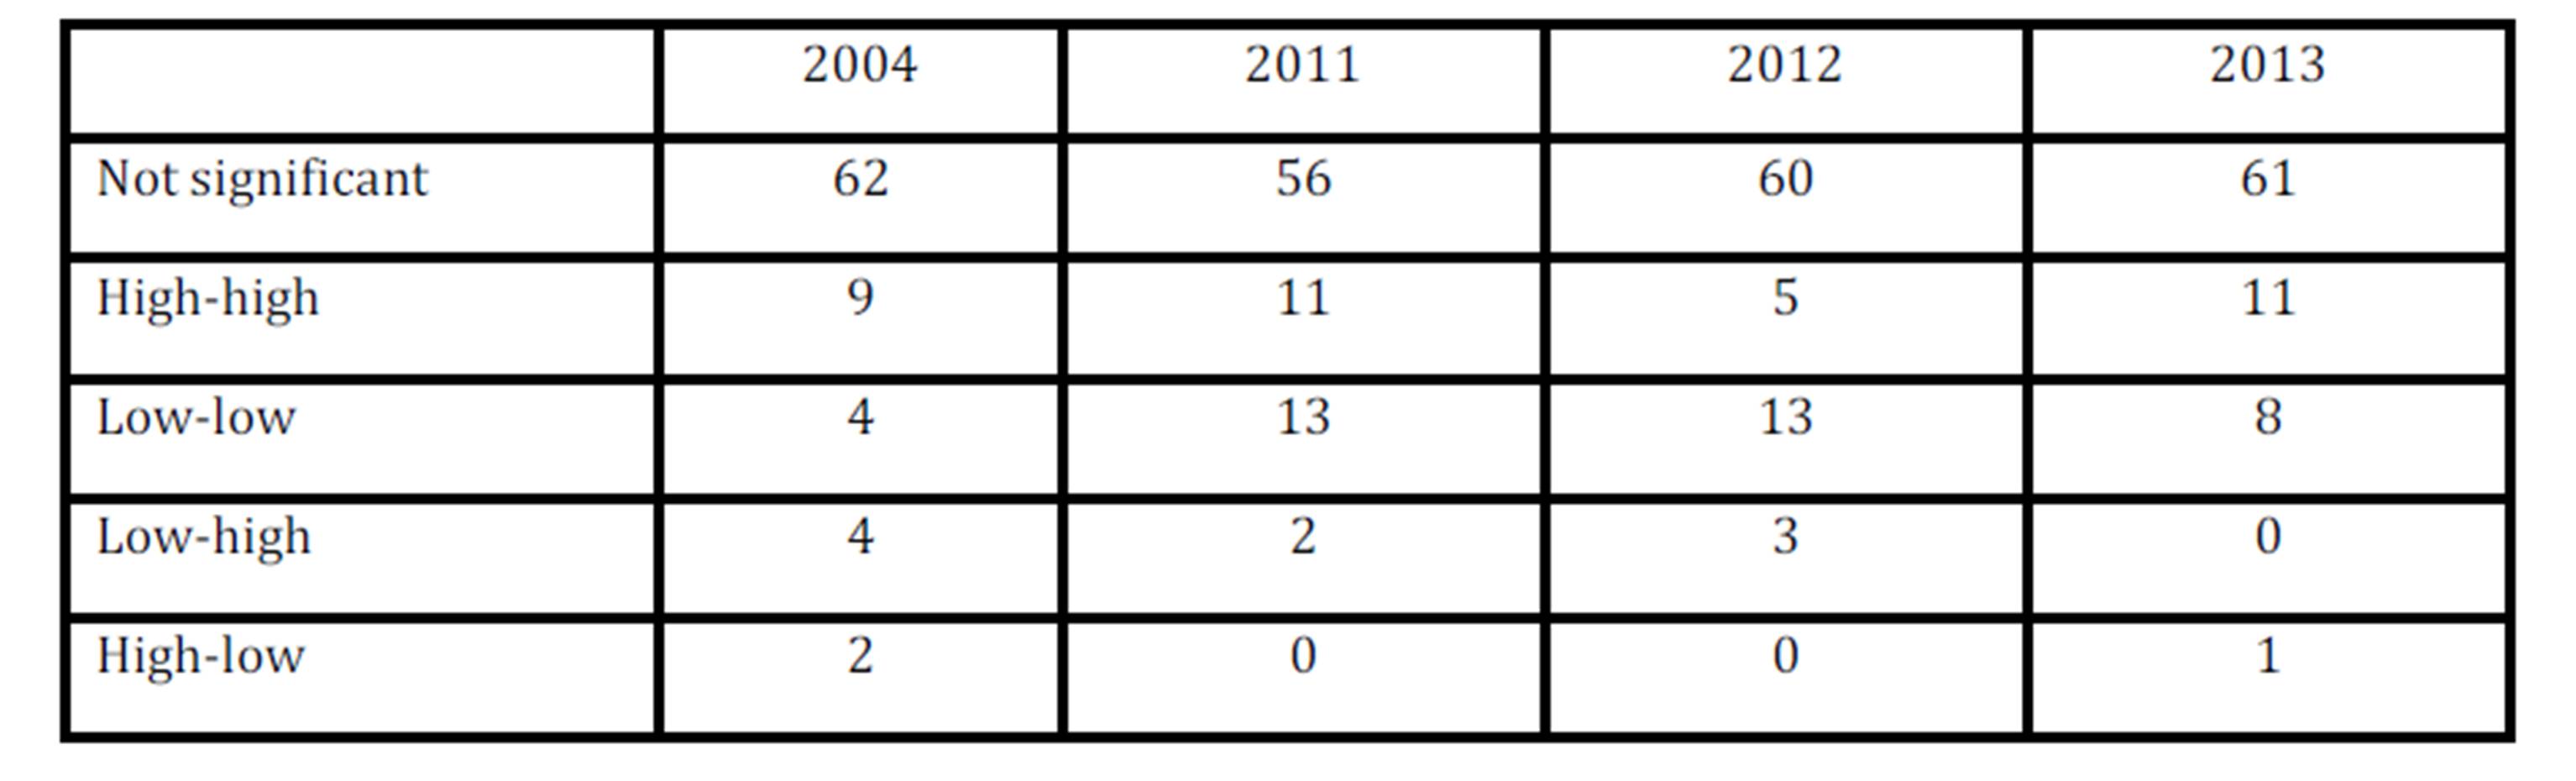
In order to further understand the spatial distribution of unemployment rates, local autocorrelation analyses (LISA) are conducted (Celebioglu, 2010). The results of the LISA cluster maps are summarized in Table 1.
Table 1: Significant LISA results (α=0.05) for unemployment rate in Turkey
For this purpose, the LISA maps are drawn. It can be seen that the LISA cluster maps, shown in Fig 5., confirm the significant presence of local spatial autocorrelation according to unemployment rates at the provincial level in Turkey.
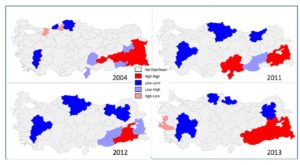
Figure 5: LISA cluster map for unemployment rates
LL clusters (three provinces) are identified in the Moran cluster map for unemployment rates and HH clusters are observed in eight provinces in the South East Region in 2004. Six provinces are outliers. 9 and 4 provinces are in the HH and LL groups, respectively. The number of the LL and HH clusters increase by 2013. 11 provinces in the east part of Turkey are identified in the HH clusters for 2011. Similar to 2011, there are three LL clusters in 2012 (see Fig 5); one in the Central Region, one in the Black Sea Region and one in the Central West Aegean sub-region of Turkey. One HH cluster is seen the South East Region.
As can be seen from Fig 5., for all years, most clusters are observed in the South East Anatolia Region. Over the years, the number of provinces in LL clusters have increased in the South East Anatolia Region. This means that the degree of neighboring effect of unemployment rates at the provincial level in Turkey has increased. For these reasons, public and private sector investment should be attracted to the east part of Turkey in order to decrease unemployment.
Conclusions and Discussion
High unemployment rates are a concern for all countries in the world, as well as Turkey. In this study, regional unemployment rates at province level in Turkey from 2004 to 2013 have been researched by means of spatial autocorrelation statistics as well as mapping analyses.
When examining the spatial distribution of unemployment in Turkey, the following results may be concluded:
– The development of industry based on griculture in Turkey is insufficient compared to world markets. (Bozdaglioglu, 2008). The agriculture sector in Turkey has rapidly shifted to the service sector (Guney, 2010, pp.249). Mechanization has reduced the need for labor in agriculture (Yilmaz, 2005). Thus, provinces with high agricultural potential are seen to experience high unemployment rates.
– In the Turkey, rural to urban migration has increased markedly over the last 50 years. This migration can be seen in developed provinces for the service and industry sectors (Güney, 2010). This migration towards the industrial regions, has increased the unemployment problem in Turkey (Bahar and Bingol, 2010: 55). In order to cope with the unemployment problem in Turkey, policies for rural and undeveloped regions should be drawn up. Sectors with a high—employment potential in the provinces, such as Bursa, Corum, Denizli, Diyarbakır, Gaziantep, Urfa, being regional centers of attraction for investment, should be supported by the government (Ay, 2012; Yavan, 2012).
– Taking into account Global Moran’s I statistics, it can be observed that there is spatial autocorrelation between geographical areas in terms of unemployment rates at a provincial level in Turkey, and also that spatial autocorrelation has increased over time.
– Macro-economic problems, such as unemployment, have negatively affected social issues, such as the crime rate (Comertler, 2007:15). For this reason, unemployment should not be considered as solely an economic problem, and should be considered as a factor that can lead to social problems. This study shows that spatial clustering at a provincial-level is observable in Turkey and that terrorist actions in the South Eastern Anatolia Region have an influence on unemployment.
References
1. Anselin L. (1995) ‘Local Indicators of Spatial Association — Lisa,’ Geographical Analysis, 27, 93-115.
Publisher – Google Scholar
2. Anselin L. (2005) ‘Exploring Spatial Data with GeoDa: A Workbook’ Spatial Analysis Laboratory, Department of Geography University of Illinois and Center for Spatially Integrated Social Science, IL, USA.
3. Bahar O and Bingol K. (2010). ‘The effects of internal migration on labour markets in Turkey,’ Suleyman Demirel University- Journal of Faculty of Economics and Administrative Science, 15(2), 43-61.
4. Berument, M.H. (2008) ‘Macroeconomic Policy and Unemployment by Economic Activity: Evidence from Turkey,’ IZA Discussion Paper: 3461.
5. Berument, M.H., Dogan, N., and Tansel, A. (2006),‘Economic Performance and Unemployment: Evidence from and Emerging Economy,’ International Journal of Manpower, 27(7), 604-623.
Publisher – Google Scholar
6. Berument, M.H., Dogan N. and Tansel A., (2009), ‘Macroeconomic Policy and Unemployment by Economic Activity: Evidence from Turkey,’ Emerging Markets Finance and Trade, 45(3), 21-34.
Publisher – Google Scholar
7. Bildirici M., Ersin Ö.Ö., Turkmen C. and Yalcinkaya Y. (2012), ‘The persistence effect of unemployment in Turkey: An analysis of the 1980-2010 Period,’ Journal of Business, Economics&Finance, 1(3), 22-32.
8. Bozdaglioglu YU. (2008). ‘The characteristics of unemployment in Turkey and the policies for fighting it (Türkiye’de işsizliğin özellikleri ve işsizlikle mücadele politikaları),’ Sosyal Bilimler Dergisi, 20, 45-65.
9. Chowdhury M.S.R. and Hossain M.T. (2014), ‘Determinants of Unemployment in Bangladesh: A Case Study,’ Developing Country Studies, 4(3), 16-20.
Publisher – Google Scholar
10. Cracolici M.F., Cuffaro M. and Nijkam P. (2007), ‘Geographical Distribution of Unemployment: An Analysis of Provincial Differences in Italy,’ Growth and Change, 38(4), 649—670.
Publisher – Google Scholar
11. Comertler N. (2007) ‘Türkiye’de suç oranının sosyo-ekonomik belirleyicileri: yatay kesit analizi,’ Ankara Üniversitesi, Siyasal Bilgiler Fakültesi Dergisi, 2007, 62(2), 1-37.
Google Scholar
12. Celebioglu, F. (2010) ‘Regional disparity and clusters in Turkey: a lisa (local indicators of spatial association) analysis,’ Dumlupınar Üniversitesi Sosyal Bilimler Dergisi, 28, 35-48.
13. Dogan T.T. (2012) ‘Macroeconomic Variables and Unemployment: The Case of Turkey,’ International Journal of Economics and Financial Issues, 2(1), 71-78.
14. Dogrul H.G. and Soytas U. (2010), ‘Relationship between oil prices, interest rate, and unemployment: Evidence from an emerging market,’ Energy Economics, 32, 1523—1528.
Publisher – Google Scholar
15. Filiztekin A. (2009) ‘Regional Unemployment in Turkey,’ Regional Science, 88(4), 863-878
Publisher – Google Scholar
16. Goktaş A. and Isci O. (2010), ‘Türkiye’de işsizlik oranının temel bileşenli regresyon analizi ile belirlenmesi,’ SÜ İİBF Sosyal ve Ekonomik Araştırmalar Dergisi, 20(14), 279-294.
17. Guney, A. (2010) ‘Türkiye’de geliştirilmiş işsizlik oranları,’ Çalışma ve Toplum, 1, 239-252.
18. Kantar YM and Gunay Aktas, S. ‘Spatial Analysis of Unemployment Rate with Literacy Rate and Socioeconomic Development Index for cities of Turkey,’ Proceedings of the 25th IBIMA Conference, ISBN: 978-0-9860419-3-8, 7-8 May 2015, Amsterdam, Netherlands.
19. http://www.tuik.gov.tr.
20. Lopez-Bazo E., Barrio T. and Artis M. (2002), ‘The regional distribution of Spanish unemployment: A spatial analysis,’ Papers in Regional Science, 81(3), 365-389.
Publisher – Google Scholar
21. Lottmann F. (2012) “Explaining regional Unemployment differences in Germany: a spatial panel data analysis,” SFB 649 Discussion Paper 2012-026.
Google Scholar
22. Kabaklarli E., Er P.H. and Bulus A. (2011), ‘Economic Determinants of Turkish Youth Unemployment Problem: Cointegration Analysis,’ International Conference on Applied Economics, Perugia, Italy, 2011.
23. Khamis F.G. (2012) ‘Spatial Analyses of Illiteracy and Unemployment at Governorate Level in Egypt,’ British Journal of Applied Science & Technology, 2(4): 390-405.
Google Scholar
24. Odeyemi C. A. and Olamide V. (2013), ‘Spatial Autocorrelation and Temporal Statistics of Poverty Index in Nigeria,’ European Journal of Humanities and Social Sciences, 25(1), 1297-1314.
25. Niebuhr A. (2003) ‘Spatial Interaction and Regional Unemployment in Europe,’ European Journal of Spatial Development, 5, 1-26.
Google Scholar
26. Turkish State Planning Organization (2004).
27. Yavan N. (2012) ‘Regional Determinants of Investment Incentives in Turkey: A Spatial andStatistical Analysis (Türkiye’de Yatırım Teşviklerinin Bölgesel Belirleyicileri:Mekânsal ve İstatistiksel Bir Analiz),’ Cografi Bilimler Dergisi, 10 (1), 9-37
28. Yilmaz A. (2005) ‘Unemployed population in Turkey,’ Fırat University Journal of Social Science, 15 (1), 43-56.