Introduction
The programming period 2014 – 2020 was grounded in a context where the European Union is facing major crises at both economic and social level as well as failures such as the Transatlantic Trade and Investment Partnership, relationship with Turkey, Brexit etc. Structural shift in the economy at the European level did not change significantly, but the differences between East and West and inequalities between Member States or between regions were maintained or even increased. Conservation of the competitiveness elements imposed the diversification of the tools that are part of the policies pursued by the European Commission. To do this, the cohesion policy has devoted increasingly larger importance to territorial approaches. Barca report (2009) mentions that interventions based on territoriality are superior to blind interventions that are based on a bottom-up approach. In the Territorial of the European Union 2020 (2011), it is mentioned that territorial approaches are based on local know-how, on local control of resources, and an implementation framework adapted to the specific characteristics of the territory. Under these circumstances, the programming period 2014-2020 integrates a number of innovative tools of territorial development, as follows: local development places under community-led responsibility and integrated territorial investments (ITI). One of the specificities of ITI concerns the involvement of local stakeholders in all phases requested in its establishment. Development of a local strategy, implementation, management, monitoring and decision must belong to local actors. The provenance of local actors should be linked to the territory established for the implementation of ITI. They are involved both in implementing the strategy governing ITI activities and actions for the implementation of a set of clearly defined actions that constitute the work of the ITI governance mechanism. Advantages related to ITI can be regarded as a higher rate of successful investments across industry, a greater number of dedicated resources specific to a particular territory, creating a governance mechanism that ensures the participation of the private sector, the possibility of allocating resources from several operational programs and a better result in public investments especially due to the synergies generated by the tool locally. A report on new territorial development tools in cohesion policy 2014-2020 (2016) mention that there will be a number of major challanges for the member states, namely the technical and operational capacity of the local actors, the fact that there is no expertise for such a tool, the possibility of generating a dual subordination between local actors and central entities, and not least, the possibility of noticing discrepancies regarding the local implementation strategy, programmatic policies at operational program level, and the visions of implementation of other stakeholders.
ITI in the European Union
The approach of the Member States towards ITI is one that leans towards urban development. Specifically, most Member States consider ITI as a tool more specifically tailored to the needs of urban development. However, not all Member States have opted for the integration of an ITI system in the structural funds for the period 2014-2020. Thus, out of all Member States, 19 states have chosen to use ITI, of which 14 targeted the ITI use for sustainable urban development.
In the report made by Ruţa Tomašić (2016), it is mentioned that the situation varies from country to country in terms of number of ITI established, with countries that have opted for one (1) ITI, such as Romania, and countries which opted for approximately seven (7) such tools, like the Czech Republic. There are considerable differences in terms of allocations from country to country. There are Member States which have allocations of more than 1 billion Euros, such as France (1.032 billion Euros), Italy (1.032 billion Euros), Poland (1,990 billion Euros), Czech Republic (1.482 billion Euros), but also states that targeted allocations up to 100 million Euros, such as the Netherlands (25.4 million Euros), Slovenia (70 million Euros). Note that there is an obvious difference of vision in terms of usefulness, efficiency and effectiveness of the ITI tool for territorial development of regions in the European Union. However, ITI implementation topic, namely sustainable development, is the most prevalent among Member States.
Three (3) Member States have similar approaches in terms of the ITI tool, as all concerned the implementation of ITI in the coastal area. These countries are Spain, Romania and Portugal. One cannot say the same about the financial allocations provided by each state because Romania has provided an allocation of 1.11 billion Euros, Portugal 500 million Euros, and Spain 25 million Euros.
Another indicator proving the vision of implementation is linked to the exposure of the ITI tool in the funds that are the subject of the European Commission’s work. Table 1 shows the exposure chosen by certain Member States.
Table 1: Number of funds that integrate ITI
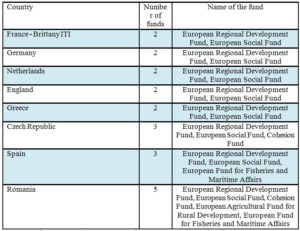
Source: Partnerships Agreements/ Intercommunity Development Association for Danube Delta (IDA DD)
The ITI exposure on several funds affects in a direct manner the implementation process. The number of variables specific to each fund, ensuring the principle of complementarity, diversity of needs in terms of expertise and diversity of local actors are elements which are extremely difficult to manage. Prioritizing interventions and establishing a hierarchy of the projects is much easier to achieve in a narrow exposure about the funds that constitute the policies which affect ITI.
ITI in Romania
Romania has opted for the integration of the ITI tool in the system of European structural funds and investment within the region of the Danube Delta. The reason for which this region was chosen was the rare and isolated population, specialization and economic vulnerability, poor access to public services. The main pillars of development underlying the ITI tool are: sustainable economic development based on a development ecosystem relying mainly on domestic opportunities, including tourism and agriculture, while increasing the quality of life and the environmental protection. All these directions of development require a coordinated and effective institutional structure in order to achieve the indicators established in the ITI.
The institution which acts as an intermediate body for the implementation of an ITI and is recognized by the programmatic documents under EU Regulation no.1303/2013, article 36 is the Intercommunity Development Association ITI Danube Delta (IDA DD). This includes 38 administrative units and a technical apparatus necessary for the administration and execution of projects. ITI allocations of funds 2014 – 2020 ESI is as follows
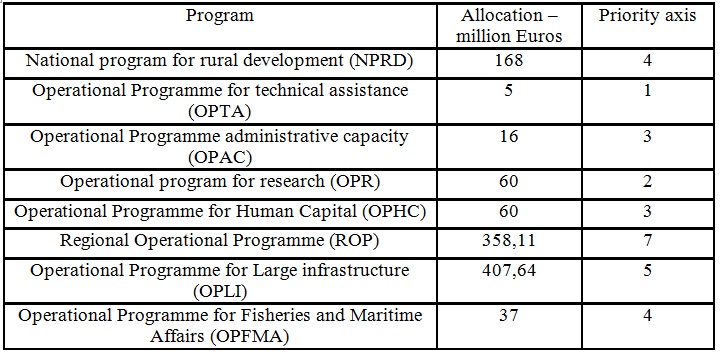
Table 2: Allocation by priority axis
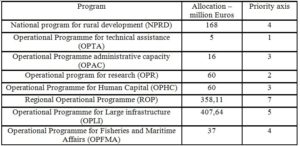
Source: IDA DD
In table 2, it is mentioned that the indicative allocations on development operational programs observe the main pillars established by the Partnership Agreement. 84% of the allocation is aimed at NPRD, OPLI and ROP. ITI Romania has an exposure of 5 European funds and within the Partnership Agreement established between Romania and the European Commission the exposure is aimed at eight operational programs. ITI exposure is targeting priority axis 7 in ROP, 5 in OPLI and 4 in NPRD. Exposure within OPFMA, namely 4 priority axes while the allocation is small compared to other operational programs.
Visions of Implementation of ITI Romania
ITI implementation in Romania got two visions of implementation. A vision has been promoted by the World Bank and the other is governed by the integrated development strategy which was taken over by the ITI governance mechanism. Both visions are anchored mainly on indicative allocations made under the Partnership Agreement. However, discrepancies can be observed regarding the indicative allocations set out in the operational programs and the strategy that led to the approval of ITI. Also, one can observe a consistent antagonistic vision regarding the two-implementation visions of the ITI. The distribution of indicative allocations by priority axes, and how these amounts are planned to be used by the ITI governance mechanism, clearly illustrate what was said above.
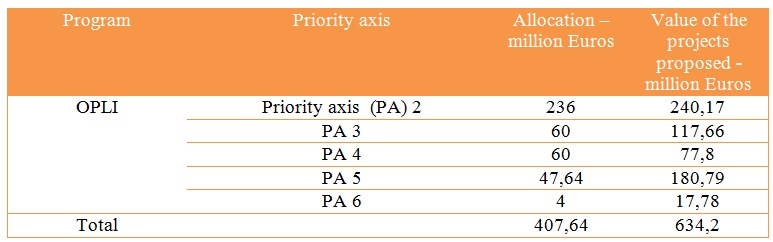
Table 3: Distribution of allocations within OPLI
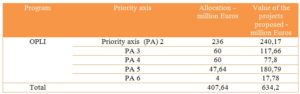
Source: IDA DD
ITI’s development vision promoted by the governance mechanism requires an allocation for a large infrastructure, up to 56% higher than the existing allocation. Breakdown of needs in terms of large infrastructure reveals a need for a mechanism of governance as high as 279% for the adaptation to the climate change, 96% for basic infrastructure aimed at efficient management of resources and by 345% for clean energy and energy efficiency to support a low-carbon economy.
Table 3 is showing the discrepancy between the vision promoted in the Partnership Agreement and the governance mechanism because although the environment is a variable of ITI implementation, the indicative allocation to promote clean energy represents 0.98% of the allocation for the program targeting the big infrastructure projects, and the needs transposed in projects by the governance mechanism are 4 times higher.
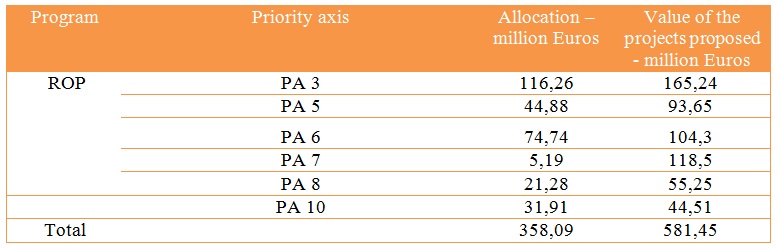
Table 4: Distribution of allocations within ROP
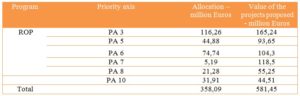
Source: IDA DD
The situation is similar regarding the business environment, tourism or public service infrastructure in the region covered by ITI (Table 4). Needs transposed into governance mechanism projects aimed at a financial need of 581.45 million Euros, by 62% higher than the indicative allocation. Analyzing matters according to needs, it can be seen that the conservation of the cultural heritage was subjected to project planning covering 209% of the indicative amount allocated, and the needs of social infrastructure and health were subjected to project planning whose value covers 260% of the amount allocated. A very interesting question regards the allocation from the Partnership Agreement that relates to sustainable tourism development as it relates to 1.45% of the indicative allocation and the governance mechanism concerns a value 22 times higher. The discrepancy arises given that tourism is the main pillar of the territory development covered by ITI, and yet the financial allocation for tourism investment is small.
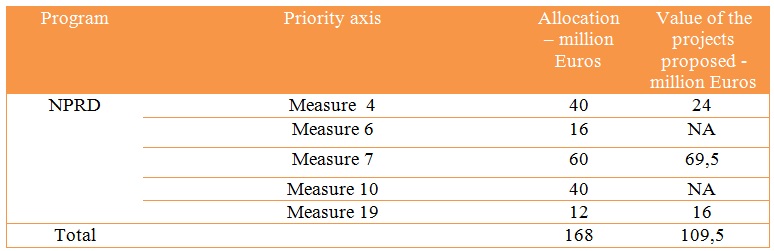
Table 5: Distribution of allocations within NPRD
Source: IDA DD
As regards rural development and agriculture, the situation is completely different from the above mentioned operational programs. Governance mechanism concerns projects worth 65.18%, except the payment of the grant (Table 5). This shows a discrepancy given that most of the territory which is covered by the ITI is predominantly rural. Within the program the mechanism of governance covers the allocations aimed at local development and basic services for villages but does not pay any real interest for investment in fixed assets aimed at developing agriculture, although agriculture, along with tourism are the pillars of the development strategy mentioned in the programming documents.
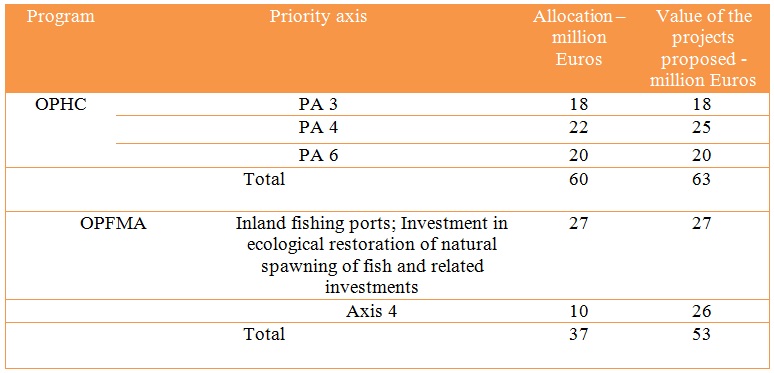
Table 6: Distribution of allocations within OPHC/OPFMA
Source: IDA DD
One of the programs where there is a correlation between indicative allocation and values planned by the governance mechanism is OPHC. The only difference is regarding social inclusion and combating poverty. The situation is not the same about investments in interventions aimed at fisheries and aquaculture. In these types of interventions we notice a greater need, by 160% higher than the initial allocation (Table 6). Economic diversification and sustainable exploitation of resources in this sector are eligible activities in the case of axis 4, benefiting from a too small allocation for the needs of the ITI covered territory.
Table 7: Distribution of allocations within OPR
Source: IDA DD
The situation of the program aimed at research, development within the region covered by ITI falls within most trends of the operational programs. In a region that needs to reorient itself in structural terms while keeping the pace with the dynamic of the production factors, allocations for research and development are almost twice lower compared to the needs of the governance mechanism. For example, the ICT-related needs are 2 times higher than the indicative allocations, while the territory covered by ITI comprises many areas completely isolated (Table 7).
Discrepancies between the Approach Proposed by the World Bank and the One Proposed by the Governance Mechanism
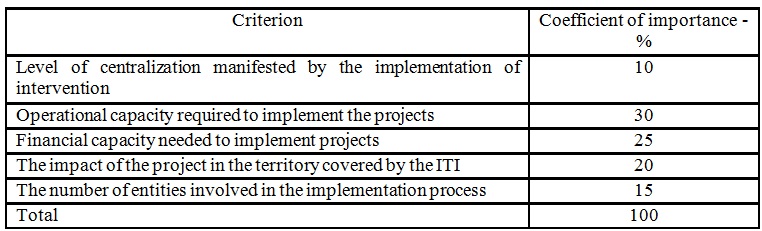
In order to identify differences in approach between the two visions of implementation of the ITI, the number of projects proposed by the mechanism of governance was analysed in comparison with the one proposed by the World Bank. Both development visions involve a synergy between the EU Strategy for the Danube Region, the Partnership Agreement and the local development strategy aimed at ITI Danube Delta. The differences in approach between the vision proposed by the World Bank and the governance mechanism involves analyzing two types of criteria, as follows: number of projects proposed to be implemented by each vision corroborated and the difficulty of the intervention at each operational program that finances the ITI measured through an indicator of difficulty. To measure the difficulty of interventions for each operational program, 5 criteria have been established, characterizing the difficulty of intervention as follows: level of centralization manifested by implementing the intervention, operational capacity necessary to project implementation, financial capacity necessary to project implementation, impact of the project at the level of the territory covered by the ITI, the number of entities involved in the implementation process. To each criterion was assigned an importance factor listed in Table 8:
Table 8: Importance criteria
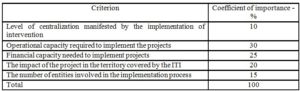
Source: data processed by the organization
Each priority axis involving ITI allocations will receive a score from 1 (lowest) to 10 (highest), score which will be multiplied by the coefficient of importance related to the above mentioned criteria. In order to grant the score from 1 to 10, a number of factors were taken into account, as follows: the experience of the 2007-2013 programming period, the number of documents necessary for the implementation period of the project, during the project implementation period approving the project, the number of beneficiaries of the project. These criteria characterize each project subject to ITI and were taken in consideration when the scores were awarded for the index of difficulty. To calculate the index of difficulty at the level of operational program, the arithmetic average of the coefficients of difficulty was calculated within each priority axis. The rationale of such algorithms is aimed at corroborating the difficulty of the intervention with the number of projects proposed by the World Bank and governance mechanism.
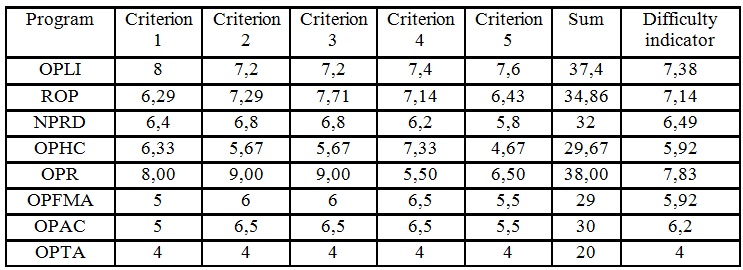
Table 9: Difficulty indicator
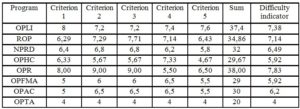
Source: data processed by the organization
According to Table 9, in terms of operational program level, OPHC is the program with the highest level of difficulty. Interventions targeted by this program involve high-quality expertise, specializing in innovation and research activities. Given the specificity of the territory covered ITI, this type of expertise is difficult to integrate. Another program with high difficulty level is OPLI; it relates to a large financial allocation for a long period and consistent implementation period, in addition to a substantial logistic factor. Immediately below OPLI, in terms of difficulty, there is OPR, aimed at developing the local infrastructure and business environment.
Analysis by Number of Projects
Analysis of the number of projects proposed is a very important consideration element because it comes down to the characterization of the process of implementing the ITI tool. The specific features of each operational program, needs in terms of expertise and capacity are elements that affect the process of implementing the integrated territorial investments and these are thoroughly analyzed.
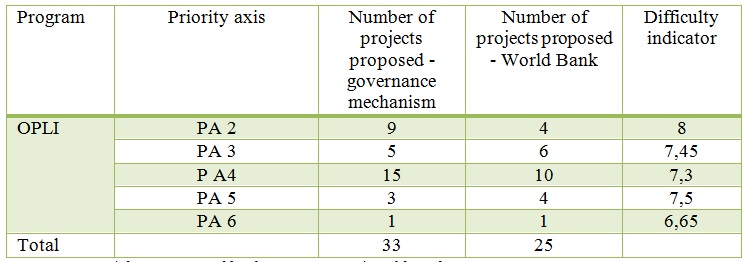
Table 10: Number of projects correlated with difficulty in OPLI
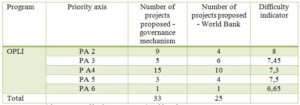
Source: IDA DD / data processed by the organization/World Bank Report
The data from table 10 proves that there is a significant difference in terms of the number of projects proposed. The level of centralization of the vision proposed by the World Bank is higher than the one of the vision proposed by the government mechanism. Thus the vision of the World Bank suggests a larger number of projects for the Priority Axis 3 and 5. Overall, the number of projects proposed by the governance mechanism is 33, and the World Bank proposes a number of 25 projects. There is a remarkable difference in vision in terms of projects with a difficulty index of 8, as the governance mechanism is proposing a much larger number of such projects, the same being the case with the difficulty index of 7.3.
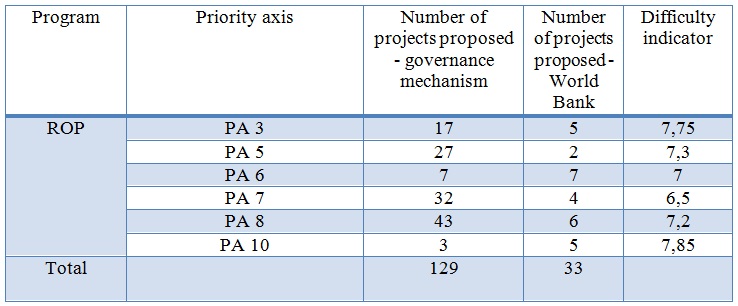
Table 11: Number of projects correlated with difficulty in ROP
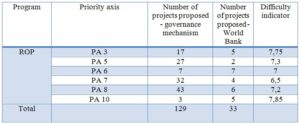
Source: IDA DD / data processed by the organization/World Bank Report
Differences in vision regarding the regional infrastructure projects are clearly revealed by the number of proposed projects (Table 11). The mechanism of governance proposes a total of 129 projects, while the World Bank proposes a number of 33 projects. It is more than obvious that the governance mechanism has an approach targeting the local stakeholders, namely a decentralized approach. Cultural heritage (indicator of difficulty 7.3), diversification of the economy highlighting tourism (indicator of difficulty 6.5) or social and health infrastructure development (indicator of difficulty 7.2) recorded the largest number of projects proposed. The large number of projects proposed by the mechanism of governance ensures greater adaptability related to local characteristics but requirements in terms of operational capacity are much higher.
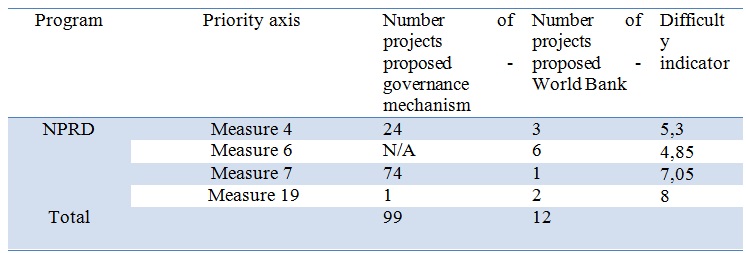
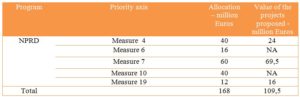
Table 12: Number of projects correlated with difficulty in NPRD

Source: IDA DD / data processed by the organization/World Bank Report
The number of projects proposed by the governance mechanism is higher by more than 87 projects than the one proposed by the World Bank (Table 12). The approach proposed by the World Bank is aimed at limited involvement of stakeholders and a more centralized approach with regard to rural development and agriculture. For example, for basic services in terms of village renewal in the area covered by ITI, according to the mechanism of governance, there are 74 projects planned, while the World Bank aims to implement just one project for the entire area covered by ITI. The indicator of difficulty for interventions aimed measuring 7 is the highest in the program. The decentralized approach proposed by the governance mechanism is a risky one, given that the capacity of local stakeholders in rural areas is very low.
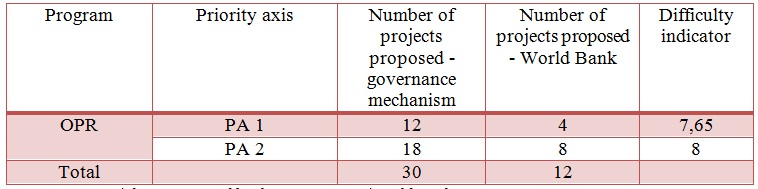
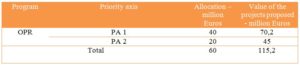
Table 13: Number of projects correlated with difficulty in OPR
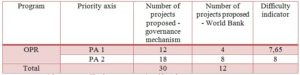
Source: IDA DD / data processed by the organization/World Bank Report
Interventions aimed at innovation and research in the territory covered by ITI involve the completion of 30 projects in terms of planning made by the governance mechanism, while the World Bank proposes instead a number of 12 projects (Table 13). OPR is the program with the highest indicator of difficulty; this is clearly evidenced by the small number of projects proposed to be made by both visions of implementation. However, the mechanism of governance proposes a larger number of projects, at least 2 times bigger than the one proposed by the World Bank
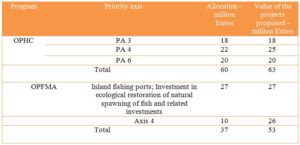
Table 14: Number of projects correlated with difficulty in OPHC
Source: IDA DD / data processed by the organization/World Bank Report
The vision proposed by the World Bank for human capital assumes the realization of 20 projects, mostly aimed at social inclusion, poverty and education (Table 14). The approach of the governance mechanism aims at 70% of projects on education, with just one project on workplace and only 2 on poverty. Notice that the two visions are considered structurally different in terms of the labor market. However, the World Bank suggests a larger number of projects for this program, which records an indicator of difficulty below the vision of the governance mechanism.
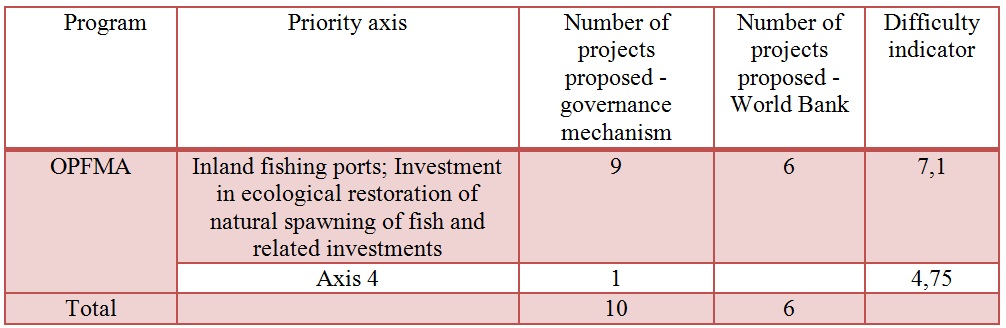
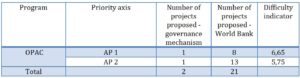
Table 15: Number of projects correlated with difficulty in OPFMA

Source: IDA DD / data processed by the organization/World Bank Report
Addressing investments in aquaculture or reconstruction of fish natural spawning is developing a series of interventions of similar approach, both in terms of the vision of the World Bank and in terms of the vision of the mechanism of governance (Table 15).
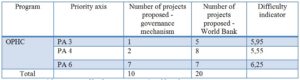
Table 16: Number of projects correlated with difficulty in OPAC
Source: IDA DD / data processed by the organization/World Bank
There are major differences of vision in terms of strengthening public institutions responsible for implementing the ITI tool. Addressing this operational program contradicts both visions of development as it is in opposition with the major pillars of each of the visions of development. The vision proposed by the governance mechanism comprises only 2, while the number of projects proposed by other operational programs with big difficulty indicators is high (Table 16).
At the same time, the vision proposed by the World Bank requires a centralized approach of the interventions related to other operational programs, and the approach of the OPAC program requires a large number of projects. Given that in the territory covered by ITI there are 38 ATUs, approaching the interventions of this operational program is considered structurally different in terms of the two visions of development but also in contradiction with each vision implemented within this document.
Conclusions
The future of Cohesion Policy can integrate a tool like ITI. Features of this tool allow the integration of the territoriality in the organization and implementation of Structural Funds system. The novelty of the tool requires a process of analysis that is consistent regarding the manner in which it is integrated in the Partnership Agreement 2014 -2020, and the characteristics of the synergy between the programming, implementation strategy and vision stakeholders. Following this process, we identified a number of elements that prove a major discrepancy between the different visions concerning the implementation of ITI in Romania.
A first set of discrepancies is aimed at the Partnership Agreement and vision related to the implementation linked to the mechanism of governance. Financing needs are much higher compared to the indicative allocations. Regarding specific allocations for pillars of the strategy such as tourism, environment or cultural heritage, they are much smaller than the value of the proposed projects to be carried out according to the mechanism of governance. Regarding the differences in vision based on the number of projects proposed to be achieved, we identified two structurally different visions. The governance mechanism proposes a decentralized approach based on a large number of interventions with great difficulty indicator that count on a consistent management capacity of local actors. World Bank proposes a centralized vision based on a number of projects three times lower than that proposed by the governance mechanism, where the number of interventions of high difficulty is lower compared to the number of low difficulty interventions. Also, the situation in Europe, including within Member States, shows clearly that there is no generally accepted view on the implementation of ITI even within some Member States, such as Romania.
(adsbygoogle = window.adsbygoogle || []).push({});
References
Barca F, (2009), An Agenda for a Reformed Cohesion Policy, A Place-Based Approach to Meeting European Union Challenges and Expectations, DG REGIO
Ministry of European Funds, (2015), Operational Programme for Human Capital 2014 – 2020, Romania
Ministry of European Funds, (2015), Operational Programme for Large infrastructure 2014 – 2020, Romania
Ministry of European Funds, (2015), Regional Operational Programme 2014 – 2020, Romania
Ministry of European Funds, (2015), National Program for Rural Development 2014 – 2020, Romania
Ministry of European Funds, (2015), Operational Program for Research 2014 – 2020, Romania
Ministry of European Funds, (2015), Operational Programme Administrative Capacity 2014 – 2020, Romania
Ministry of European Funds, (2015), Operational Programme for Technical Assistance 2014 – 2020, Romania
Ministry of European Funds, (2015), Operational Programme for Fisheries and Maritime Affairs 2014 – 2020, Romania
Partnership Agreement 2014-2020, (2014), Romania
Ruţa Tomašić, (2016), Report on new territorial development tools in cohesion policy 2014-2020: Integrated Territorial Investment (ITI) and Community-Led Local Development (CLLD) (2015/2224(INI)), Committee on Regional Development
Territorial Agenda of the European Union 2020, (2011), Towards an Inclusive, Smart and Sustainable Europe of Diverse Regions. Agreed at the Informal Ministerial Meeting of Ministers responsible for Spatial Planning and Territorial Development, Gödöllő
World Bank, (2015), Diagnostic report for the Danube Delta Region,
World Bank, (2015), A Vision Statement for the Danube Delta Region
World Bank, (2015), Formulation of ITI proposal for the Danube Delta (for the 2014-2020 programming period)
World Bank, (2015), Action Plan including priority projects to implement the Strategy for the Danube Delta Region
World Bank, (2015), Needs Assessment Report for the Danube Delta Region