Introduction
There has recently been a lot of lively discussion about the measurement of social welfare beyond GDP. In this context, Stiglitz Report (Stiglitz et al., 2009) can be viewed as a summation of the earlier efforts to meet the needs and challenges involved. Besides economic indicators which have to be taken into account in assessing welfare, there have been increasingly prominent environmental and social ones adding further important dimensions to reckon with.
It has been increasingly often the case that the practice of economic policy will be facing a demand for meeting multiple, at times “incompatible” goals. By way of example, one might refer to the requirements of the Strategy Europe 2020 that establishes benchmarks for social and environmental dimensions under the conditions of steady economic growth. Given this, theoretical support for decision making processes cannot proceed any more from merely proportional indicators related to the objectives that may necessitate conflicting actions.
In this paper, we focus on the environmental aspects and social dimensions of the economic growth. The method of evaluating an individual country´s performance – data envelopment analysis (DEA) – we have chosen to employ a simultaneous assessment of economic (technical), environmental, and social dimensions. The DEA method allows one to get around certain shortcomings of parametric methods, namely those of dealing just with single output in a production function and a need for prices of inputs and outputs as aggregating weights.
We proceed as follows. In Section 2, we concern ourselves with the theoretical definitions of the concept of efficiency. Further, there follows the description of the measurement method as an application of linear programming, the SBM model gets herein our particular attention. This section also outlines the strategy of modeling. Section 3 dwells on the results of and comments on the actual empirical analysis, while the conclusions in Section 4 summarize the main achievements.
Measuring Efficiency
Concept of Efficiency
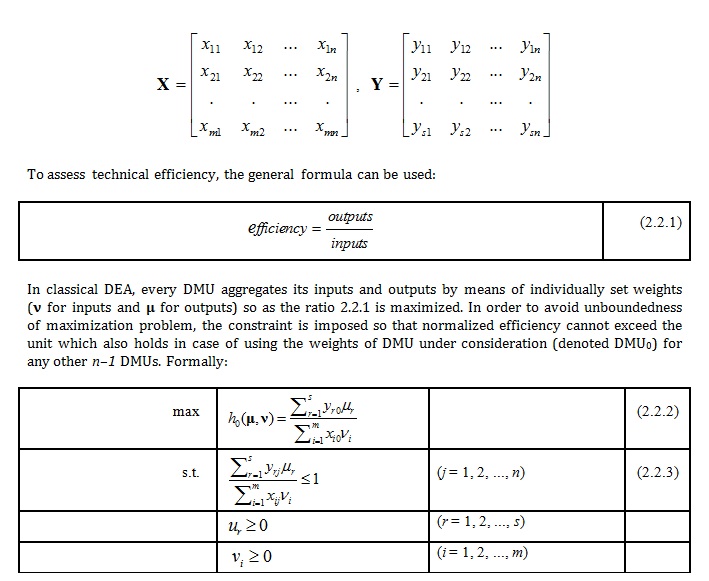
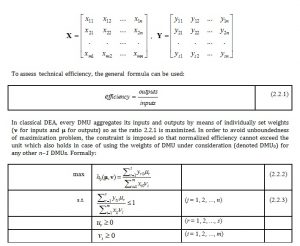
The concept of efficiency is quite intuitive. Purely technical efficiency refers to the way of transforming inputs into desirable outputs, e.g., such as GDP. The concept in question may also be adopted to evaluate other types of transformation which take place alongside a purely technical production process. Thus, the production of GDP can equally be viewed as involving other inputs related to other than those found within technical sphere. In this context, the environmental and social ones have become of most interest and significance in the current welfare discourse. The efficiency of transformation processes can be evaluated by setting outputs against the inputs employed. Data envelopment analysis manages to circumvent some difficulties linked to the absence of aggregating weights needed to sum up inputs or outputs which could be measured in different units. Thus, one obtains a measure for assessing efficiency by relating virtual outputs to virtual inputs employed. This approach is applicable across a variety of settings.
We seek to carry out the evaluation of the overall “social welfare” efficiency by decoupling economic performance and social well-being. Within social well-being, we further differentiate between its environmental and social aspects. The separate “eco” dimension refers to environmental damage resulting from economic activity which cannot be disregarded in assessing the overall welfare. The concept of eco-efficiency emerges, then, as the outcome of the heightened awareness of the raw fact of life that economic values are produced within the subsystem of ecosphere, therefore, they cannot be attributed a value just of their own. Likewise, “social” efficiency attempts to evaluate the social effects of the burgeoning production of economic value, which, unfortunately, often goes hand in hand with income inequality and heightened crime levels, on the one hand, yet availability and accessibility of a better health care and education, on the other hand. So then, the indicators of social dimension can be construed as inputs into transformation process resulting in the production of economic value (GDP).
We thus obtain three efficiency measures for assessing technical, environmental, and social dimensions of social welfare. In Pareto – Koopmans interpretation borrowed from the production theory, eco-efficiency and social efficiency will mean the production of certain amount of outputs using certain amount of inputs with no possibility of increasing any desirable output or decreasing any undesirable output while keeping inputs fixed.
Measurement of Eco- and Social Efficiency
The above-mentioned considerations need to be operationalized. To begin with, measurement of efficiency should be introduced. There are several approaches leading to identical evaluation in the form of a linear program. To follow one of them, let´s organize the data and give some definitions.
Economic subjects under examination are called DMUs (Decision Making Units) to reflect their independent economic behavior. Let us assume to have n DMUs transforming m inputs into s desirable outputs. Inputs are organized in the matrix X, element xij meaning amount of input i used by DMU j, and the similar way in the output matrix Y.
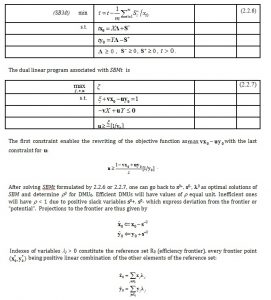
The fractional program can be transformed into the linear one called CCR model (proposed by Charnes et al, 1978) which was first to evaluate performance in a non-parametric way.
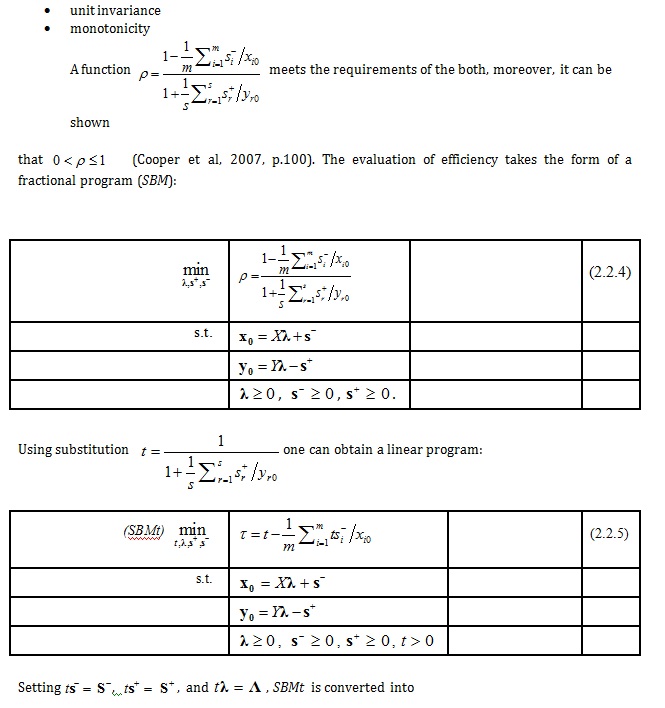
The basic model has been improved and modified in many ways since then. The slack-based model (SBM) by Tone is one of the powerful developments enabling the capture of all sources of inefficiency. The objective function has two important properties:

Returns to scale might cause significant differences in case of evaluating efficiencies of the DMUs showing considerable range of size. The question of optimal scale and scale efficiency arises. The DEA programs considered so far have assessed constant returns to scale (CRS) efficiency. As proposed in Banker et al. (1984), one can impose the assumption of variable returns to scale (VRS) by adding constraint on λ in the form of eTλ=1 to the primal problem.
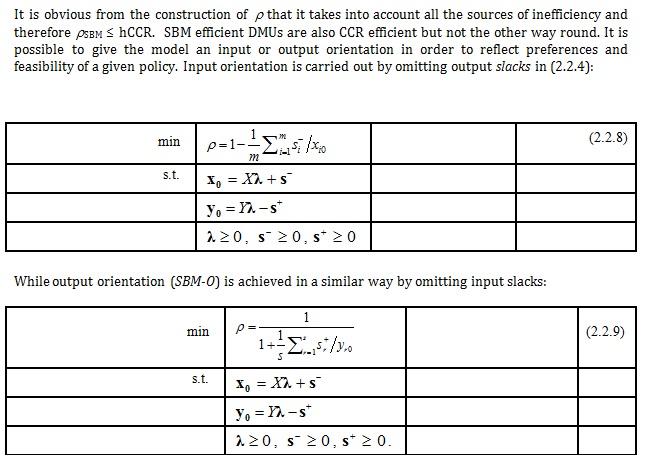
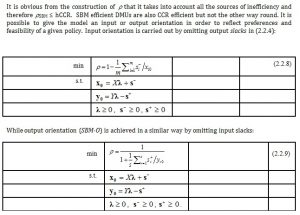
Once the measure of efficiency has been defined, one can set out to evaluate efficiencies in the earlier indicated three dimensions. Individual European countries will be considered as 28 DMUs. As the concept encompasses all the three dimensions, it is but natural to view evaluation as consisting of three separate parts corresponding to economic, “ecological” as well as “social” legs of performance. Now the economic performance comfortably lends itself to being evaluated under the classical approach to technical efficiency as outlined above. The remaining two dimensions can also be assessed by means of employment of an SBM, with GDP acting as an output though produced by using different types of inputs. There is no way to avoid undesirable outputs in transformation processes and these are to be taken into account in performance assessment. We suggest modeling undesirable outputs as inputs, which is in line with the work of Korhonen and Luptáčik (2004), where such specification is justified along with the assumption of strong disposability of outputs. Input orientation of our models reflects the objective of inputs’
improvement (or, put differently, reduction of undesirable outputs) rather than the ambition of producing more economic value. So, the model denoted as tech gives values of technical efficiency and evaluates the use of capital and labor for producing output, the model eco provides information on the efficient (i.e., the least possible) “use” of emissions, and the soc model serves to describe the use of social “inputs”. Our modeling follows a “pure ecological efficiency” approach suggested by Kuosmanen and Kortelainen (2005). Each model gives values describing one of the three dimensions. To obtain the overall indicator, the three values have to be combined in a composite model. Such model is constructed by taking tech, eco, and soc scores as outputs for the composite output oriented model, inputs being equal unit. The resulting SW score could be seen as a measure of social welfare.
Empirical Analysis
Data and Models Employed
As far as the empirical analysis is concerned, data availability has been the main determining factor for selecting and including 28 European countries to stand for DMUs. For tech model, there are two standard inputs – capital stock and labor to produce desirable output (GDP in PPS). Environmental damages are represented by emissions measured in physical units. Eurostat database provides measures of SOx, NOx, non-methane organic gases, NH3, and greenhouse gases emissions (GHG) as well. All of them have been involved in the computations. For soc model, we used selected indicators describing the quality of life: HY – healthy life years (transformed by deducting from 80 to obtain higher values for poor performance), UN – unemployment, POV – number of persons at risk of poverty, and CR –crimes per 1000 citizens.
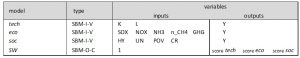
In Table 1, models employed are shown as well as inputs and outputs used in computation. SBM models are given “-C” and “-V” indications of constant and variable returns to scale respectively, and the input /output orientation of the models is indicated by “-I /-O”. As our dataset comprises economies of considerable variety of size, we assumed various returns to scale.
Table 1: Overview of the models employed
Results
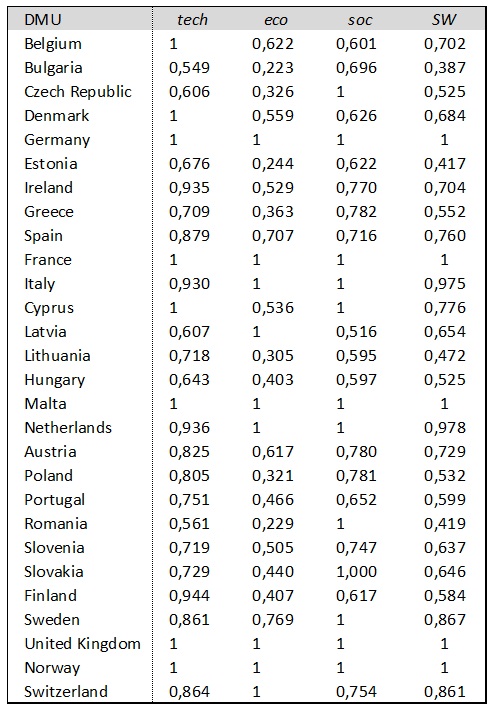
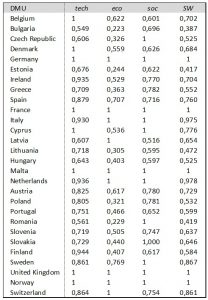
As Table 1 exhibits, four DEA models – tech, eco, soc, and the composite SW – have been computed. The models offer the following picture of social welfare efficiency (SW-efficiency) of the European countries (Table 2).
As it is readily seen, one can speak of five SW-effective countries that make up a SW-efficiency frontier: Germany, France, Malta, the United Kingdom, and Norway. They are also efficient in all the three components, which is obvious from the scores equal unit. Italy and the Netherlands find themselves
quite near the frontier, both losing score in the tech part. Romania and Bulgaria end up at the opposite, deficient, end. In-between, you recognize the remaining European countries, the more advanced Western economies gaining higher scores. Two figures might look a bit puzzling – poor Finland´s overall score and Romania´s soc efficiency of 1. Yet a closer look at the results of the computation and model specification account for the deceptive inconsistency. The thing is that each of the three dimensions can be examined separately so as to identify the sources of inefficiency. This is enabled by the decomposition based on expression 2.2.8.
Table 2: Tech, eco, soc, and SW scores
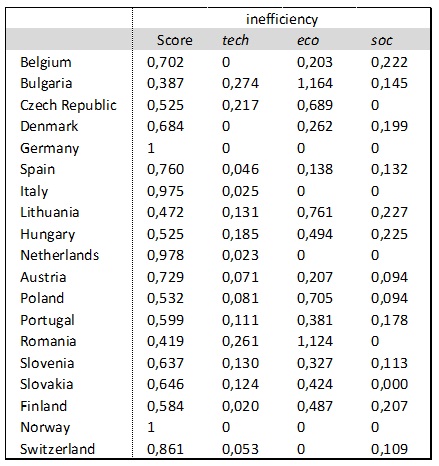
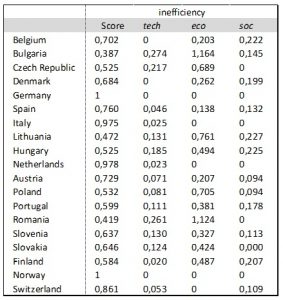
A closer look into the particulars of the inefficiency sources is capable of revealing the decomposition of the efficiency indicator. The objective function of SBM-O expressed by 2.2.8 is constructed to penalize inefficiencies by aggregated output slacks relative to corresponding output: . So one can consider ratios , r = 1… s as the contribution of the output r to the total penalty in SW output-oriented model. Thus, one can compare input inefficiencies (dimensions) as to their relative size. Table 3 shows the decomposition of the SW scores of the selected countries.
For SW-efficient countries like Germany, there is obviously no room for improvement. SW-inefficient countries show no clear-cut patterns regarding sources of inefficiency, some similarities, though, are discernible. Belgium and Denmark are proportionally losing points in eco and soc dimensions, while being technically efficient. All inefficient countries feature most of SW inefficiency coming from the ecological component.
Table 3: Decomposition of SW scores
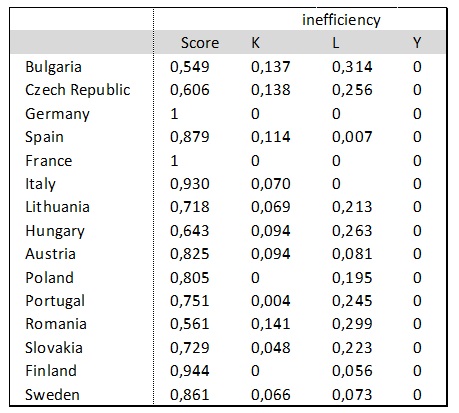
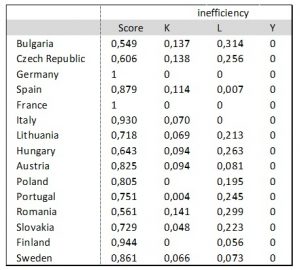
It is possible to go into more detail exploring the individual dimensions by the decomposition of the scores obtained by input-oriented sub-models. The term in the objective function penalizes excessive inputs so every component i=1, …, m can be viewed as the contribution of i-th input to overall penalty. In the tech part, one may distinguish a pattern of excessive labor use, which is the case of Slovakia, Slovenia, Poland, Portugal, and Lithuania. On the other hand, some over-capitalization characterizes Italy and Spain (Table 4).
Table 4: Decomposition of tech scores
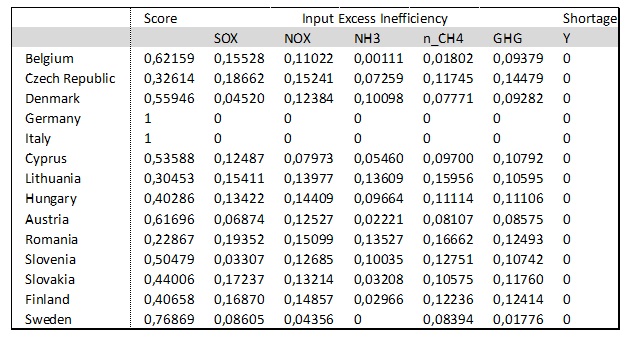
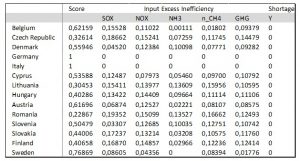
The ecological component is examined identically, with the results shown in Table 5. There are seven eco-efficient Western economies – Germany, Italy, France, the Netherlands, Malta, the United Kingdom, Norway, and Switzerland, which, obviously, display no sources of inefficiency in their respective inputs. As for the other countries, it is possible to point to conceivable sources of reasonable improvement. In this sense, as quite a surprise there comes Finland´s eco score of 0,406, also to indicate avenues of possible improvement with respect to all types of emission, excluding NH3. Yet, any pattern in the structure of inefficiencies within this dimension is hardly identifiable.
Table 5: Decomposition of eco scores
Finally, we turn to the decomposition of the social component of SW score to find out that, as Table 6 shows, some similarities among the countries do exist. The eleven countries, whose unit soc scores can be seen in Table 2, proved to be soc efficient. Quite unexpected was unit soc score of Romania that has benefited most from the low unemployment rate (7,6%) and the low value of crime indicator, though reporting the second worst “at-risk-of-poverty” data.
Table 6: Decomposition of soc scores

The surprisingly low soc score of Belgium is explicable by one of the highest crime levels of the country. The evaluation of this dimension will, however, require redesigning since the findings seem not to mirror the actual state accurately enough.
Conclusion
To take stock, we have been seeking to demonstrate that DEA modeling can prove a useful tool in identifying the pockets of inefficiency in the appropriately defined framework of relevant inputs and outputs. The SBM model seems particularly effective as, under the variable return to scale assumption, it is capable of capturing all sources of inefficiency. A closer analysis of the results achieved may well prompt a deeper insight into the issue of social and eco-efficiency that will inevitably crop up in case of pursuing distinct multiple goals of economic policy, e.g., meeting benchmarks defined by Europe 2020 without compromising steady economic growth.
The exploration of the dataset of the 28 European countries has revealed varying degrees of heterogeneity in their technical, environmental, and social dimensions as well as the sources of respective underperformance. As the results obtained through the employment of the selected VRS model show, five advanced countries – Germany, the UK, Norway, France, and Malta – have proved SW-efficient, forming thus the efficiency frontier. Romania and Bulgaria have found themselves at the very bottom of the SW-efficiency scale.
The issue, though, still leaves some room for reasonable discussion, e.g., about the relevance or sufficiency of the indicators chosen, above all, those for measuring the efficiency within the social area. Nevertheless, our belief is that this piece of research may encourage a finer and more responsible approach to sorting out the issue of complex transformation process efficiency evaluation. This said, it is primarily the decomposition of efficiency indicator that policy makers might find a welcome and helpful qualitative tool. Specifically, it fairly comfortably lends itself to the task of identifying major bottlenecks on the way towards growth-oriented performance of national industrial technospheres without, simultaneously, losing sight of further concomitant goals of economic policy pressingly calling for attention and fulfillment.
(adsbygoogle = window.adsbygoogle || []).push({});
References
- Banker, R., Charnes, A. and Cooper, W. (1984), ‘Some models for estimating technical and scale inefficiences in data envelopment analysis,’ Management Science. (30), 1078–1092.
- Charnes, A., Cooper, W. and Rhodes. E. (1978), ‘Measuring the efficiency of decision making units,’. European Journal of Operational Research, (2), 429-444.
- Cooper, W., Seiford, L.M. and Tone, K. (2007) Data Envelopment Analysis. A Comprehensive Text with Models, Applications, References and DEA-Solver Software. 2.ed. Springer.
- Korhonen, P. and Luptáčik, M. (2004), ‘Eco-efficiency analysis of power plants: An extension of data envelopment analysis, ‘ European Journal of Operational Research. 154, 437–446.
- Kuosmanen, T. and Kortelainen, M. (2005), ‘Measuring Eco-Efficiency of Production with Data Envelopment Analysis, ‘ Journal of Industrial Ecology 9(4), 59-72.
- Stiglitz, J. E., Sen, A. K. and Fitousi, J.- P. (2009), ‘Report by the Commission on the Measurement of Economic Performance and Social Progress, ‘ [online], [Retrieved February 5, 2013], http://www.stiglitz-senfitoussi.fr/documents/rapport_anglais.pdf