Introduction
According to a recent report by JP Morgan and IHS Markit (2017) on the sensitivity of the market, Mexico contributes 1.5% to the world manufacturing production, currently occupying the number fourteen place globally. This report also mentions that in the following years an increasing trend in world production is expected, and this is beneficial for the country. In Mexico, the manufacturing industry has had an important role in the economic development since the last decade, and has positioned to the country as a leader of certain sectors. This industry has directly and indirectly participated in a large number of economic activities: generation of jobs, transferring of technology, and generation of investments. According to the Manufacturing Industry Monthly Survey (EMIM, 2017), during the period 2016-2017, in Mexico the employment of this sector registered an increase of 3.5%, while the value of production increased by 16%; however, a major concern that could reduce growth in this sector is its costs, as according to the Center for Public Finance Studies (CEFP, 2016) since the end of 2014, the average costs in this sector have increased, presenting an annual growth of 5.62% in June 2016.
For this reason, it is important to analyze the productivity and efficiency of companies in the manufacturing industry. One of the key indicators for this analysis is the determination of economies of scale, which, unlike the reduction of costs due to technological changes, is presented when there is a reduction of costs given a proportional increase in production. Although economies of scale have become a topic of study in various fields such as oil, steel, electric power, airlines, and financial industries, in an environment like the current one it is important to generate analyses on how companies can take advantage of economies of scale and become more efficient, providing added value to the industry of each country.
According to a report by HSBC (2016), the mechanical metal sub-sector has a value of 7 billion dollars annually in Mexico, and is made up of 23,120 companies of which 20,100 are microenterprises. The company analyzed in this study is a Mexican subsidiary of one of the largest machinery manufacturers in Japan, which belongs to this sub-sector and serves as an international provider of engineering solutions.
The hypothesis to prove is whether this company, given its structure of costs and production, incurs economies of scale for one family of products of greater sale in Mexico, being the period to be analyzed from January 2013 to September 2016. Once the presence of economies or diseconomies at scale is determined, an analysis will be performed to determine the causes of this result and provide some suggestions.
The present work makes the following contributions to the literature: initially, it is an article that uses the translog cost function applied to one of the families of products of this company, and secondly, it analyzes the existence of economies or diseconomies of scale in its structure of production, which has not been done in Mexico at the company level.
The remainder of this study consists in five additional sections. In the first section the literature review is presented; then the methodology is described, followed by descriptive statistics. The results are found in the fourth section and in the fifth section the conclusions are found. Finally the references are presented.
Literature Review
In the last decades, the efficiency of production costs has been analyzed in several industries, such as the electric energy industry. Christensen and Greene (1976), in their pioneering study of economies of scale, analyzed electric power companies in the United States by estimating a translog cost function to determine if economies of scale exist in the structure of their production. The authors used a cross-sectional database for the years 1955 and 1970 for 114 companies. The authors found that the decline in the cost of producing electricity in these years was not due to economies of scale but to technological changes in the industry. They concluded that public policies designed to promote competition in this industry do not interfere with economies of scale, so they established that it is not efficient for the production of electric power in the United States to reduce the number of companies.
Clark and Speaker (1994) used data from the income statements and balance sheets of 402 commercial banks in the United States for the year 1989. They estimated a translog cost function to determine if there are economies of scale in the banking industry. The authors found statistically significant evidence that any bank, regardless of the size or products it markets, can achieve greater efficiency through economies of scale by increasing the size of its production, which means that its costs would decrease. The authors suggest that small banks should increase the size of their institution in terms of the products they offer (such as deposits and loans), thus improving the efficiency of their productivity.
In a study by Stratopoulos, Charos and Chaston (2000), 25 companies from the US steel industry were analyzed during the period 1990 to 1992. The authors used a translog cost function for their estimation; they used financial ratios as a proxy variable for the prices of the factors of production. The authors found that the profitability of steel companies is inversely related to operational efficiency, that is, as the company becomes more efficient, indicators such as net income and their respective financial ratios are lower.
Another branch of the same banking industry in which this type of efficiency analysis is carried out is that of microfinance institutions. Hartarska, Shen and Mersland (2013) used a panel database for 69 countries during the period 1998 to 2010, obtained from the MicroBanking Bulletin (MBB). The sample contains 989 observations. The authors evaluated the efficiency of the industry through the estimation of the translog cost function to determine if there are economies of scale in the production of microfinance institutions, as well as the elasticity of substitution of the inputs used in this industry (labor, financial capital, and physical capital). The results indicate that the inputs used are inelastic substitutes, that is, that a great change in the price of one is needed to be replaced by another. It was found empirical evidence that microfinance institutions, regardless of the type of products they manage (loans or investments) can generate significant savings in their costs through the expansion of their production.
Recently Bitzan and Peoples (2016) analyzed information on the costs of 61 companies belonging to the United States airline industry, according to the type of service they offer: low-cost and full-service airlines. They used data from the period 1993 to 2014 to decompose changes in costs and identify which percentage is due to productivity, firm size, technological change, and changes in input prices (such as labor, capital, aircraft fuel and cargo equipment). The authors estimated a translog cost function and found that full-service airlines have experienced decreases of 10% in their average costs, while in low-cost airlines it has increased by 8.5%. As for the decomposition, it was found that for full-service airlines, the increase in the amount of cargo equipment, due to a merger or acquisition, further contributes to the decrease in average costs above the increase in the size of the company. On the other hand, the increase in average costs in low-cost airlines is mainly due to the technological changes used to imitate full-service companies and thus become more competitive.
Methodology
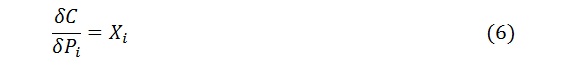
A traditional approach to measuring firm efficiency measured as the presence of economies of scale, as well as estimating the price elasticity of its inputs, involves estimating a function of benefits or costs. In the case of this company, it is more convenient to estimate the cost function rather than the profit function, because in some of the products the company has some market power, its prices being non-competitive, while the price of the inputs is determined by the market (Varian, 1984).
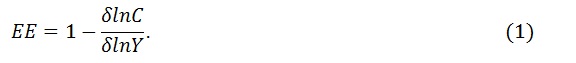
Economies at scale exist in the company if an increase in production results in a less than proportional increase in total cost (keeping everything else constant). The most common way of expressing economies of scale (EE) is as follows:
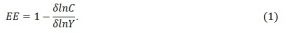
Thus, economies of scale are calculated as 1 minus the derivative of the logarithm of costs relative to output. If the result is positive, it would indicate that the company operates under economies of scale, that is, it has increasing returns to scale; while if the result is negative, there would be diseconomies at scale, where an increase in production results in a more than proportional increase in costs (decreasing returns to scale), and finally if the result is equal to 0, there would be yields constants at scale.
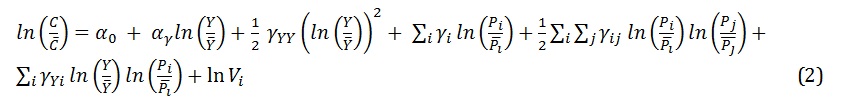
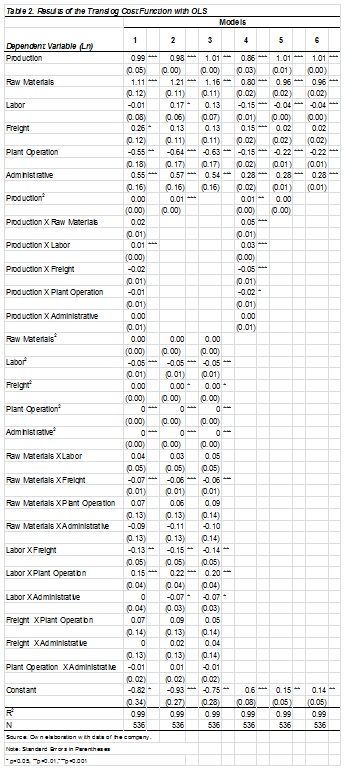
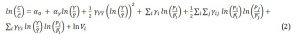
The translog cost function to be estimated will take into account the 21 models of one of the company’s most sold products during the period from January 2013 to September 2016[i], the initial estimation method being Ordinary Least Squares (OLS). The translog cost function to be estimated will be the one used by Bitzan and Peoples (2016), where each variable normalizes with respect to its mean, in order to obtain the first order conditions to obtain the elasticities evaluated in the mean. The function is defined as follows:
[i] Corresponds to the latest available data provided by the company
Variables are defined as: C is the actual total cost[i], Y is the quantity produced, Pi are the input prices: raw materials (M), labor (L), real freight cost (F), actual plant operation cost[ii] (P) and administrative cost (A).
We suppose that and that the error term has a normal distribution with zero mean and constant variance.
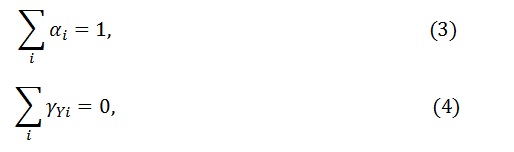
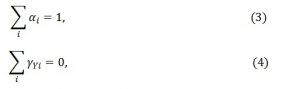
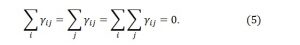
According to economic theory, a homothetic production structure is restricted to being homogeneous[iii] if and only if the cost elasticity with respect to production is constant (Green, 1998). For the translog cost function, the constraints to be homothetic and homogeneous are described as follows:
[i] Base 2010=100
[ii] Includes maintenance, spare parts, consumables (water, electricity, gas), depreciation, quality, etc.
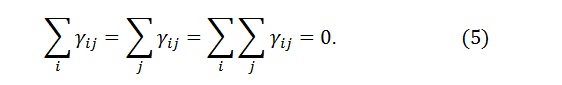
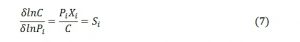
It is also required that the function be symmetrical in the substitution of inputs:
[iii] For a fixed level of production, the total cost must increase proportionally when prices increase
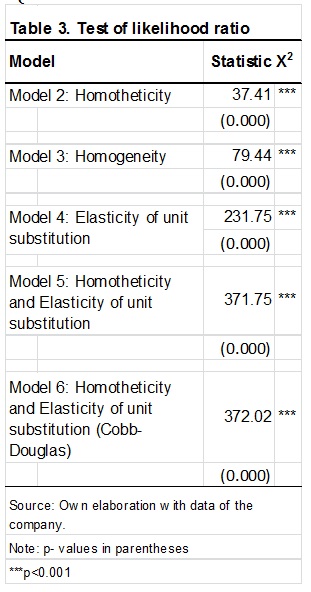
In order to find the best model to determine if the company operates with scale economies, or scale diseconomies, in addition to Model 1 (equation 2), we will additionally estimate 3 econometric models that incorporate the afore mentioned constraints: Model 2 imposes the restriction of homogeneity, Model 3 imposes homotheticity restriction and finally Models 4-6 imposes the constraint of unit substitution elasticity.
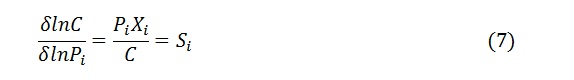
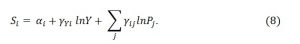
The results obtained from the six models (1-6) present problems of multicollinearity, since the costs of the inputs are related to each other, for which it is necessary to obtain the equations of the participation of the cost of each input. To obtain these equations, it is first necessary to obtain the demand function of the factors of production, which is obtained by differentiating the function of costs with respect to the prices of the inputs. According to Shephard’s Lemma this function is described as follows:

In the logarithmic form it would be as follows:
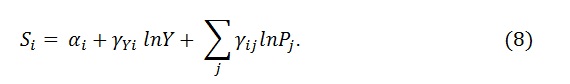
Si indicates the participation of the cost of input i in the total cost. Using the translog cost function, we can estimate the cost-sharing equation as follows:
When all the equations of the inputs involved are obtained, a system of equations formed by equation (2) and (n-1) cost sharing equations (equation 8) will be obtained to avoid perfect colinearity[i]. To improve the efficiency of the parameters, the estimation method will be that of Seemingly Unrelated Equations (SUR) (Green, 1998).
Descriptive Statistics
In order to determine whether the company operated under economies of scale or diseconomies of scale, we proceeded to estimate the translog cost function taking into account the 21 models of one of the products of which the company has the largest sale in Mexico during the period of January 2013 to September 2016. The translog cost function will be initially estimated using the Ordinary Least Squares Model.
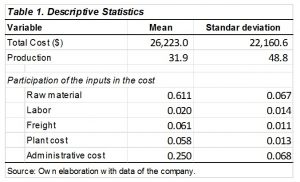
Table 1 presents the descriptive statistics. The average total cost of the period analyzed is $26,223 dollars (base 2010 = 100) with a standard deviation of $ 22,160.6, this standard deviation is presented since the costs vary according to the weight of the model, which ranges from 25 kilograms to 1.5 tons. Production, on the other hand, presents an average of 32 units and a standard deviation of 49.
Regarding the participation of the inputs in the cost, it is important to mention that the company is an assembly company and belongs to the manufacturing industry, it is specific to the metal-mechanical subsector. Its production is carried out with the work of the operators (hours of labor) with minimal robotic intervention, the sample indicates that the participation of this input in the cost is only 2%. Raw material costs represent on average 61% of the total cost. The remainder consists of freight costs, plant costs and administrative costs and will be considered as the part of the variable costs of the technological change.
[i] . The equation that will not be taken into account will be SL the participation of the cost of labor.
Results
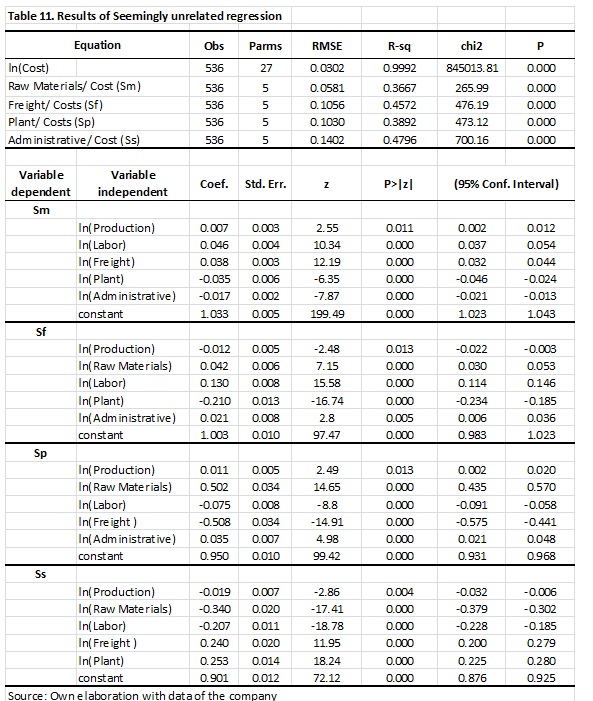
The following table shows the results obtained from the six models. The results of Models 2 and 3 indicate that, because the corresponding parameters (specified in equations 3 and 4) are not significant, none of the constraints is consistent with the firm’s data. We find that the coefficients involved in equation 5 are not significant, which was an expected result, since in the case of this company the production process is manual and costs depend largely on the price of raw materials (Model 4).
According to these results, Model 1 is appropriate for this company, which will be corroborated with the likelihood ratio test when testing each Model (restricted model) against Model 1 (unrestricted model). The results are presented in Table 3.
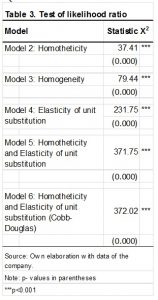
The results indicate that Model 1 is adequate to represent the production structure of this company, rejecting the null hypothesis.
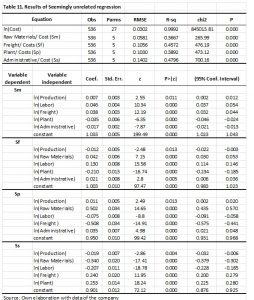
Table 4 presents the results of the SUR Model to estimate the non-homogeneous translog cost function and does not require that the elasticity of substitution be constant (Model 1). The rest of the results are presented in the appendix.
The results indicate that the estimation of the translog cost function shows a good overall adjustment, with an R squared of 99%.
It is found that if the price of raw materials increases by 1%, the total costs of the company increase by 0.95%, while if the administrative costs are decreased by 1%, the total costs would be reduced by 20%. Costs that are less than proportional are labor costs and plant costs, having a coefficient of -0.26 and -0.13 respectively. As expected, the only input that has a direct effect on output is labor. There is also complementarity in labor costs with administrative costs.
From equation (1) we find that the coefficient of lnY is 1.00 and replacing it in the formula EE is 0, which indicates that this company operates with constant economies of scale so doubling the production requires doubling the costs.
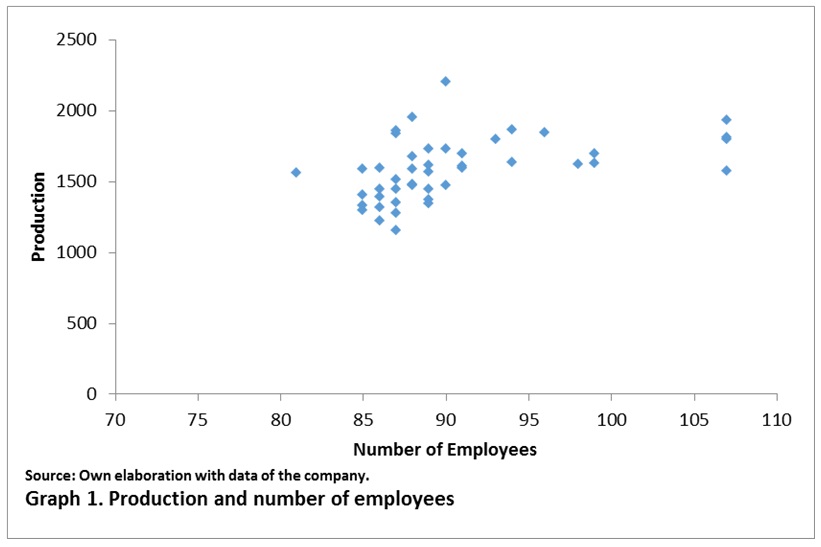
The ideal for any company is to operate under economies of scale, which means that the total cost begins to decrease as production increases. According to Pindyck and Rubinfeld (2013), there are 3 possible ways in which a company could operate with economies of scale: the first is that if the company operates on a large scale, workers could specialize in the activities in which they could be more productive, for this, at least in the short term, the space of the factory and the machinery should be adequate for the workers to do their work effectively. In the case of this company, the use of machines is minimal, so it will be analyzed that the number of employees is appropriate given the physical space and also their productivity. According to the theory of production, there are an optimal number of workers that minimize costs and this occurs at the point where the marginal product must be equal to the average product.
Graph 1 shows the relationship between the total monthly production and the number of employees of the company in the period of time analyzed.
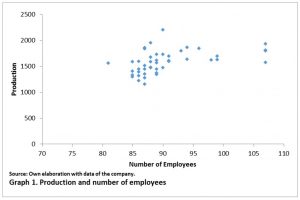
The graph shows that there is a linear relationship between production and the number of workers, so that as the number of workers increases, production will increase at a constant rate. This makes sense since being a company with minimal machinery intervention; its main factor of production is labor, so its capacity is not limited. In economic terms, the average product per worker is equal to the additional production that is generated by hiring an additional worker.
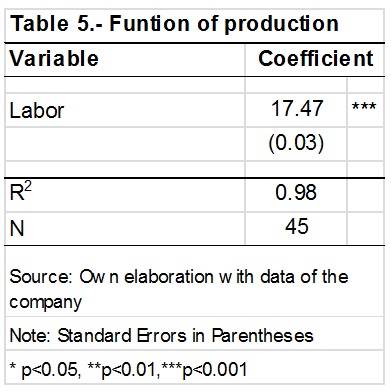
To obtain the average and marginal product of this company, the total production function will be estimated, that is, without considering the type of model to which the product belongs. The period considered is from January 2013 to September 2016. It will be taken into account that as there are no workers, there will be no production, so a model without a constant will be considered
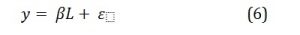
Variables are defined as: y is the total production of the company; L is the number of workers. It is assumed that the error term has a normal distribution with zero mean and constant variance.
The results are presented in Table 5. For each extra worker, the production increases by 17 units on average. We conclude that the marginal product and the average product are equal, and the number of employees is optimal.
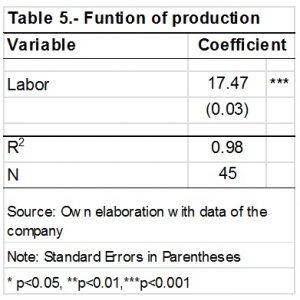
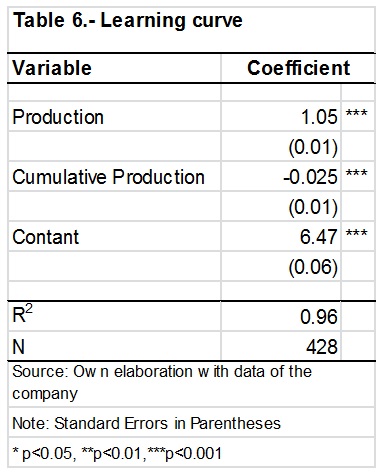
The product is made in three different assembly lines, divided according to the weight of the product and classified in small (from 25 to 60 kilos), medium (from 60 to 350 kilos) and large (from 400 kilos to 1.5 tons). In the case of this company, if workers perform repetitive tasks in each line of assembly, it is very likely that they learn from accumulated experience how to perform their work quickly and efficiently, which in theory means their costs should decrease with experience. To analyze if this is the case of the company, the following learning curve will be estimated for the period from January 2013 to September 2016.

Variables are defined as: C is the actual total cost in month t, n is the cumulative production in month t, and y is the production in month t. It is assumed that the error term is distributed normally with zero mean and constant variance. The results are shown in Table 6:
The results indicate that the parameter of unit cost elasticity with respect to cumulative production is -0.025, and indicates that for every 1% accumulated production increases, the total cost only decreases 0.025%. This would be an area of opportunity for the company, where technology intervention should be considered in terms of automating some processes that reduce costs.
According to Pindyck and Rubinfeld (2013) the second reason why a company can operate with economies of scale is that the management of a company may be able to negotiate the price of inputs for the advantage of operating higher volumes or for an efficient management of its costs. In the case of the company, the raw material is bought from a subsidiary company so there is no negotiation, since prices are determined by the market. In terms of cost efficiency, it was found that this company uses a standard or traditional cost system also known as the traditional cost absorption system. This system is a costing technique employed that seeks a way to distribute indirect costs (Skoda, 2009). Today many companies use this methodology because of their simplicity and good results, and focuses on the distribution of indirect costs (such as consumables, maintenance, depreciation, electricity, water, gas, etc.) using hours of labor or machine time, however, some of the operations can be “punished” at high costs due to this cost distribution. The traditional unit cost perspective used in standard costing is counterproductive because it tends to direct managers’ attention to actions at product unit level to consider a price increase, for example, or to reduce direct labor, the materials or the processing of the machines (Cooper and Kaplan, 1991).
What is proposed to analyze whether management of the company is effective is to compare the current cost method with another method of cost taking into account the level of production of the year 2016 to determine if the company is more profitable to consider a new form of cost which gives more analysis and a perspective focused on seeing the processes individually rather than in general, as does the traditional cost system. Specifically, it will compare the rate of return on sales between both methods of costing. The proposed cost method is Activity-Based Costing (ABC). This method was developed with the purpose of improving the use of accounting information, providing management with a more complete picture, such as determining which product is the most profitable and which ones are the areas of opportunity that require supervision (Tsai, et al., 2009).
Among the main characteristics of the ABC model is the identification of the manufacturing activities and the management of consumption resources of each product. According to Tsai et. al. (2009) in the ABC model, the hierarchy of the company’s activities is composed of the following categories: unit-level activities (according to the product service unit, for example machining, finishing); activities at batch level (according to batch of products or services, for example configuration, programming); activities at product level (made to benefit all units of a particular product or service, for example product design); and activities at the facility level (according to the manufacturing facility or service, for example, plant protection and management).
The form in which the mentioned categories will be taken into account will be to divide the models that are within the same line of assembly. In the company there are 3 assembly lines according to the weight of the model, which are classified as mentioned above in small (from 25 to 60 kilos), medium (from 60 to 350 kilos) and large (from 400 kilos to 1.5 tons).
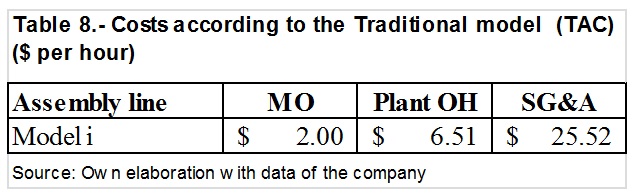
It will begin with the calculation of the standard or traditional costing, for which hourly costs are used. The company calculates the total annual total cost of labor, the total annual cost of plant costs, and the total annual cost of administrative and selling expenses, each of these items being then divided by the total time to be spent to be required for annual production. First, to calculate the cost of annual labor, only the basic salary of the operators will be taken into account, without any provision or extraordinary payment, then the calculation is based on the total number of operators for their annual base salary; Second, for the costs of the plant, all its consumables are calculated on an annual basis to be able to operate. These data involve the finance department, maintenance, production, materials, quality, engineering, continuous improvement and plant management. Finally, to obtain the administration and sales expenses, the finance department meets with the department of marketing, sales and human resources to determine this expense, since it is the departments that contribute intangible resources to the organization and, therefore, independent rate for them.
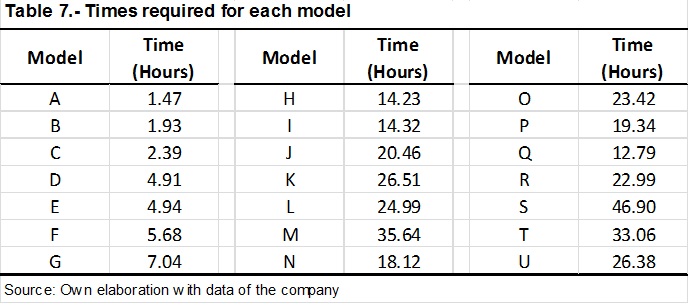
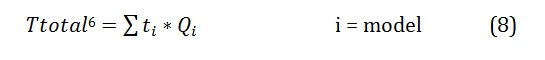
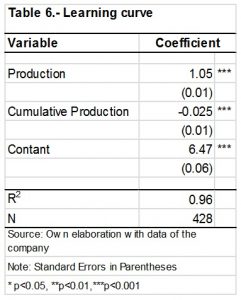
Once the mentioned costs are obtained, it would be necessary to obtain the total time that will be required for the annual production. Table 7 shows the time required for each model.
Then, the required time of each product is multiplied by its volume in the year (in this case 2016) and the results are summed to obtain the total amount of available hours of this year, the formula is presented in the equation:

The result is 61,495.07 hours available.
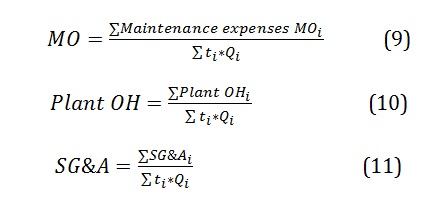
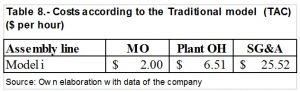
Once the process is completed, the company determines the hourly costs for each model i of labor, plant costs and administration and sales expenses according to formulas 9 to 11. With this methodology, they make sure that the cost incurred annually is distributed and covered in each salable unit:
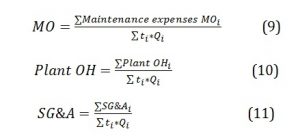
Derived from these calculations will obtain the costing rates for the models:
[1] Ttotal refers to the total time of labor hours available
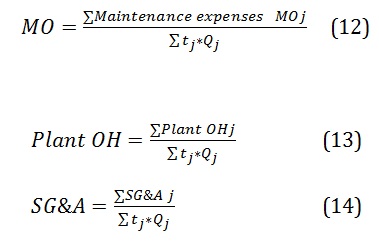
Considering the ABC model, the costs were distributed based on the production per assembly line (j) and the required times of each product:
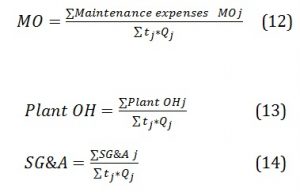
j is the assembly line according to the size of the model (small, medium and large line).
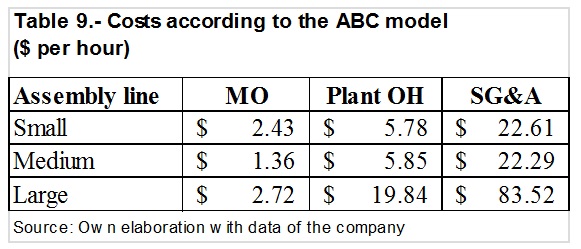
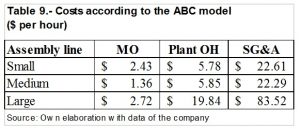
The same operations were carried out for each of the groupings, obtaining the costs presented in Table 9.
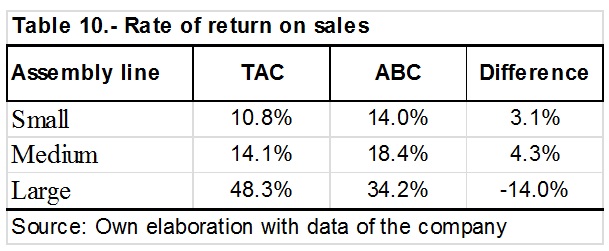
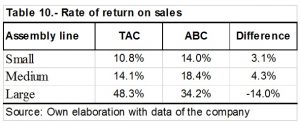
In order to analyze the difference of apportioning costs between all the models (Traditional Model) and the costs grouped according to the assembly line (ABC Model), we will compare the rate of return on sales[i] obtained for which will be taken into account the sales in 2016 and each of the costing methods. Table 10 presents the results.
[i] The rate of return is obtained by dividing the profit on sales.
The results indicate that for models that are manufactured in small and medium assembly lines, considering ABC costing would be beneficial, whereas for large assembly line models it would be the opposite, as these show little sales compared to the other models, and have very high costs, which are amortized using the traditional methodology.
The area of opportunity in this regard is that the company usually sets its prices based on their costs plus a percentage of utility, so the price of large models would be below what it should be.
The third reason a company can operate with economies of scale is that the company must have flexibility in the use of inputs and thus organize its production process more effectively. According to the results obtained in Table 4, it is observed that there is very little substitution between labor and freight (-0.075) and between labor and administrative cost (-0.057). These results indicate that there is no area of opportunity.
Conclusion
The results indicate that given its cost and production structure, in 21 of the models of one of the best-selling products in Mexico during the period from January 2013 to September 2016, the company in this study operates with constant returns to scale.
The elasticities are evaluated in the average value of the sample and indicate the raw materials have a more than proportional effect because if their price increases by 1%, the costs of the company would increase by 0.95% and if the administrative costs decrease by 1%, total costs would be reduced by 20%.
According to Pindyck and Rubinfeld (2013), there are 3 reasons why a company can operate with economies of scale, which were analyzed to find the areas of opportunity for the company to reduce costs as production increases. It was found that in two of the three reasons the situation could be improved: the first is that by analyzing the relationship between the number of workers and production, it is found that the average product is equal to the marginal product, that is, the company operates with a number of efficient workers; however, the learning curve indicates that for every 1% that accumulated production increases, the total cost only decreases 0.025%, this may be due to staff turnover, however, given the existing technology, certain processes could be automated to improve efficiency. The second reason is that the management of a company could be more effective when using the costing method ABC, which consists of identifying the manufacturing activities and the management of consumption resources of each product according to the assembly line and not in a general way as it does with the traditional costing system. It is found that with the ABC system, the rate of return in the small product line would be 14% compared to 10.8%, and the medium is 4.3% higher when compared to traditional costing.
As mentioned, the manufacturing sector has experienced sustained growth in Mexico, so that this company, as well as the many that belong to this sector, must take advantage of technological and administrative resources of the way in which they operate in the day to day, and thus lower their costs as they increase their production, in other words, operate with economies of scale.
References
- Bitzan, J and Peoples, J. (2016). “A comparative analysis of cost change for low-cost, full-service, and other carriers in the US airline industry”. Research in Transportation Economics, 56, 25-41.
Google Scholar
- Centro de Estudios de las Finanzas Públicas (CEFP, 2016). Boletín: Actividad Industrial. [Online], [Retrieved July 27,2017], http://www.cefp.gob.mx/publicaciones/boleco/2016/becefp0202016.pdf
- Christensen, L and Greene, W. (1976). “Economies of scale in U.S. electric power generation”. Journal of Political Economy, 84(4), 655-676.
Google Scholar
- Clark, J and Speaker, P. (1994). “Economies of scale and scope in banking: evidence from a generalized translog cost function”. Quarterly Journal of Business and Economics, 3-25.
Google Scholar
- Cooper, R and Kaplan, R. (1991). “Profit priorities from activity-based costing”. Harvard Business Review. 69(3), 130-135.
Google Scholar
- Encuesta Mensual de la Industria Manufacturera (EMIM, 2017). INEGI.
- Green, W. (1998). Econometric analysis. Third edition. Prentice Hall.
- Hartarska, V, Shen, X and Mersland, R. (2013). “Scale economies and input price elasticities in microfinance institutions”. Journal of Banking and Finance, 37(1), 118-131.
Google Scholar
- HSBC (2016). Manufacturing scope in 2016. [Online], [Retrieved July 28, 2017], https://globalconnections.hsbc.com/mexico/es/articles/panorama-de-la-manufactura-en-2016
- JP Morgan y IHS Markit (2017). J.P. Morgan Global Manufacturing PMITM. [Online], [Retrieved July 28, 2017], https://www.markiteconomics.com/Survey/PressRelease.mvc/d31eaaaaec984a97b48aa1b224a3e2d2
- Pindyck, R and Rubinfeld, D. (2013). Microeconomics (23-65). U.S. Pearson, Prentice Hall.
- Skoda M. (2009). “The importance of ABC models in cost management.” Annals of the University of Petroşani, Economics, (263-274).
Google Scholar
- Stratopoulos, T, Charos, E and Chaston, K. (2000). “A translog estimation of the average cost function of the steel industry with financial accounting data”. International Advances in Economic Research, 6(2), 271-286.
Google Scholar
- Tsai, W, Kuo, L, Lin, T, Kuo, and Shen, Y. (2009). “Price elasticity of demand and capacity expansion features in an enhanced ABC product-mix decision model”. International Journal of Production Research, 48, 6387–6416.
- Varian, H. (1984) “The nonparametric approach to production analysis”. Econometrica,. 52, 579-597
Google Scholar
Appendix