Introduction
Management Information Systems (MIS) combines the disciplines of management and computer science to manage information (Laudon and Laudon, 2009). As an emerging interdisciplinary field, MIS demands both technical and managerial skills from its graduates. The curriculum of MIS department in Boğaziçi University is designed to deliver a balanced set of management and computer courses in order to prepare students for developing and maintaining business information systems. Courses offered in the MIS curriculum cover a wide range of topics that include management and organization, economics, marketing, accounting and finance, computer programming, system design concepts, database management, data communication and operations research. In the first two years, students take basic management and computing courses. Specialized courses are offered in the last two years to provide the student with a strong foundation in information management.
In Turkey, students have to take a nationwide entrance exam to study at a university. The main objective of this exam is to measure the candidate’s basic knowledge in social and technical high school courses. Based on these measurements, composite scores are calculated in selection of these candidates. As a direct consequence of this, students from general high schools and vocational high schools (mainly from computer and management departments) with widely varying range of backgrounds are admitted to the MIS department. Students with different backgrounds have to pursue the same diversified set of courses such as programming, managerial and quantitative subjects as well as analysis and design.
The aim of this study is to investigate the profiles of students in MIS department by performing cluster analysis on various dimensions of academic abilities based on their official grade data for the required courses. Characteristics of students in each cluster are examined to gain inside knowledge about how such attributes as educational background and high school types are distributed over each segment. Especially, how the distribution of category of high school types varies among different segments are of interest to shape strategic decision of our department.
The outline of this paper is as follows. In Section 2, basic data mining functionalities are introduced and related works in educational data mining are summarized. The methodology of this study is presented in Section 3, which is followed by the description of data in Section 4. Section 5 discusses the results in detail. Finally, the last section summarizes our work and presents how the result of the analysis is used in the department under question.
Educational Data Mining
Data mining is the process of analyzing data from different perspectives and summarizing it into useful information. Data mining functionalities are classified into two broad categories as descriptive and predictive ones (Han et al., 2011). Descriptive functionalities help understand characteristics of data in databases. Description focuses on finding human-interpretable patterns describing the data. Data visualization, association analysis, clustering are examples of descriptive functionalities. Data visualization aims to communicate data clearly and effectively through graphical representation. Association analysis is the discovery of rules in transactional databases. It is widely used for market basket analysis to uncover the items that are purchased together. Clustering analysis identifies clusters embedded in the data, where a cluster is a collection of data objects that are similar to one another. On the other hand, predictive functionalities make predictions based on inferences. Predictive functionalities generally are based on models which are simplified abstract views of the complex reality. Quantitative models such as classification and regression are examples of predictive functionalities. Prediction involves using some known variables to predict unknown or future values of other variables of interest. Classification is the process of finding a set of models that describe and distinguish data using a training dataset. The derived model is used to predict class labels that are unknown. Regression analysis is similar to classification, but it is used to predict a continuous target variable.
This study can be categorized as educational data mining which is an emerging discipline, concerned with developing methods for exploring the unique types of data that come from the educational context. Educational data mining is a new research area. A survey of the application of data mining techniques to various educational systems is given in Romero and Ventura (2007). These techniques include data visualization, clustering, classification and association analysis applied to educational systems such as traditional education, distant education as well as the learning content management systems.
In an another work of Romero et al. (2008) on educational data mining, the application of various data mining techniques on data collected from the activities of students who use Moodle e-learning course management system is discussed.
Typical applications of education data mining are in the following areas: predicting academic success, (Ma et al, 2000; Barker et al, 2004; Herzog, 2006), predicting the course outcomes, (Hämäläinen et al, 2006; Bresfelean et al, 2008), cluster analysis of e-learning material (Drigas and Vrettaros, 2004; Tane et al, 2004; Hammouda and Kamel, 2005) and learning log analysis (Hadwin et al, 2005; Nesbit and Hadwin, 2006).
To the extent of our knowledge, a closely related research is in Dzemyda (2005), where a method for the analysis of curricula via the statistical analysis of examination results is proposed.
The method is grounded on the visualization of a set of academic subjects characterized by their correlation matrix of 25 subjects obtained using examination results multidimensional data. The correlation matrix has been analyzed to test the relation between the aptitudes of students and the marks earned in the related subjects.
Methodology
This study aims at clustering undergraduate students in the MIS department of Boğaziçi University based on course grades data. After forming student clusters, a profile analysis was carried out so as to examine the variation of other student characteristics in different student segments. These characteristics are qualitative variables that are not included in cluster analysis (Sharma, 1995).
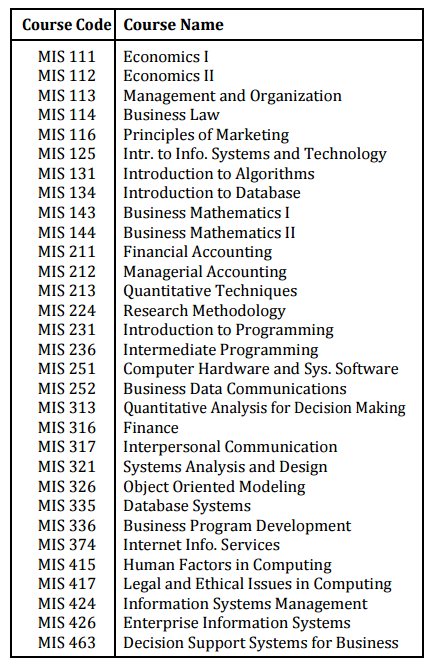
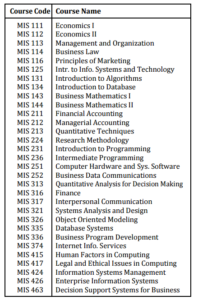
As can be seen in Table 1, there are 31 required courses in our current MIS undergraduate curriculum, so a dimension reduction strategy is needed to obtain independent factors. Courses requiring similar abilities from students are expected to fall under the same factors. One possible approach is based on identifying these different dimensions subjectively using domain knowledge; this can be accomplished by assigning a weight to each of these ability dimensions for each course. These weights can be obtained from instructors or students by designing appropriate questionnaires and combining their opinions accordingly.
Table 1: MIS Department Course List
The second approach, as followed in this study, is the factor analysis which is a multivariate statistical method whose primary purpose is to define the structure of data. It can be utilized to examine the underlying patterns for a large number of variables and to determine whether these patterns can be condensed or summarized in a smaller set of factors or components. The correlation between the original variables and the factors are called factor loadings. Once the initial solution (set of independent factors and their loadings) is obtained, a rotation method can be applied to facilitate interpretation of the solution. The rotation method is expected to alter the decomposition of variance explained by different factors. Factor analysis can be carried out with different techniques such as principle component factoring, principle axis factoring and maximum-likelihood (Basilevsky, 1994; Hair et al., 2009; Sharma, 1995).
In this study, factor analysis using the principle component factoring is applied to obtain the underlying factors representing the ability dimensions of student grades. Varimax rotation method is used to obtain the rotated factor loadings.
For each factor, summed scales are computed by taking the arithmetic averages of highly loading courses on that factor (Hair et al., 2009). Since all variables are numerical with ratio scale, cluster analysis is performed by k-means algorithm (Han et al., 2011; Mirkin, 2005). After forming the clusters, qualitative characteristics of students in each segment are examined by cross tabulations.
Only the grades of the required courses offered by the department are used in this study. The elective course grades are omitted due to the heterogeneous nature of these grades. In addition, considering the fact that each instructor may have different grading policies and even the same instructor’s grading patterns may change over time, for each year the course grades are standardized by mapping the course average grade to 2.0 and standard deviation to 1.0. Hence, for each specific year, the success of a particular student is measured by the units of standard deviations above or below the average course grade of that year. Course averages are mapped to 2.0 for the sake of easy interpretation instead of using the well-known z scores.
Description of Data
The data set is obtained from the Registration Office of the University. The data set contains records that include information about the student number, course code, semester, letter grade and status, as well as records that contain student’s personal information such as gender, high school name and type. The sample period ranges from fall-2000 semester to fall-2007 semester. There are 467 MIS students in the data set. The letters ranging from AA (excellent) to F (Fail) are mapped to a ratio scale numerical variable with scores ranging from 4 (for AA) to 0 (for F). In the case of a student taking the same course more than once, the average of the all earned grades is used as its final score. The data is converted into tabular format where rows represent students and columns represent courses, hence each cell contains the score of a particular student for a specific course. In this format, the data contains a lot of missing values since new students do not have any junior or senior course grades. No missing value handling method is used as factor analysis is based on computing the correlations among variables, because replacing missing scores with the means may introduce bias into estimations.
Results
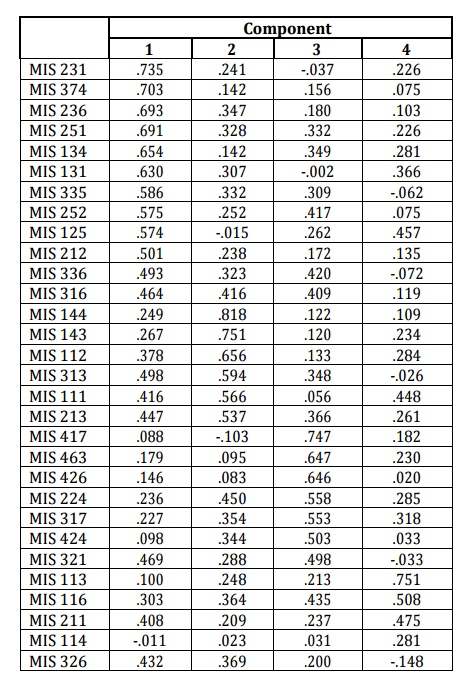
Both factor and cluster analysis were performed using SPSS version 16.0 (SPSS, 2009). The results of the factor analysis are shown in Table 2.
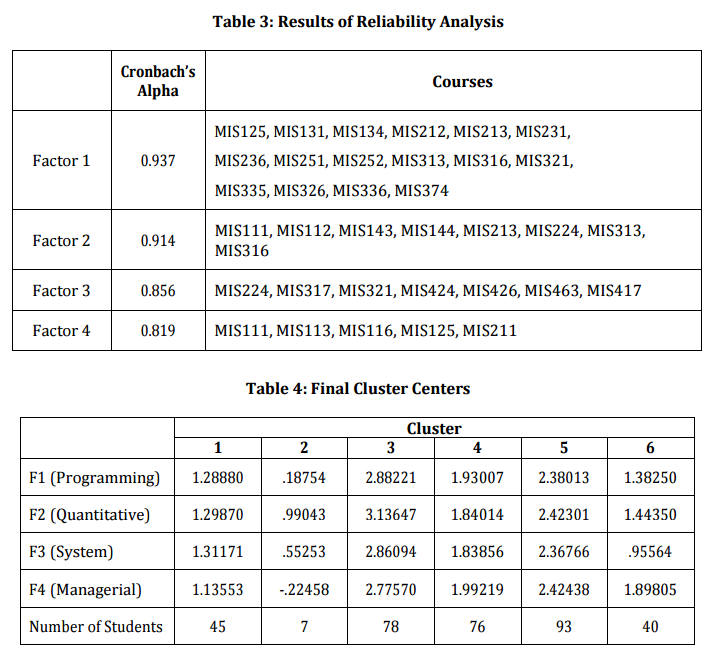
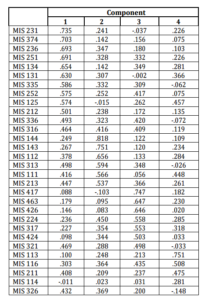
Kaiser-Meyer-Olkin (Kaiser, 1970) measure of sampling adequacy gives a value of 0.846, Bartlett’s test sphericity has a chi-square value of 1467. With 435 degrees of freedom, this has a p value of 0.000. Both of these statistics indicate that the data set is suitable for factor analysis. There are four factors whose Eigen values exceed unity that explain 63% of the total variance in the data set. Considering the description of the required courses in MIS department given in Table 1 and the rotated factor (component) loading matrix presented in Table 2 reveals that factor 1 consists of programming courses. Factor 2 basically contains quantitative courses such as mathematics, statistics as well as the two introductory economics courses. Factor 3 collects the courses that require system thinking and design ability of students. Finally, factor 4 includes managerial courses such as marketing and organizational behavior. The reliability of these four factors is examined by computing the Cronbach’s alpha values individually. The Cronbach’s alpha values shown in Table 3 indicate that factors 1 to 4 are all reliable.
Results of the cluster analysis are presented in Table 4. The k-means algorithm is experimented with different number of clusters. In all these experiments, similar clustering patterns are observed. Number of clusters is chosen as 6.
Table 2: Results of Factor Analysis: Rotated Component Matrix
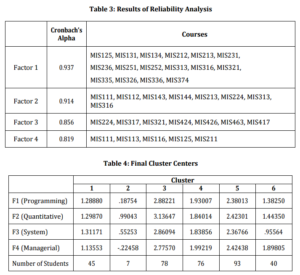
Examination of the cluster centers in Table 4 reveals that: Cluster 3 represents the most successful students. In all four dimensions, their grades are approximately one standard deviation above the mean. The students in Cluster 5 represent the second successful group whose grades are in general 0.4 standard deviation above the average. Cluster 4 is characterized by the average students. Unsuccessful students are grouped in Clusters 1 and 6, whose grades are below the average in all the abilities. However, students in these clusters have similar programming and quantitative abilities (F1, F2) but they are differentiated in the system and managerial dimensions (F3, F4). Compared to cluster 1, the managerial abilities of students in cluster 6 are higher by 0.7 standard deviation, whereas their system thinking abilities are lower by 0.4 standard deviation. There are only 7 students in cluster 2 which can be treated as outliers. These students have performed very poorly in all abilities.
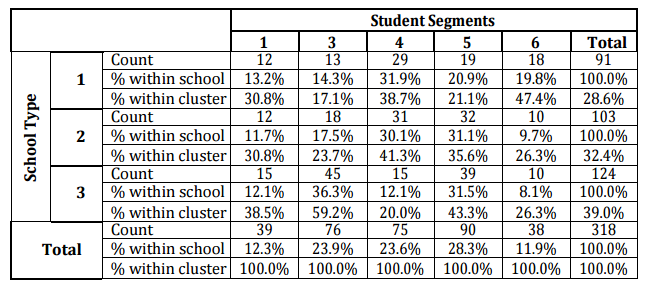
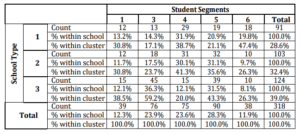
Table 5 presents cross tabulations of the clusters and high school types. By examining the student’s personnel information records, three main categories of high school types can be identified as vocational commerce (School Type 1), vocational computer (School Type 2) and general high schools (School Type 3). The chi-square statistics with 8 degrees of freedom has a p-value of 0.000. The null hypothesis of independence of school type and student clusters can be rejected at a 1 % confidence level. 68 % of the general high school students are successful in MIS education (fall in Cluster 3 and 5). On the other hand, for students from computer and commerce high school, this percentage is approximately 48.6 and 35.5 respectively. 19.8 % of the students from commerce high school fall in Cluster 6 which is approximately two times higher than students from other types of schools. Approximately one third of computer and commerce high school students are average students.
Table 5: Cross Tabulation of School Types and Student Clusters
Conclusions
In this study, we have explored different student segments by performing cluster analysis on various dimensions of academic abilities for the MIS department of Boğaziçi University. Based on these segments, the profiles of students including categorical variables such as educational background and high school types are determined. These profiles are used in two ways: (1) to investigate how high school type that varies among different segments effects the education; and (2) to distribute students in various elective courses and projects as well as to revise educational strategies of the department related to the curriculum.
Since students have to take a nationwide entrance exam to enter a university, the department has no control over the selection process of the undergraduate students. Therefore, the evaluation as defined in this paper cannot be applied to the selection of students. However, the results of this study can be used in the following areas to improve the quality of the MIS education:
– The programming courses are offered in the first two years of the MIS curriculum.
The assignment of the students to different sections of the programming courses as well as the curriculum design for these sections can be carried out by considering students’ backgrounds.
- The projects assigned to students in courses in the last two years of the program require different skills (programming, managerial, quantitative, or system) of the students; hence, the group member’s composition can be determined based on the results of this study.
– The results can be used to offer a different type of elective courses according to the background of the current students in a particular semester as well as designing elective tracks.
– The academic advisors of the students can consider the findings to guide students in selecting appropriate complementary or departmental elective courses.
References
Barker, K., Trafalis, T. & Rhoads, T. R. (2004). “Learning from Student Data,” Proceedings of the 2004, IEEE Systems and Information Engineering Design Symposium, University of Virginia, Charlottesville, 79—86.
Publisher – Google Scholar
Basilevsky, A. (1994). “Statistical Factor Analysis and Related Methods: Theory and Applications,” Wiley-Interscience, New York.
Publisher – Google Scholar
Bresfelean, V. P., Bresfelean, M., Ghisoiu, N. & Comes, C. A. (2008). “Determining Students’ Academic Failure Profile Founded on Data Mining Methods,” Proceedings of the 30th International Conference on Information Technology Interfaces (ITI 2008), Dubrovnik, Croatia, 317—322.
Publisher – Google Scholar
Drigas, A. & Vrettaros, J. (2004). “An Intelligent Tool for Building e-Learning Contend-Material Using Natural Language in Digital Libraries,” WSEAS Trans. Inf. Sci. Appl., 5(1), 1197—1205.
Publisher – Google Scholar
Dzemyda, G. (2005). “Multidimensional Data Visualization in the Statistical Analysis of Curricula,” Computational Statistics & Data Analysis, 49(1), 265 — 281.
Publisher – Google Scholar
Hadwin, A. F., Winne, P. H. & Nesbit, J. C. (2005), Annual Review: “Roles for Software Technologies in Advancing Research and Theory in Educational Psychology,” Br. J. Educ. Psychol.,75, 1—24.
Publisher – Google Scholar
Hair, J. F., Anderson, R. E., Tatham, R. L. & Black, W. C. (2009). ‘Multivariate Data Analysis,’ Prentice Hall, New Jersey.
Hämäläinen, W., Laine, T. H. & Sutinen. E. (2006). “Data Mining in Personalizing Distance Education Courses,” Data Mining in e-Learning, Romero, C and Ventura, S. (eds), WitPress, Southampton, U.K., 157—171.
Publisher – Google Scholar
Hammouda, K. & Kamel, M. (2005). ‘Data Mining in E-learning, E-Learning Networked Environments and Architectures: A Knowledge Processing Perspective,’ Pierre, S. (ed), Springer-Verlag, Berlin, Germany.
Han, J., Kamber, M. & Pei, J. (2011). ‘Data Mining: Concepts and Techniques,’ Morgan Kaufmann, San Francisco, CA.
Google Scholar
Herzog, S. (2006). “Estimating Student Retention and Degree-Completion Time: Decision Trees and Neural Networks Vis-a-Vis Regression,” New Directions for Institutional Research, 131, 17—33.
Publisher – Google Scholar
Kaiser, H. F. (1970). “A Second Generation Little Jiffy,” Psychometrica, 35(4), 401-415.
Publisher – Google Scholar
Laudon, K. C. & Laudon, J. P. (2009). ‘Management Information Systems,’ Prentice Hall, New Jersey.
Ma Y., Liu, B., Wong, C. K., Yu, P. S. & Lee, S. M. (2000). “Targeting the Right Students Using Data Mining,” Proceedings of the Sixth ACM SIGKDD International Conference on Knowledge Discovery and Data Mining (KDD’00), ACM Press, New York, 457—464.
Publisher – Google Scholar
Mirkin, B. (2005). “Clustering for Data Mining: A Data Recovery Approach,” Chapman & Hall/CRC, Boca Raton, Florida.
Publisher – Google Scholar
Nesbit, J. C. & Hadwin, A. F. (2006). ‘Methodological Issues in Educational Psychology,’ Handbook of Educational Psychology, Alexander, P. A. and Winne, P. H. (ed), Mahwah, NJ: Erlbaum, 825—847.
Google Scholar
Romero, C. & Ventura, S. (2007). “Educational Data Mining: A Survey from 1995 to 2005,” Expert Systems with Applications, 33(1), 135-146.
Publisher – Google Scholar
Romero, C., Ventura, S. & Garcia, E. (2008). “Data Mining in Course Management Systems: Moodle Case Study and Tutorial,” Computers & Education, 51(1), 368-384.
Publisher – Google Scholar
Sharma, S. (1995). “Applied Multivariate Techniques,” J. Wiley, New York.
Publisher – Google Scholar
SPSS Inc. (2009). Clementine 12.0 User Manual.
Tane, J., Schmitz, C. & Stumme, G. (2004). “Semantic Resource Management for the Web: An E-Learning Application,” Proceedings 13th World Wide Web Conference, WWW2004, Fieldman, S. and Uretsky, M. (eds.), ACM Press, New York, 1—10.
Publisher – Google Scholar