The education services sector of developing economies has becoming progressively more important nowadays because of an increasing trend towards globalisation / internationalisation recognition. Indeed, there is a strong correlation between a country’s competitiveness and the quality of higher education provided within that country (Borahan and Ziarati 2002). A more competitive education environment has gradually been achieved through quality of services provided by higher education institutions (hereinafter referred to as “HEI”). As a result, many HEI are placing more emphasis on closing the gaps between their expectations of institutional performance and the actual performance (Pariseau and McDaniel 1997; Kassim and Zain 2010).
Service quality is generally perceived to be a tool that could be used to create a competitive advantage that would assist higher education in dealing with a new environment. Hence, it is of paramount importance for HEI to monitor the quality of its services and to commit to continuous improvement.
Therefore, the objectives of this paper are to examine to what extend a college of business in one of the public universities in Saudi Arabia is meeting the expectations of its students and to identify the critical quality service dimensions of the college. This study focuses solely on the students’ perspective because they are the ones who should measure and judge the quality of service since they are the recipients of the services (Zairi 1995; Sakthivel and Rajendran 2005).
Service Quality
A comprehensive definition of a customer’s overall perception of service quality used in this paper is:
A customer’s overall perception of service quality is an attitude developed from current and all previous encounters including how the service is or was delivered as well as the outcome of consuming that service.
This definition of service quality covers several points. Service quality is an attitude developed over all previous encounters with a service firm (Bitner 1990; Parasuraman Zeithaml and Berry, 1985; 1988). The word ‘attitude’ includes outcome quality and process quality. Similarly, other researchers have termed outcome quality as what the customer actually received and process quality as how the service is delivered (Groonroos 1983). However, outcome quality is usually difficult for a customer to evaluate for any service because service, tend to have more experience and credence qualities (Zeithaml 1988). This situation leads customers to include process quality, that is, the service is evaluated by customers during its delivery (Swartz and Brown 1989). Hence, quality of service evaluation does not depend solely on the outcome quality of the service, but also involves evaluation of the process of service delivery. These components have a strong impact on future expectations of a service firm, but the relative impact of each may vary from one service encounter to another service encounter (Bitner 1990; Groonroos 1983). Thus, this definition briefly describes quality of service as the outcome and process quality of the service from all previous service encounters.
Various models of measuring the perceptions of service quality have been discussed and developed by academic researchers (Cronin and Taylor 1992; Parasuraman, Zeithaml and Berry 1985, 1988; Teas 1993). SERVQUAL developed by Parasuraman, Zeithaml and Berry in the early 1980s is based on the view that customers assess service quality by comparing expectations of services provided with perceptions of the actual service received from a particular service provider. Five-dimensional construct of perceived service quality have been proposed in their model which has been the most extensively used service quality measurement in 1990s. Despite its popularity in service industry settings, SERVQUAL has received considerable theoretical and operational criticisms in the academic and management literature for including expectations (Cronin and Taylor 1992), for using a subtractive “gap” in assessing service quality (Buttle 1996) and, more significantly, the SERVQUAL dimensions vary across different types of services (Buttle 1996; Carman, 1990; Cronin and Taylor 1992; Teas 1993; 1994).
Service Quality Dimensions
Parasuraman, Zeithaml and Berry (1988) developed five-dimensional constructs of perceived service quality– tangibility; reliability; responsiveness; assurance; and empathy – with items reflecting both expectations and perceived performance. These dimensions are claimed to hold their structure across service industries (by the developers) and have received wide acceptance amongst the researchers. However, these dimensions are not clear in the sense that well-defined dimensions are required to enable customers to form an opinion of a service (Edvardsson 1998; Ganesh, Arnold and Reynolds 2000), so that they can relate to both basic or core service products as well as to augmented service offerings. Moreover, the empirical evidence suggests that the widespread use of these dimensions is not justified (Garland, Tweed and Davis 1999). Differences in the number of empirically derived dimensions across these many studies may be due to a cross-dimension similarities and/or within-dimensions differences in customers’ evaluations of a specific company involved in each setting (Kassim and Zain 2010).
Various factor analyses often show an overlap between Parasuraman, Zeithaml and Berry’s identified dimensions (Kassim and Zain 2010). Indeed, the relative importance of these dimensions varies from one country to another (Kassim and Zain 2010), and may also depend upon the age, gender (Spathis, Petridou and Glaveli 2004), income, marital status, occupation and cultural differences (Kassim and Abdullah 2010).
Furthermore, it is not possible to set a list of universal service dimensions because different services involve different customer needs and wants (Kassim and Zain 2010; Rust et al., 1994; Spathis, Petridou and Glaveli, 2004). The degree of involvement between service provider and customers depends upon the extent to which the service is equipment-based or people-based (McColl, Callaghan and Palmer 1998). An equipment-based service is regarded as being less variable in the service delivery process and thus, able to maintain a constant standard. A people-based service involves a high degree of personal intervention. In this research an academic can be regarded as being more variable (although it offers more scope for customization).
Indeed, some dimensions are more likely to produce reliable and valid findings than others (Dewlin, Dong and Brown 1993). In this research, a student will judge the quality when a complaint was resolved, and also the quality of the process. Process quality would include such things as the professor’s timeliness, his or her responsiveness in solving problems, empathy, courtesy and listening skills.
Despite receiving considerable theoretical and operational criticism and lack of consensus in the literature, we still believe that SERVQUAL is an appropriate instrument for this type of research, particularly, in the light of differences in culture and service settings. Therefore, through assessing and comparing the perceptions of the students in the college of business, this paper aims to determine any service shortfalls in a HEI. By doing so, it helps to enhance our understanding of the students’ expectations and its roles in improving service quality in the college.
Methodology
Three research questions served as the basis for data analysis:
1. Are there differences between students’ expectations of the service quality and their perceptions of the service performance in the college of business?
2. Are there differences in the degree of importance attached to the dimensions of service quality by the students of the college?
3. Which service quality dimension is the best predictor of an overall quality of the college?
The sample consisted of 166 female full-time undergraduate students in a college of business at one public university in Saudi Arabia. The students were approached conveniently during the end of the 2012 fall semester.
The questionnaire consisted of four parts. The first and the second parts consisted of the student respondents’ expectations and perceptions of the ideal business professor and business college and their feelings towards the faculty and the college of business. These parts were important, because they measure the student respondents’ attitude and opinions toward the perceptions and knowledge about the quality of services. For this paper, expectations and perceptions of the five dimensions of service quality were measured by 22 statements taken from SERVQUAL (Parasuraman et al., 1988), and then modified to capture more precisely the expectations and perceptions associated with higher education services (Pariseau and McDaniel 1997). The third part asked the student respondents to evaluate the overall quality of services provided by the business faculty and the business college. This part contains some questions pertaining to student retention and student loyalty. Finally, the fourth part aimed at building a demographic profile of the student sample. The questionnaire was adapted from Pariseau and McDaniel (1997), and was originally written in English and it was then translated into Arabic by an Arabic academic.
In measuring expectations and perceptions of service quality received, student respondents were asked to state their degree of agreement with each statement by assigning a value of one (“strongly disagree”) to six (“strongly agree”), as proposed by Kassim and Abdullah (2010). The reason is that the rating scales were used to minimize social desirability bias arising from respondents’ desires to please the interviewer or to appear helpful (Garland 1991).
The statistical analyses methods employed were:
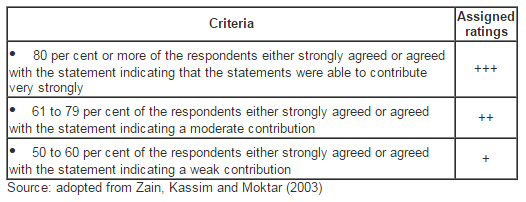
– Rating: to analyze the various items by assigning a rating scale based on the degree of agreement among the students respondents with the statement posed to them (see table 2),
– Cronbach’s alpha: to measure the reliability of the coefficient for each dimension,
– Confirmatory factor analysis (CFA): to investigate the constructs dimensionality,
– Factor analyses: to test the dimensionality of the instrument, all the 22 items were analyzed using oblique rotation and varimax rotation,
– Paired sample t-test: to compare the mean scores for the same group of students on two different occasions (i.e., expectation and actual performance), and
– Multiple regression: to test the determinant of service quality
Results and Analysis
Demographic Profile
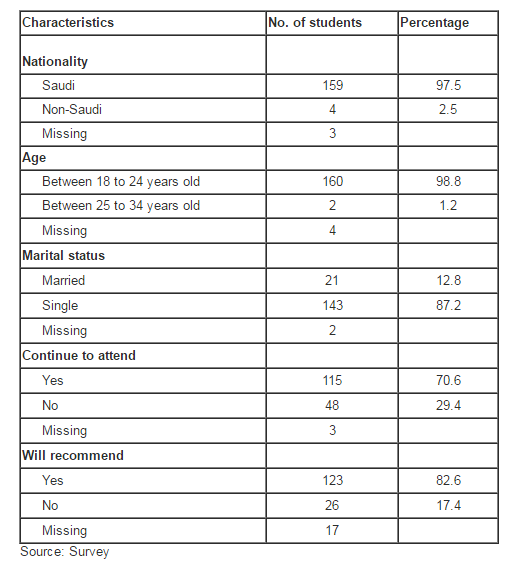
Table 1 shows the sample profile of the respondents. Out of a total of 166 questionnaires, majority of the students were Saudi (97.5%) between the ages of 18 and 24 years (98.8%), and were single (87.2%). In this particular institution, female and male students were located in different campuses and the data was collected from the female campus only. This is one of the limitations which are highlighted in the future research section. These and other characteristics are shown in table 1.
Table 1: Demographic Profile of Students (N = 166)
The analysis of the various variables was done by assigning a rating scale based on the degree of agreement among the respondents with the statements posed to them (Table 2). This analysis allows us to assess the respondents’ expectations and perceptions towards the five-dimension of service quality. The results obtained on the respondents’ expectation and perceptions were consistent and will be discussed next.
Overall, the results from the one-sample t-test (see Table 3) indicate that there are significant differences between the sample means and the population means. That is, majority of the statements used in this research support the measurements used to test the respondents’ expectations and perceptions about concept of service quality.
Table 2: Ratings used to assess the variables
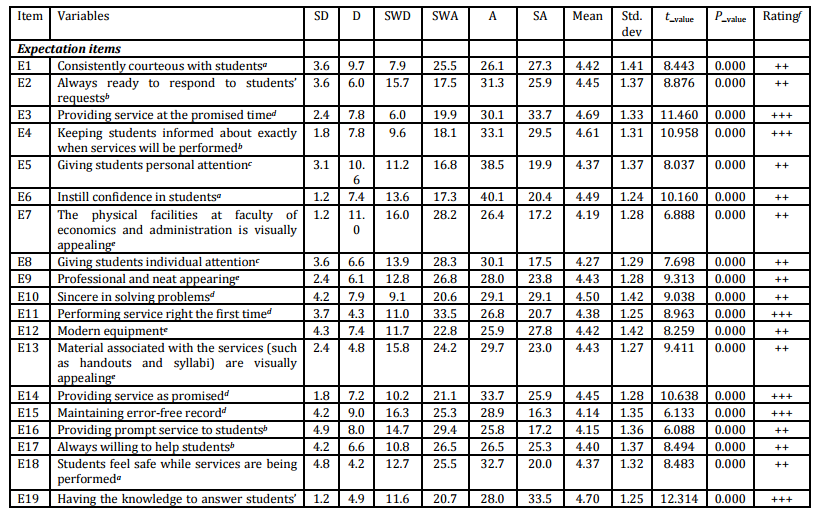
Expectation Statements
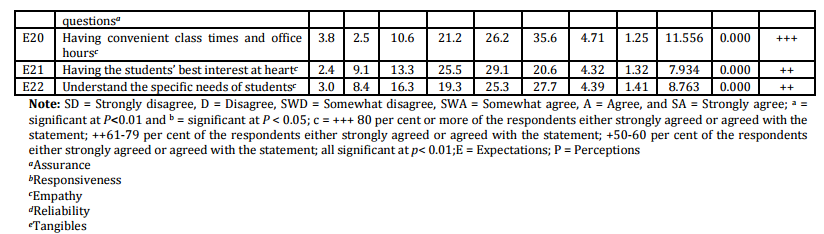
Table 3 shows that there was some evidences (agreed by the majority of respondents) that, out of the total of 22 statements posed to the respondents, one received strong agreement (+++ rating, i.e. strongly agreed/agreed by more than 80 per cent of the respondents), and three statements received moderate rating (++ rating, i.e. strongly agreed/agreed by 61-79 per cent of the respondents) as follows:
1. Statement receiving a +++ rating:
– Having the knowledge to answer students’ questions
– Keeping students informed about exactly when services will be performed
– Performing services right for the first time
– Providing service as promised
– Having the knowledge to answer students’ questions
– Having convenient class times and office hours
2. Statements receiving a ++ rating:
– Consistently courteous with students
– Always ready to respond to students’ requests
– Giving students personal attention
– Instill confidence in students
– The physical facilities at faculty of economics and administration is visually appealing
– Giving students individual attention
– Professional and neat appearing
– Sincere in solving problems
– Modern equipment
– Materials associated with the services (such as handouts and syllabi) are visually appealing
– Maintaining error-free record
– Providing prompt service to students
– Always willing to help students
– Students feel safe while services are being performed
– Having the students’ best interest at heart
– Understand the specific needs of students
Overall, more than 61 per cent of the statements pertaining to the expectations of service quality were rated to be on the positive side.
Table 3: Variables Rating
Perception Statements
In contrast, there was strong and average support on the statements pertaining to the faculty members of the college of business as indicated below:
– Having the knowledge to answer students’ questions (+++)
– Consistently courteous with students (++)
– Always ready to respond to students’ requests (++)
– Providing service at the promised time (++)
– Keeping students informed about exactly when services will be performed (++)
– Giving students personal attention (++)
– Instill confidence in students (++)
– The physical facilities at faculty of economics and administration are visually appealing (++)
– Giving students individual attention (++)
– Professional and neat appearing (++)
– Sincere in solving problems (++)
– Performing service right the first time (++)
– Modern equipment (++)
– Material associated with the services (such as handouts and syllabi) are visually appealing (++)
– Providing service as promised (++)
– Maintaining error-free record (++)
– Providing prompt service to students (++)
– Always willing to help students (++)
– Students feel safe while services are being performed (++)
– Having the knowledge to answer students’ questions (++)
– Having convenient class times and office hours (++)
– Having the students’ best interest at heart (++)
– Understand the specific needs of students (+)
Overall, with the exception of one statement, more than 61 per cent of the statements pertaining to the college of business were rated to be on the positive side. In other words, there are clear indications that the respondents agreed that the faculty members and the facilities of the college were somewhat meeting their expectations. However, further analysis using the paired samples t-test will be conducted to test for difference in means of paired samples (Malhotra 2010).
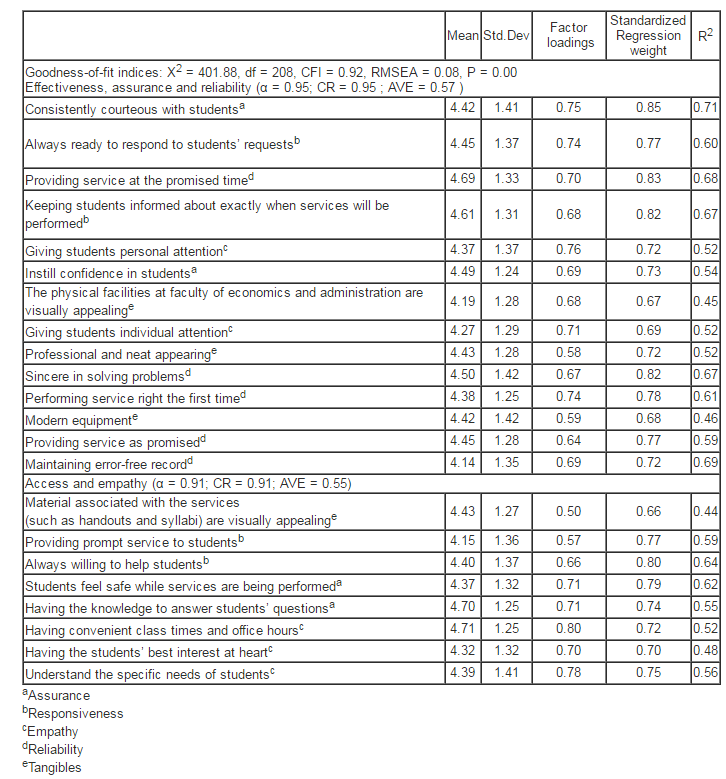
To test the dimensionality of the instrument, all 22 items were analysed using oblique rotation and varimax rotation. The criterion of meaningful factor loading was set to 0.4 (Tsoukatos and Rand 2006). Our use of these criteria resulted in a two-dimensional solution explaining 61.2% of the variance. These cross-loadings items are labelled as effectiveness, assurance and reliability (14 items) and effectiveness and empathy (eight items). Effectiveness, assurance, and reliability represented the ability to perform the promised service accurately and free of error. It also indicated the favourable appearance of the faculty members and that the college was using modern equipment. Access and empathy assessed the speed of the service delivery and the friendliness and courtesy of the faculty members.
Table 4: Properties of the Two Types of Perceived Service Quality Measurement
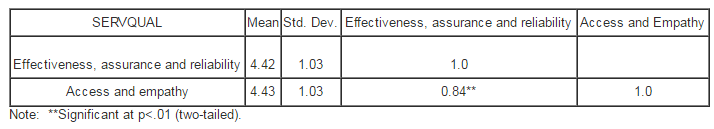
The resultants of these new dimensions were tested for their reliability and validity (convergent validity, nomological validity, and discriminant validity) (Tables 4 and 5). AMOS 4 was used to perform a confirmatory factor analysis (CFA) to investigate the constructs’ dimensionality (Table 4). The robust maximum likelihood estimation was used to allow for the absence of multivariate normality. Model fits were evaluated using the comparative fit index (CFI) and the root mean square error of approximation (RMSEA) because of their robustness, stability, and lack of sensitivity to sample size (Hair, Black, Barbin, and Anderson 2010). The sample factor means, standard deviation, and correlations are reported in table 5.
Convergent validity can also be evaluated by examining the factor loadings and squared multiple regression correlations (R2) from the confirmatory factor analysis (Table 4). Absolute values of 0.70 or more are recommended, but this guideline may be readjusted to lower or higher values. For example, minimum values of 0.30 to 0.50 have been suggested (Tabachnick and Fidell 2001). Based on this guideline, none of the items was found to have low factor loadings (table 4) thus confirming the convergent validity of the factors.
Discriminant validity is demonstrated when a measure is adequately distinguishable from related constructs. To do this, we compared the average variance extracted (AVE) of the individual constructs with shared variance between constructs (Fornell and Larcker 1981). This analysis shows that the AVEs of the individual constructs are more than 0.50, thus confirming the discriminant validity of the constructs (Table 4).
Table 5: Sample Means, Standard Deviation and Pearson Correlations for the Two SERVQUAL Dimensions
Degree of Importance Attached to the Dimensions of Service Quality
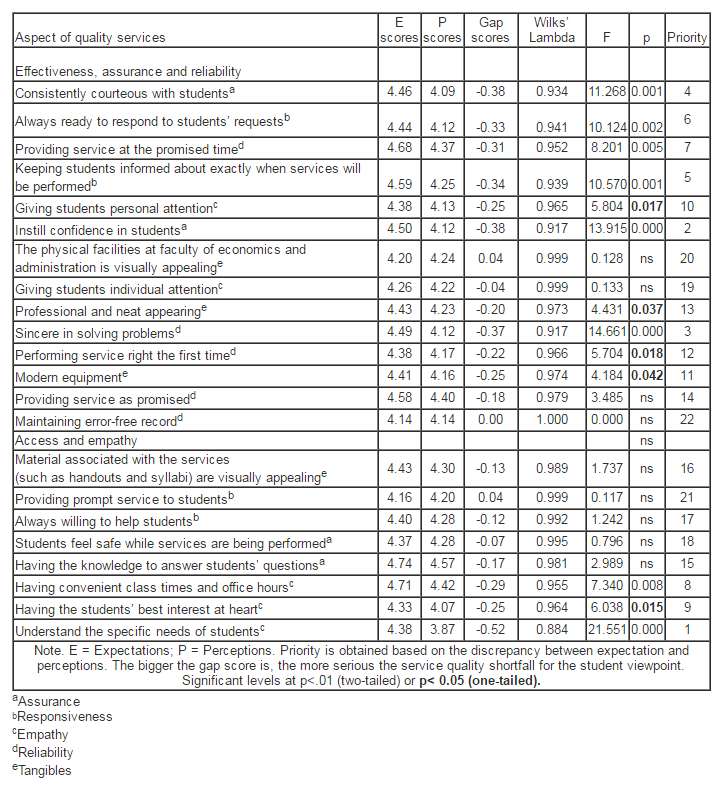
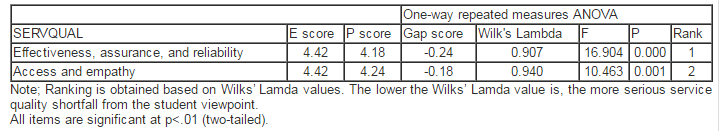
SERVQUAL method was used to calculate the difference in the score between the 22 statements. The negative score indicated the existence of a service quality gap, where the students were not having their expectations met by actual service performance (Table 6). The findings from Table 6 showed that there were some differences in magnitude of gap scores among the 22 statements of service quality. The result also showed that only three of the aspects of service quality had positive gap scores – the physical facilities are visually appealing, maintaining error free service and providing prompt service to students. Almost all the 22 statements indicated that the quality of service fell short of the student’s expectations; students were generally not satisfied with the college of business. Nevertheless, each aspect of quality of service showed differences with respect to the size of the gap scores. The list of aspect of quality service could be ranked from the lowest Wilks’ lambda value to the biggest value. The rank of service quality assessed through SERVQUAL, Wilks’ lambda and F values are presented in Table 6.
Table 7 shows the mean gap scores by dimensions for the total students’ sample. From the table it is noted that all students agreed that all the dimensions of service quality are important. The lower tWilks’ lambda values, the more serious service quality shortfall from the viewpoint of student. As can be seen from Table 7, the most serious gap was for effectiveness, assurance, and reliability with Wilks’ lambda value of 0.907 (the lowest value). Simply put, the students wanted empathy, responsiveness, assurance, tangibles, and reliability, while the service quality literature traditionally finds reliability as the first dimension and tangibles as the last. Thus, the rankings here are not consistent with the consumer rankings in Parasuraman et al’s (1988) previous studies.
Table 7: Mean Responses for Gap Scores for the Two SERVQUAL Dimensions
The Best Predictor of an Overall Quality of Service
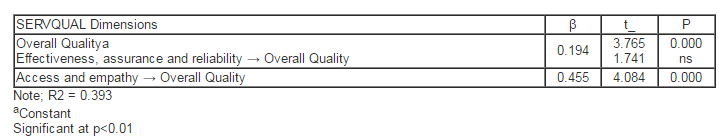
Next, in order to get a clearer picture of the perceptions of the respondents, it was important to examine the determinants of service quality of the different dimensions as indicated by the students. Regressions analysis was performed using the overall quality as the dependent variable and the two SERVQUAL dimensions as the independent variables. Following Cohen, Cohen, West, and Aiken’s (2003) recommendations, standardized path coefficient with absolute values of less than 0.10 may indicate a ‘‘small’’ effect; values of around 0.30 may indicate a ‘‘medium’’ effect; and values of 0.50 or more may indicate a ‘‘large’’ effect. The results suggest that both empathy and assurance have medium significant effects on service quality (Table 8).
Table 8: Regression Analysis
Effectiveness, assurance, and reliability dimensions had no significant p values. Thus, the rankings are not consistent with Parasuraman et al., (1988). Nevertheless, these findings are partly supported by previous educational study results (Pariseau and McDaniel 1997) that access and empathy have significant medium impact on service quality. As expected, students expectations on this dimension were higher because there are not enough female faculty members to teach and help them face-to-face. As a result many courses are being offered during the semester were conducted via teleconferencing from the male campus.
Conclusions and Managerial Implications
The findings show that, on the whole, the faculty members and the college of business are not currently delivering quality service in the opinion of their students. One-way repeated measures ANOVA tests confirmed the significant differences in perceptions of service quality among the students. Student expectations are highest in the area of access and empathy. These results suggest that the college of business should undertake significant efforts in faculty education in the area of service quality and customer satisfaction. This includes increasing the number of female faculty members. Also, the results show that there is inconsistency in determining the service quality with the SERVQUAL developers (Parasuraman et al 1988). Perhaps one possible explanation for this could be because they failed to include some services that are higher in customer contact and intervention (such as education). Indeed, the college of business requires more active involvement and cooperation of its students in the creation of the educational services than many other services (Pariseau and McDaniel 1997). Thus, the refinement of SERVQUAL is needed before it can be accepted as a valid measurement scale in education setting.
From the managerial perspective, it is very important that the faculty members and the college measure service quality continuously. In fact, service quality and student satisfaction are important factors in retention. Student retention has received increased attention nowadays because of the recent educational reforms, which have attracted major private colleges and universities in the country (Sambidge 2012). In particular, the college of business in this study needs to realize that faculty members’ willingness to help, providing prompt service, caring for their students and giving individualized attention to their students (empathy) seem to be the most important quality dimensions in an educational environment. In conclusion, to compete more efficiently and effectively in the marketplace, the college must be sensitive in meeting students’ expectations for access and empathy.
Admittedly, given the nature of the sample, the study may also be delimited to one small public college of business in Saudi Arabia. Further study aimed at assessing continuous service performance using a larger sample comprising data from more than one college in the country should be conducted in order to improve service quality. Also, obtaining larger samples in future studies would facilitate a more robust examination of changes in perceived-expected service quality relationship.
References
Bitner, M. J. (1990), ‘Evaluating service encounters: The effects of physical surroundings and employee responses,‘ Journal of Marketing, 54 (2), 69-82.
Publisher – Google Scholar
Borahan, N. G. and Ziarati, R. (2002), ‘Developing criteria for application in the higher education sector in Turkey,‘ Total Quality Management, 13 (7), 913-926.
Publisher – Google Scholar
Buttle, F. (1996), ‘SERVQUAL: Review, critique, research and agenda,’ European Journal of Marketing, 31(1), 8—32.
Publisher – Google Scholar
Carman, J. M. (1990), ‘Consumer perceptions of service quality: An assessment of the SERVQUAL dimension,’ Journal of Retailing, 66 (1), 33—55.
Cohen, J., Cohen, P., West, A. G., & Aiken, L. S. (2003) Applied multiple regression/correlation analysis for behavioural sciences, Lawrence Erlbaum, Hillsdale, NJ.
Cronin, J. J. and Taylor, S. A. (1992).‘Measuring service quality: A re-examination and extension,’ Journal of Marketing, 56 (3), 55—68.
Publisher – Google Scholar
Devlin, Dong, and Brown (1993), ‘Selecting a Scale for Measuring Quality,’ Marketing Research 5 (3), 12-17.
Edvardsson, B. (1998), ‘Service quality improvement,’ Managing Service Quality, 8,142—149.
Publisher – Google Scholar
Fornell, C. and Larcker, D. F. (1981), ‘Structural equation models with unobservable variables and measurement error: Algebra and statistics,’ Journal of Marketing Research, 18 (3), 382—388.
Publisher – Google Scholar
Ganesh, J., Arnold, M. J., & Reynolds, K. E. (2000), ‘Understanding the customer base of service providers: An examination of the differences between switchers and stayers,’ Journal of Marketing, 64 (3), 65—87.
Publisher – Google Scholar
Garland, R. (1991), ‘ The mid-point on rating scale: Is it desirable? ,’ Marketing Bulletin, 66—70.
Gronroos, C. (1983), ‘Innovation marketing strategies and organizational structures for services firms,’ In L. L. Berry, G. L. Shostack, and G. D. Upah (Eds.), Emerging perspective on services marketing (pp. 9—21). American Marketing Association, Chicago, IL.
Hair, J., Black, W. C., Barbin, B. J., and Anderson, R. E (2010) Multivariate Data Analysis, A Global; Perspective. Pearson Education, Upper Saddle River, NJ.
Malhotra, K.N. (2010) Marketing Research, An Applied Orientation, Pearson Education, Upper Saddle River, NJ.
McColl, R., Callaghan, B. & Palmer, A. (1998) Services Marketing; A Managerial Perspective, Rosevale, McGraw-Hill, NSW, Australia.
Janssens, W., Wijnen, K., Pelsmacker, P. D., and Kenhove, P. V. (2008) Marketing research with SPSS. Pearson Education, Harlow, England.
Kassim, N.M. and Abdullah, N. (2010), ‘The Effect of Perceived Service Quality Dimensions on Customer Satisfaction, Trust and Loyalty in E-Commerce Setting: A Cross Cultural Analysis,’ Asia Pacific Journal of Marketing and Logistics, 22 (3): 351-371.
Publisher – Google Scholar
Kassim, N.M. and M. Zain (2010), ‘Service Quality: Gaps in the College of Business,’ Services Marketing Quarterly, 31 (2) 235-252.
Publisher – Google Scholar
Parasuraman, A., Zeithaml, V., and Berry, L. L. (1985), ‘A conceptual model of service quality and its implications for future research,’ Journal of Marketing, 49 (Fall), 41—50.
Publisher
Parasuraman, A., Zeithaml, V., and Berry, L. L. (1988), ‘SERVQUAL: A multiple item scale for measuring customer perceptions of service quality,’ Journal of Retailing, 64 (1), 420—450.
Pariseau, S. E. and McDaniel, V. (1997), ‘Assessing service quality in schools of business,’ International Journal of Quality and Reliability Management, 14 (3), 204—218.
Publisher – Google Scholar
Rust, T. R. & Oliver, R. L. (1994). Service quality: New directions in theory and practice, : Sage,
Thousand Oaks, CA
Sambidge, A. (2012). Saudi Arabia to set up new scientific colleges, Arabianbusiness.com, 18 November 2012, accessed on November 20, 2012.
Sakthivel, P. B. & Rajendran, G. (2005), ‘TQM implementation and students’ satisfaction of academic performance,’ The TQM Magazine, 17 (6), 573—589.
Publisher – Google Scholar
Spathis, C., Petridou, E., and Glaveli, N. (2004), ‘Managing service quality in banks: customers’ gender effects. ‘ Managing Service Quality, 14 (1), 90-102.
Publisher – Google Scholar
Swartz, T. A. and Brown, S. W. (1989), ‘Consumer and provider expectations and experience in evaluating professional service quality,’ Journal of Academy of Marketing Science, 17 (2), 189—195.
Publisher – Google Scholar
Tabachnick, B. G. and Fidell, L. S. (2001) Using multivariate statistic, 4th edition, Allyn& Bacon, Boston, MA.
Teas, R. K. (1993), ‘Expectations, performance evaluation, and consumers’ perceptions of quality. ‘Journal of Marketing, 57 (4), 18—34.
Publisher – Google Scholar
Teas, R. K. (1994), ‘Expectations as a comparison standard in measuring service quality: An assessment of a reassessment. ‘ Journal of Marketing, 58 (1), 132—139.
Publisher – Google Scholar
Tsoukatos, E. and Rand, G. K. (2006), ‘Path analysis of perceived service quality, satisfaction and loyalty in Greek insurance. ‘ Managing Service Quality, 16 (5), 501—519.
Publisher – Google Scholar
Zairi, M. (1995), ‘Total quality education for superior performance,‘ Training for Quality, 3 (1), 29—35.
Publisher – Google Scholar
Zain, M., Kassim, N.M., and Moktar, E. (2003), ‘Use of Information Technology and Information Systems for Organizational Agility in Malaysian Firms. ‘ Singapore Management Review, 25 (1), 69-84.
Zeithaml, V. (1981), ‘How consumer evaluation processes differ between goods and services. ‘ In H. D. James and R. G. William (Eds.), Marketing of services (pp. 186—190). Chicago, IL: American Marketing Association.
Zeithaml, V. (1988), ‘Consumer perceptions of price, quality and value: A means-end model and synthesis of evidence. ‘ Journal of Marketing, 52 (3), 2—22.
Publisher