Introduction
To determine the economic level, respect. rate of economic development, the two most commonly used indicators, aregross national (domestic) product and gross national income. These indicators are used because of the relative ease offinding and understanding them. According Hokrová and Taborská (2008) they have their limitations — they measure onlyformal monetary policy and do not include the informal economy, or social, political, cultural and environmental aspects of development. It was therefore necessary to create a new indicator that reflects the issues of development andmaturity, and thus measure the overall socio-economic development.
According to Todaro and Smith (2011), the most used indicator to measure socio-economic development is called theHuman Development Index, HDI. This is also the indicator which has been used by the UNDP since 1990. The HDIindex clearly brings a different perspective on development issues and should be better able to emphasize the effect of other than just monetary (economic) factors on the economy of a country. The basis of the HDI index is greaterexplanatory power, which is to follow economic development, or sustainable development in general. The actual indextakes values from 0 (lowest level of human development) to 1 (highest human development).
Because economic, respect. socio-economic development is very closely linked with the problems of poverty, which can not be measured only by income, another index was developed to measure it (and therefore its impact on other aspects of the development of individual economies), the Human Poverty Index, HPI. Today poverty is considered to be one of the most pressing problems of the globalized world, which is a very comprehensive and complex concept. International organizations, governments and people perceive poverty increasingly as a phenomenon that must be eradicated, or mitigated in its impact, if it of it will remain a social brake on development.
This paper deals with the development of both human development and poverty indexes in general and, secondly, theirempirical research focusing on the poorest part of the world — the forty-eight least developed countries, LDCs. A two-sided comparison of traditional and new formulations of these indices found significant differences in achieved levels.The method of description, analysis and empirical verification based on mathematical formulas was used in the paper.
Methodology of Human Development Index Calculation
The beginning of Human Development Index use dates back to 1990 when the UN Development Programme (UNDP)published the first Human Development Report (UNDP, 1990), which established the need of measuring humandevelopment, which is a more appropriate variable than previously used GDP. Human development has two forms,which should be in balance, the formation of human capabilities in terms of improving health, increasing knowledge andskills to meet human need and their own skills and competence, the free time, job security, cultural, social and political events. In essence, human development, where it is implemented is clearly and directly dependent on income. It is therefore necessary to examine other variables that point out much better the potential of the country and what theoptions currently are in human development. In 2010 there was a significant change in the index calculation and thereforethe first index used until 2009 will be analyzed, due to the length of the time series, and then the changes that weremade at this index will be describe, including practical applications.
Calculation of Human Development Index to 2009
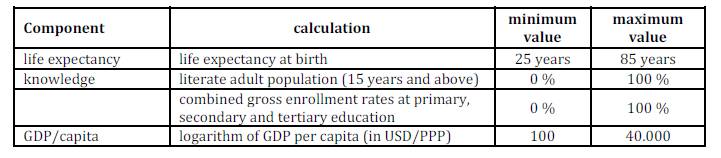
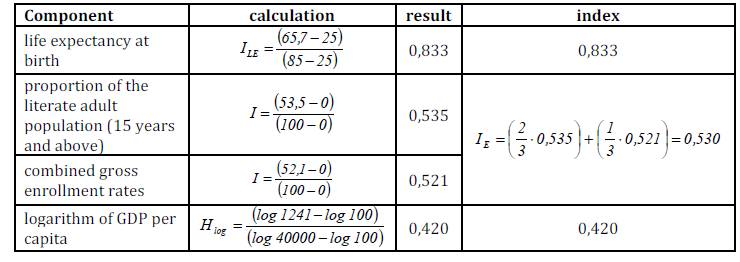
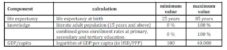
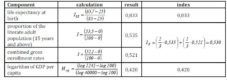
The three components that made up the HDI in 2009, were life expectancy, knowledge and living standards. Life expectancy is expressed by life expectancy at birth, knowledge is made up of two components – literacy in the adult population and a combined share of enrolled pupils / students and living standards, which were then expressed throughGDP. Each dimension is represented by another index – index of life expectancy, education index and knowledge of living index is presented with GDP.Because the index of education includes two components, we need four calculations, as shown in Table 1.
Table 1: Specific HDI Values of Individual Indexes HDI to 2009
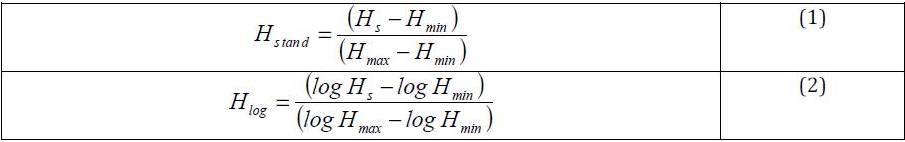
To determine the various indices two types of calculation were used: a standardized index of life expectancy index and education (Formula 1) and logarithmic calculation for the standard of living index (Formula 2).
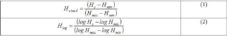
Where: Hstand — standardized value, Hlog — logarithmic value, Hs — real value, Hmin — minimum value, Hmax — maximum value
The calculated three indices (life expectancy index, education index and GDP index) is then applied to calculate the overall index, HDI, a simple arithmetic average, as shown in equation (3):

Where: ILE — life expectancy index, IE — the index of education, IGDP — living index
Let’s see how the calculation of the HDI looked in practice. The economy of Bangladesh was chosen for the purposes of our analysis, one of the LDCs, which was located in the middle of the rank (146th place overall out of 182 countries surveyed, UNDP HDR, 2009). In 2007, according a year to the comparison was made in 2009, the population lived on average 65.7 years, the literacy level was 53.5 percent of the adult population, the combined enrollment for 52.1 percent of all potential students at the three school levels and GDP per capita amounted to 1.241 USD (see table 2).
Table 2: Calculation of Individual HDI to 2009 on the Example of Bangladesh
After calculating the various indices we can proceed to the modeling of the total index of 3 in respect of the values displayed in relation 4:

Calculation of Human Development Index Since 2010
Human Development Index is used as the primary indicator for assessing long-term improvement of human developmentin three dimensions — a long and healthy life, access to knowledge and decent standard of living (UNDP HDR, 2010). Because of the need to improve their explanatory power, the calculation method of two of the three dimensions (healthindicator index is the only one which has remained unchanged), have changed so that the literacy rate of the populationhas been replaced by an indicator of expected years of schooling, the combined gross enrollment by the average numberof years of education (knowledge dimension) and dimensions of living standards is now measured by GNI per capita inpurchasing power parity to the USD.
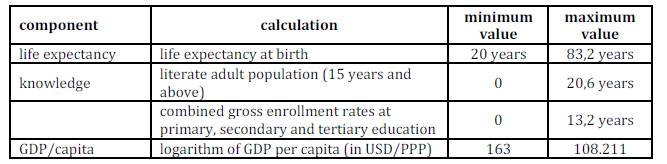
HDI index calculation required that the values were in the range from 0 to 1, and therefore were determined for eachdimension of the minimum and maximum values (based on monitoring from 1980 to 2010), but in different proportionsthan it was before. According UNDP HDR (2010) all minimum values were set so that the values of their levels ofhuman development have not been possible, the maximum values correspond to the specific values obtained in someeconomies (see Table 3).
Table 3: Specific Values of Individual Indexes HDI Since 2010
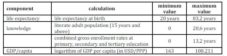
The minimum value of life expectancy has been identified as a ”living age“, then the maximum value according to age in Japan in 2010. The minimum value of the expected length of schooling corresponds to 0, and the maximum 20.6 years in Australia in 2002. Likewise, the minimal value was the average length of school education (ie, 0) and the maximum value, the corresponding data in the U.S. in 2000. These two indicators for index calculation are now learning the same weight and the maximum index value corresponds to 0.951, which was value in New Zealand in 2010. The standard of living index was the minimum value of 163 USD (in PPP), which has calculated for Zimbabwe in 2008, and the maximum value is determined by the income of the United Arab Emirates in 1980. Also, the calculation was determined based on natural (not normal) logarithm.
The overall HDI index was previously calculated as the arithmetic average of all indices. This method allowed for there to be substitution between different dimensions, i.e. low values in one dimension can be compensated by high values of another dimension. Since 2010, the calculations have been performed using the geometric mean, which eliminates the above substitution and ensures that such a one percent decline in life expectancy was of the same weight as a one percent decline in the index or index of education standard of living.
Another change is the calculation according to the latest data – not with a two-year delay, as it was in the HDI calculations in 2009 (based on data from 2007), but almost all indicators (except for life expectancy, which the data was one year old, see Barro and Lee, 2010), was based on the 2010. Due to the lack of some data, some of the original 182 countries surveyed (except for Iraq, Kiribati, North Korea, Marschall Islands, Micronesia, Monaco, Nauru, Palau, San Marino, Somalia, Tuvalu and Zimbabwe) were excluded (Antigua and Barbuda, Bhutan, Cuba, Dominica, Eritrea, Grenada, Lebanon, Palestine, Oman, Saint Kitts and Nevis, Saint Lucia, Saint Vincent and Grenadina, Samoa, Seychelles and Vanuatu), and thus 168 economies plus Hong Kong as an independent territory were monitored.
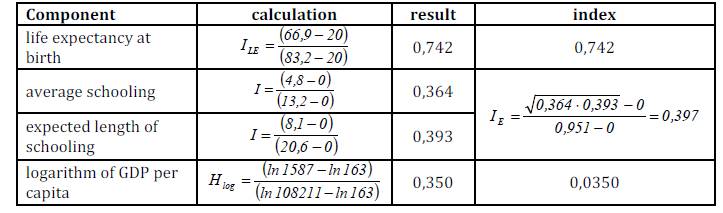
Let’s look now how the method of calculating the HDI index for a particular economy looks. To maintain continuity we will stick to our example – we will then analyze Bangladesh (see Table 4). The economy has, unfortunately, a new way of calculating the lost ground. While the 146th site has moved to 126th place (Owing to the smaller number of observed economies), the value of the HDI index fell to a group of low human development index.
Table 4: Calculation of Individual Indexes of HDI to 2009 on the Example of Bangladesh
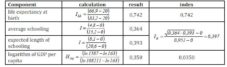
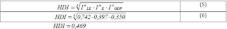
The calculating principle of the total index then corresponds to the new approach — it is calculated as the geometric meanof all the above indices, which shows the formula 5 and formula 6 for the specific values of Bangladesh.
Methodology of Calculation of Human Poverty Index and Multidimensional Poverty Index
Like the Human Development Index the index for measuring poverty underwent significant change in 2010. From 1997 to 2009, poverty was measured by Human Poverty Index – HPI, it has been changed since 2010 and the index became known as Multidimensional Poverty Index – MPI. In the following sections of this chapter will analyze how the former index HPI differs from the MPI index.
Calculation of Human Poverty Index
Measurement of poverty based on this index was carried out from 1997 to 2009 in 135 economies and two variants were distinguished: for developing economies (HPI-1) and developed economies (HPI-2). These indices are distinguished byusing other starting values for the calculation – P1 component by HPI-1 is based from the age to 40 years, the HPI-2 to 60 years, the actual calculation, the HPI-1used ratio of 1/3, the HPI-2 ¼ ratio. With regards to our topic, we will use the index HPI-1. According to UNDP (HDR, 2007/2008) the HPI is an index that measures deprivation for the three components listed in the HDI: a deprivation of a long and healthy life, education and adequate standard of living. These three dimensions are expressed through the following indicators:
- Long and healthy life – the degree of probability of death at a young age, which is expressed as a predictor of the likelihood of reaching the age of 40 years (in the index pointer P1)
- Education – exclusion from reading and communication, which is expressed in the literacy rate (in the index pointer P2)
- Adequate standard of living – lack of access to overall economic resources, which is measured by indicators of the portion of the population having no access to drinking water (half a weight) and indicators of the number of malnourished children under five years of age (second half of the weight), an index it is pointer P3.
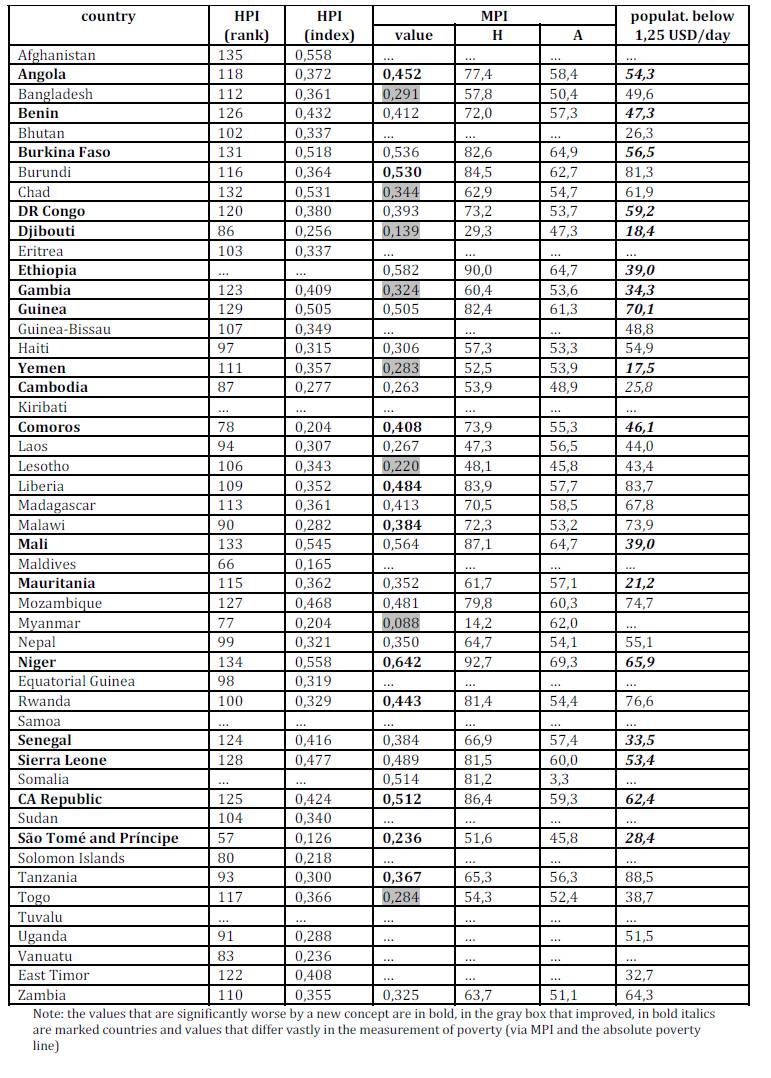
All these indicators are expressed in percentages, the overall index HPI had values between 1-100, the higher the value, the greater the deprivation. However, it is interesting to note that in some cases it did not show a direct correlation between the value of the indicator and the ratio of the population living below the absolute poverty line ($ 1.25 per day) as should logically follow from the measurements. For example, in Tanzania in 2009 the HPI showed index values of 30 and 88.5 percent of the population lived below the absolute poverty line, Niger, which was on 134th place, showed HPI value 55.9, but “only” 65.9 percent of the population lives below the absolute poverty line.
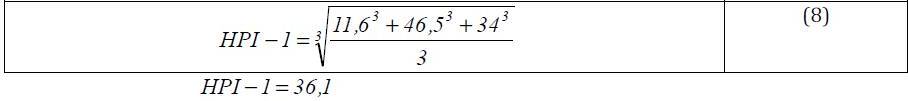
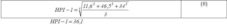
Methodology for calculating the human poverty index was calculated as the arithmetic average of the parameters P withthe same weight, as shown by the relationship 7.

Where: α – shows a coefficient whose value reflects the importance given to the deficiencies (the higher, the greater the importance they have), here it is a fixed value of 3
As with the HDI index, we will again use the example of Bangladesh. The basic data for calculating the HPI for 2009 are:
- P1 – the probability of failure to reach the limit of 40 years of life (the average estimate in the years 2005-2010) 11.6 %
- P2 – literacy rate (average 1999-2007) 46.5 %
- P3 – population with insufficient access to drinking water (in 2006) 20.0 %
- P3 – the percentage of malnourished children (average 2000-2006) 48.0 %
The last two indicators calculated average P3 = ½ (20) + ½ (48), which is 34 %, and we can calculate the HPI index itself, according to equation 7.
Among the least developed countries themselves, there were large differences in the above index. While the example of São Tomé and Príncipe and Maldives showed low values (12.6, or 16.5 percent), Afghanistan and Niger had the highest values of all measured economies (59.8 and 55.8). In these latter two economies their high HPI values corresponded to their position in terms of HDI (Afghanistan was on the penultimate 134th place, last was Niger).
Calculation of Multidimensional Poverty Index
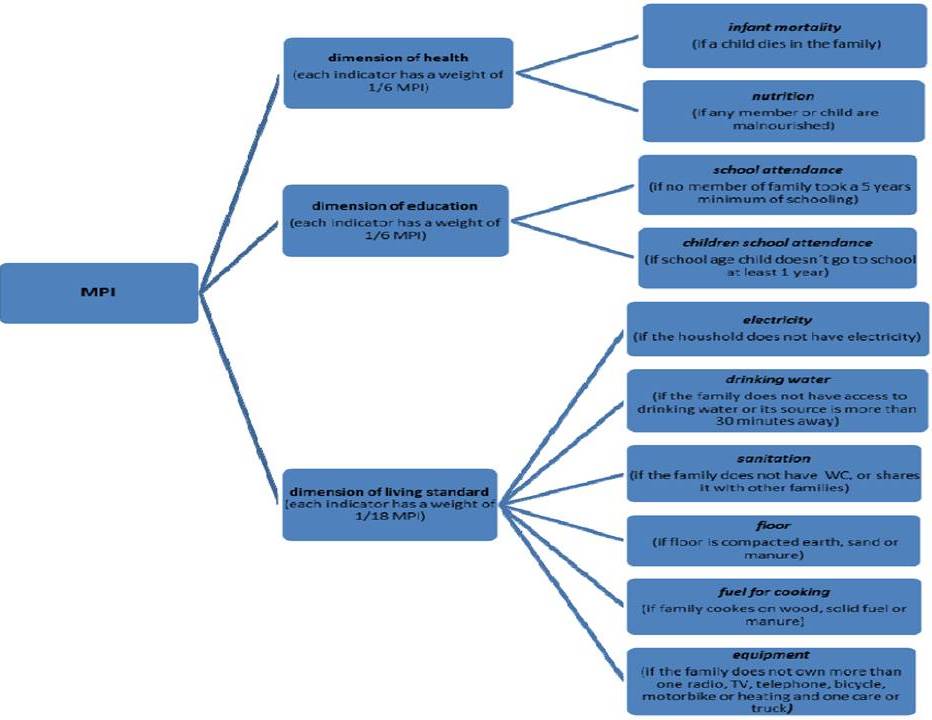
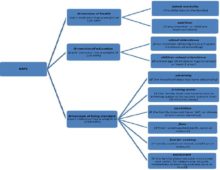
Human poverty index, which was used until 2009, included various aspects of non-monetary deprivation of the population studied economies and contributed to the measurement of poverty, but did not depict deprivation suffered by individuals or households. The new MPI attempts to modify this. Its essence is based on the identification of the same household deprivation in education, health and living standards. The dimension of health and education is based on two indicators, while the dimensions of living standards on six indicators, see Annex 1.
MPI index reflects deprivation of poor households at the same time. But how is multidimensional poverty defined here? At the first sight it might seem that the family, which is deprived in one of the ten indicators, may be designated as poor. But it is not so. Take for example if the oldest member of the family is cooking on wood, it may still not be considered a poor family it has been determined, as wrote Alkire and Santos(2010), that the multivariate poor are families that are high deprived in some indicators (from two to six) according to their weight if the amount exceeds 30% (corresponding to an index value of 3). The explanation is as follows (in the index form):
- Weight of the dimensions of the total is 3.33 for each indicator, the person who reaches values greater than 3 is considered to be poor, one that reached every 2 or three is vulnerable or there is a risk of poverty
- The dimension of health and education is the weight of each indicator 1.67 (1/6 of 10), in the dimension of living standard each indicator has the weight 0.55 (1/18 of 10), that means that a family is considered poor when it is deprived:
o In two indicators of health or education or
o In all six indicators of living standards or
o In one indicator of health or education and three indicators of living standards.
If we give a concrete example of a particular family, I researched the family of Valeria from Madagascar (according to OPHDI, online). Her family suffers from deprivation in eight indicators of ten, namely the lack of schooling and child education (both indicators with a value of 1.67), malnutrition (1,67), no electricity, access to drinking water, sanitation, has a dirty floor and no equipment (each with a value of 0.55). Her total deprivation is expressed by the equation 9 and corresponds to almost 78%.

Alkire and Foster (2007, 2009) used a different methodology for calculating the MPI. We mention here that the UNDP uses for its statistical reporting, when the MPI index is calculated as the product of two values, the values of H, which represents the population (incidence) in the multidimensional poverty and the values of A, which is an expression of intensity of deprivation, i.e. the intensity of poverty (see relation 10 to 12). Both values are given as percentages, after their conversion to give the form of an index value of MPI.

When

Where: q – the number of poor people, n – the total population
And when

Where: the numerator – the proportion of weighted indicators, which is poor (i) deprived, d – number of parameters (at MPI, the number 10)
The calculation methodology was chosen because the combination of H and A corresponds to the dimensional monocity that defined by Alkire and Foster (2007). It has a higher explanatory power than an indicator H itself because it reflects the difference between the poor who are deprived as in six of the 10 indicators and those who are deprived as in three out of ten (the first ones are poorer than the others, although both achieved a 30% rate of poverty).
Result and Findings
Human Development Index and indexes of poverty (HPI and MPI) are very important indicators measuring of living standards and human suffering. It serves not only for analysis, but also as a basis for the activities of international organizations such as the UN, World Bank and International Monetary Fund or the integration grouping that they have in their programs and objectives (Millennium Development Goals, the HIPC Initiative, Initiative of EBA) grounded help and improvement of the conditions for those countries that are not economically “strong” and need the support of the world. Therefore, the focus on developing countries and least developed countries and the value of these indexes serve them in this effort as very important indicators.
Human Development Index in LDCs
Although according to the UNDP HDR (2010) world index the HDI has increased for all economies on average by 18 percent since 1990 (and by 41% since 1970), and although only three economies have a lower HDI index than in 1970 – two of which are LDC countries (Democratic Republic of Congo and Zambia, Zimbabwe is the third economy), there are still large disparities in human development between countries. While the aforementioned economies made no progress, other LDCs can be added to the most progressive countries (to the ”top ten“), in terms of improving the HDI index values- these include Nepal and Laos. Nepal showed the third best improvement in the index (after China and Oman) and Laos finished sixth from 1970 to 2010. Ethiopia has made considerable progress in all indicators except indices if HDI income (reached the eighth fastest growth in the world and the HDI indicator eleventh place). Benin and Burkina Faso also rank among the 25 countries with the fastest progress in the world.
In its HDI-growth Nepal is somewhat surprising (from a group of low income countries is now in a group of middle level), because despite its natural conditions and conflicts, it has been able to make significant progress in the field of health (reducing child mortality, life expectancy has increased to 87 percent global average) and education (an increase in the number of children enrolled in schools and increased literacy of the population). This is all based on appropriate public policy, involvement of local residents in the management, local resource mobilization and decentralization. On the other hand, there was only a slight increase of pensions and there is a high unemployment in the country. Also Burkina Faso’s economy, which has achieved great progress indeed – its HDI index grew very quickly – achieved great improvements in health (access to drinking water, access to basic services), education (percentage of students enrolled increased from 44% in 1999 to 67 percent in 2007) and income poverty (decrease by 14 percent to 57% in the period 1994-2003). Despite all, this economy is still in last places in the HDI values (from the penultimate position it has moved up only nine spaces). This effect, when despite the growth and macroeconomic stability the economy remains at a low level of human development, is known as ”Burkina paradox“ (see UNDP HDR, 2010, p. 30).
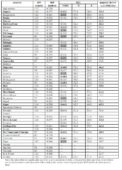
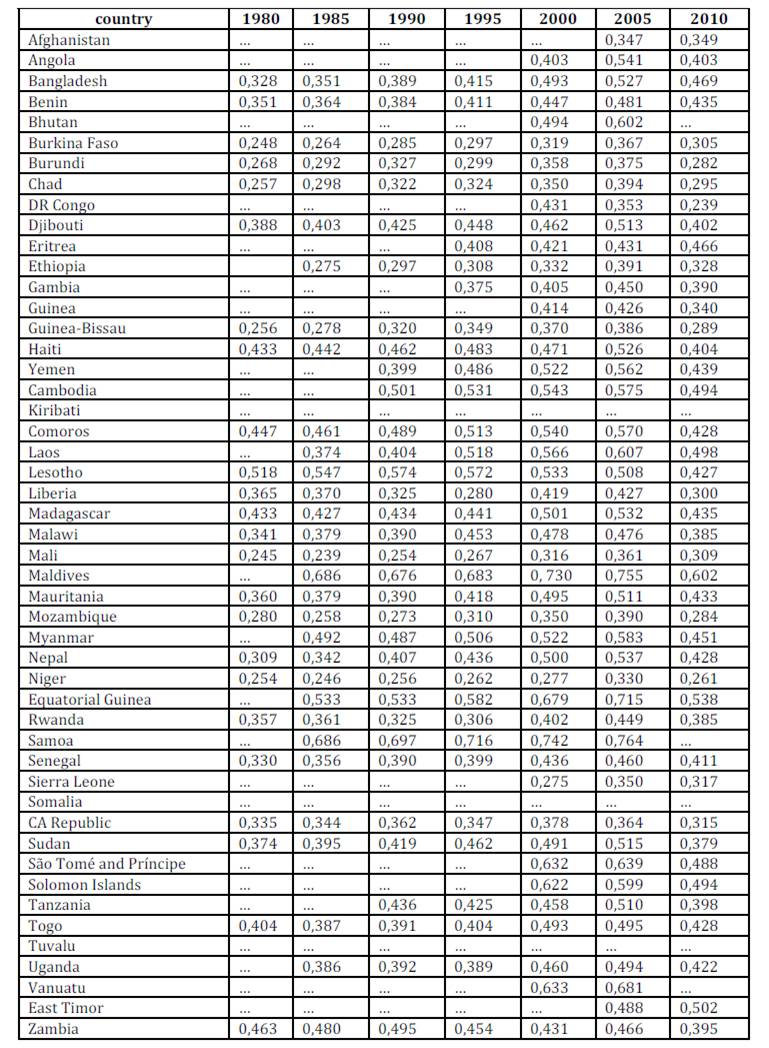
Undoubtedly not only economic policy and its creators, but also (and often especially) political stability and the lack of conflict and wars, have an influence on the HDI-growth and thus on human development. An example is the Democratic Republic of Congo, which is one of those economies that have not experienced progress, the HDI indicator even declined, primarily due to armed conflict and civil war. Like Sierra Leone, the GDP of which GDP decreased by 50 percent during the eleven-year conflict, or Liberia, which saw GDP fall as much as ninety percent. The position of each of the least developed countries in the field of human development from 1975 to 2010 is given in Annex 2. The gray fields show the economies, which recorded significant progress (such as already mentioned Nepal, Laos and Ethiopia), bold the economies, which see progress or even decrease (DR Congo, Zambia and Burundi).
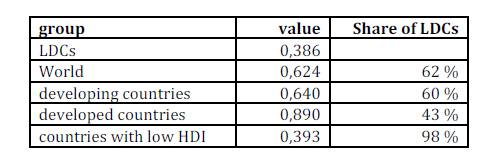
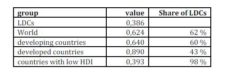
If we look at LDC countries as a whole according the new methodology of UNDP, in 2010 the average index HDI in the LDCs accounted for 62 % of the world’s HDI, HDI share in developing and developed countries was even lower and did not reach the value of the group with low human development (see Table 5).
Table 5: Indicators HDI Values and Equity Values of LDCs on Them (in 2010)
Indexes of Poverty in LDCs
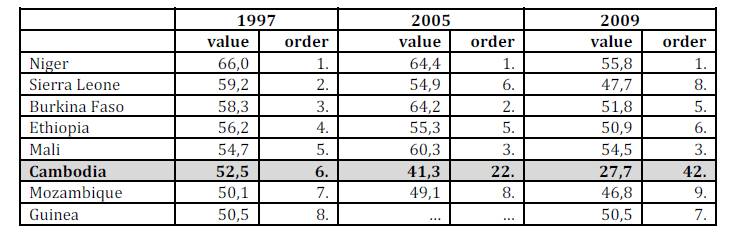
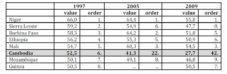
HPI-1 index was introduced in 1997 for generally 78 developing countries (this number gradually increased, in 2005,these economies were already 103, in 2009 to 115). With this number grew also studied economies of LDCs, which in 1997 were 29 countries, in 2005, there were 39 and in 2009 the 43 economies. Although an increasing number of countries were analyzed, the order “at the end of the table”, i.e. those in a high state of poverty, did not change much.The following Table 6 shows the status and value of the HPI index for the least developed countries according to their order (UNDP HDR 1997, 2005, 2009). The numbers indicate the order of the countries position from the end that means that one is the last, two is penultimate, etc. The only country that managed to escape from poverty (in the conditions ofLDCs) over time, is Cambodia, other economies have remained largely in their places.
Table 6: Development of HPI-1 for Selected Countries in 1997, 2005 a 2009
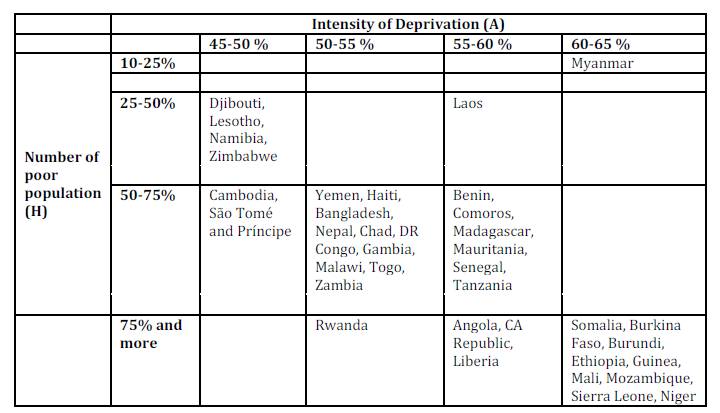
MPI index was introduced in 2010 and is calculated for the lower number of countries than the HPI index, which also applies to LDCs – a total of 48 countries were subjected to analysis of 38 economies whose categorization is presented in Table 7. The table divides the observed economy into two categories of MPI, within which are also created groups of countries according to the percentage of poor and deprived people. We can see that the greatest concentration of LDCs is 50 % and above of the poor and the same goes for the other category – the intensity of deprivation.
Table 7: Classification of LDCs in the MPI
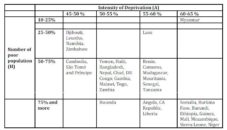
If we look at the evaluation of individual countries in terms of regions (see Annex 3), the evaluations are for countries in Africa, then South Asia (Pacific data are available), followed by Haiti, as the only country in the Americas. MPI index is the worst in Niger (0.642), which also has the highest percentage of poor population (92.7 %) and there live most deprived population (nearly 70 %). Very close to this economy is Ethiopia, the MPI index of which is 0.582, the population is 90 % poor and nearly 65 percent intensely deprived. Mali, Burkina Faso, Burundi, Somalia and Guinea follow (these countries achieve in MPI absolute value). In South Asia, Nepal has achieved the worst results (0.350), with almost 65 percent poor and 54 percent of the deprived population. Surprising is the very low value of the index MPI in Myanmar (0.088, comparable with Indonesia), where only 14 percent of citizens are multidimensional poor, but 62 % is the intensity of deprivation.
On closer examination we find that in this economy not all data are available (such as lack of mortality, electricity or fuel for cooking), which of course distorts the result. As for Haiti, the amount of MPI is slightly below the level of Nepal (0.305), with 57 percent poverty and 53 percent intensity of deprivation, but the earthquake that took place in 2010 and worsened these results is not taken into account. Annex 3 also provides a comparison of two indices of poverty, where bold types indicate the substantial deterioration in the index (e.g. Angola, Comoros and Malawi), gray box the improvement in the case of Bangladesh, Lesotho and Togo, and the economy, which are indicated in bold italics, incl. the last column of the table, give information about the large difference in the poverty rate measured by the MPI index (or pointer H) and by the absolute poverty line, which the UN set at $ 1.25 per day (for example Niger, Senegal, Mauritania, Angola and Benin).
If we compare the “most successful” (after the elimination of Myanmar due to incomplete data) and “most unsuccessful” LDCs, namely Lesotho and Niger (see Figure 1), from the perspective of the ten indicators, we can see how not only the economic level, but especially political stability affect poverty and things associated with it. Lesotho has large deposits of diamonds and significant revenues from exports of water to South Africa, and even though there was a dictatorial regime, Niger is much less politically stable (also in 2010 it was hit by famine). The desktop depicts the same rule as the value of MPI – the smaller, the economy and its population is less poor.
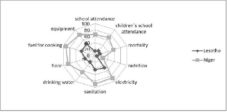
Fig 1. Comparison of Poverty Rates of Lesotho and Niger MPI Indicators (in %)
Discussion and Study Limitations
Analysis of developing economies should not be based only on indicators such as GDP or export openness, but it should be a comprehensive reflection of overall growth. It should also be based on indicators of socio-economic development, which are associated with human development, health and education levels and poverty rates. For their measurements using two indices – Human Development Index HDI and the index of poverty (by 2009 it was the Human Poverty Index HPI, from 2010 Multidimensional Poverty Index MPI). These indices are inclusive, not only considering the economic side (through the measurement of living standards, but also health and education). Both of these indexes underwent significant changes in 2010. Although in many cases LDCs have achieved significant progress in the last forty years, they still have very low values of these indices and it is very unlikely that in the near future they can vastly improve their situation.
Although the index HDI is considered to be an indicator with greater explanatory power than simple GDP, even it cannot completely reflect the situation in the economy, which complicates the prediction of future development. Neither does rapid human development mean that the country’s economy is stable and can continue to evolve at the same pace. Another drawback appears to be that the index does not include variables related to political and human freedoms, regimes, etc. The political situation has a significant influence on the development of economies and, therefore the involvement of other indices, such as an index of democracy, would very likely decrease the value of HDI. It is more than clear that the inclusion of this particular index of democracy cannot occur (although UNDP is an independent organization), because it would result in the countries protesting against the methodology or even boycotting the UNDP activities, and thus the United Nations. One problem of the explanatory power is the abstract side of some indicators, in the case of quality of life it may not be just a long life but a life lived happily and in good health, plus longlife alone is no guarantee of human development. Levels of environmental health and sustainability also have an impact on development (including the human), which are included in the HDI index only indirectly – the polluted environment (air, water, landscape) affects human health, i.e. the length and quality of life. Still, however, a more appropriate classification might be one which would include the quality of the environment in the surveyed economies in some way, thus the explanatory power of the HDI index can be extended.
On the other hand we can conclude that the second of the above-analyzed indexes – the index of poverty – underwent a very significant change in 2010 and now reflects not only the degree of poverty of the individual economy’s population, but also their level of deprivation. We can only hope that both indexes are accepted for the analysis stage of development and poverty and will continue to be applied and developed in practice.
Conclusion
If we look at specific values of Human Development Index and Indexes of Poverty for individual Least Developed Countries, we can make two conclusions. The first concerns the HDI index and its changed methodology. It caused the deterioration of values in almost all countries, except Afghanistan, Eritrea and East Timor, which, however, showed only slight improvement. From this point of view we can conclude that the socio-economic situation does not improve, although in most LDCs Gross National Product grows. The second relates to indexes of poverty, where the differences are more apparent – in the case of the ten economies the results of calculation of multidimensional index worsened, eight economies experienced improvement and sixteen economies did not change their position by the new measuring.
References
Alkire, S. & Forster, J. (2007). “Counting and Multidimensional Poverty Measurement,” Oxford Poverty and Human Development Initiative, Working Paper No. 7. Oxford Department of International Development, Oxford.
Publisher – Google Scholar
Alkire, S. & Forster, J. (2009). ‘Counting and Multidimensional Poverty,’ In von Braun J. The Poorest and Hungry Assetments, Analysis and Actions. International Food Policy Research Institute, Washington, DC.
Alkire, S. & Santos, M. E. (2010). ‘Acute Multidimensional Poverty: A New Index for Developing Countries,’ Oxford Poverty and Human Development Initiative, Working Paper No. 38. Oxford Department of International Development, Oxford.
Google Scholar
Anand, S. & Sen, A. (1994). “Human Development Index: Methodology and Measurement,” Occasional Paper 12. Human Development Report Office, New York.
Publisher – Google Scholar
Hokrová, M. & Táborská, S. (2008). Globální Problémy a Rozvojová Spolupráce: Témata, O Která Se Lidé Zajímají. ÄŒlověk V Tísni, Praha.
Todaro, M. P. & Smith, S. C. (2011). Economic Development. 11th ed. Pearson Education, Essex.
Publisher
UNDP. (1990). “Human Development Report 1990: Concept and Measurement of Human Development,” [Online]. Oxford University Press, New York. [March 26, 2012]. Available: http://hdr.undp.org/en/reports/global/hdr1990/chapters/.
Publisher
UNDP HDR (1997). Human Development Report. Oxford University Press, New York.
Publisher
UNDP HDR (2002). Human Development Report. Oxford University Press, New York.
Publisher
UNDP HDR (2005). Human Development Report. Oxford University Press, New York.
Publisher
UNDP HDR (2007). Human Development Report. Oxford University Press, New York.
Publisher
UNDP HDR (2009). Human Development Report. Oxford University Press, New York.
Publisher
UNDP HDR (2010). Human Development Report. The Real Wealth of Nations: Pathway to Human Development. Palgrave Macmillan, New York.
Publisher
Appendix 1: Indicators of Multidimensional Poverty Index
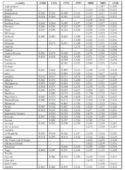
Appendix 2: Development of HDI Index by Selected LDCs in Years 1975-2010
Appendix 3: Comparison of LDCs on the Basis of Poverty Index (HPI-1 and MPI) and the Absolute Poverty Line (Index and Percentage)