Introduction
In many developing and emerging economies the post-deregulation era has been characterized by capacity shortages, major fluctuations in supply and high energy costs. Reforms of the electricity industry in Brazil, China, India, Russia, and many other emerging countries, have resulted in high prices and low levels of investment in infrastructure.
Once again, governments are getting entangled in a new industry game. With no further structural and institutional reforms, the current level of competition in the electricity industry would not bring the anticipated efficiency gains. Prices are likely to increase over time and the current problems with respect to the security of energy supply would not be resolved. Once more, emerging economies need to develop new plans for their electricity industry, new market designs and new institutional frameworks. These issues are getting equal attention in some industrialized countries, like the US and the UK (Frontier Economics, 2011; Apt, 2005).
Once more, both developed and emerging economies develop new energy policies and set explicit goals for their reforms. These goals are: reduce the wholesale and retail electricity prices; improve capacity margins and; reduce costs for generation and distribution. Further, reduce carbon dioxide emissions at the generation level and the protection of the environment is increasingly becoming an additional goal for many governments in developed and emerging countries. To achieve this goal, the industry must use renewable energies and other alternative sources of energy but the latter create new technological and institutional challenges.
Regulators around the world (the UK, the USA, the EU, Canada, Brazil, etc.) are being considering a number of alternative forms of regulation but there is no consensus on the best model of regulation and price determination mechanisms. The merits of each model are still debated and regulators are searching for the best approaches to providing incentives that would change the structure of the electricity industry and the behavior of firms. Thus, the crux of the current debate is the design and adoption of strategies that allow firms to fix prices at a reasonable level and incentivize them to invest adequately in infrastructure while respecting the environment.
The current pricing mechanisms used in the wholesale electricity markets are deeply rooted in the belief that perfect competition is inherently beneficial to society, at least in the short run. Although auction markets and the bidding process that is used to determine prices is generally well-known, particularly in markets with storable goods, nonetheless, in electricity industry the non-storability principle makes the auction markets and the mechanism for price determination more complex. It appears that there is still a misunderstanding of how these bidding pricing mechanisms work in practice.
This case study purports to illustrate precisely the bidding mechanism and how it can be applied in practice using an in-class simulation approach. The simulation makes clear why auction markets are widely used in electricity industry and how they work in practice. It clearly illustrates the determination of prices at the wholesale level. This information is useful to graduate and undergraduate students and industry executives and practitioners who want to understand the mechanisms of price determination in the electricity industry.
In developing and emerging economies deregulation was usually accompanied by a restructuring of the industry and the privatization of the incumbent – the sale of the state electricity firm to the private sector. The aim of the restructuring and privatization was, inter alia, to bring market prices down to the competitive levels and increase the efficiencies of the electricity markets. An additional goal of privatization/deregulation was to bring cash to the government’s vaults and make their national markets more dynamic by allowing private capital to take the decisions of investment in capital-intensive infrastructure industries.
Typically, in deregulated markets, demand and supply determine prices and every variation in either demand or supply makes prices volatile. Demand may fluctuate according to the time of the day/night and the season of the year, while supply may fluctuate because of variation in weather conditions, technical breakdowns, strikes, etc. Another important factor that may limit the supply of electricity is the availability of fuel or other inputs (gas, coal, water, winds, radiation, uranium, etc.) which are used to generate electricity. The latter is not a storable commodity and its instantaneous consumption requires an instantaneous generation too. In the wholesale competitive electricity markets, these demand and supply characteristics make prices very volatile and increase the business risks of generators.
Few developing and emerging economies have also introduced competition at the retail level too (Brazil, some parts of India). Nonetheless, most of them are rather reluctant to deregulate their retail markets fearing that the price volatility that deregulation entails would have a negative impact on household finances. Regulatory agencies in these countries regulate the industry and fix retail prices at low levels, chiefly through cross-subsidies (China, South Africa, Senegal, Brazil, India, etc.). Social considerations are thus the most frequently used arguments to justify retail electricity prices at low levels, occasionally at levels lower than the cost of production (Gentzoglanis, 2012). Despite the regulation of electricity at the retail level and cross-subsidies, consumers feel that prices are not necessarily as low as they should. This is generally true and in some countries (Haiti, for instance) it may be attributed to lack of investments in infrastructure and shortages in fuel or other inputs used in the generation of electricity.
Lately, electricity markets have become more global. Through the interconnections of the transmission lines among neighboring countries, the electricity of a country becomes available to another country, stimulating trade and economic growth. This is true for industrialized economies and as much so for developing and emerging countries. Some developing or insular countries are deprived from these possibilities of interconnection and this has as a result to increase domestic prices.
Although there are many models that can be used to determine prices at the wholesale level, two of them are extensively used in practice; the European Power Exchange model and the American Power Pool model. In developing and emerging countries the financial markets are not well-developed. For them, the Power Pool (PP) model is more suitable. Basically, the PPs in developing and emerging economies function like the PPs in the US with the difference that the US PPs have reached a high-degree of sophistication. It is thus interesting to know how electricity prices are determined at the wholesale level in the PPs in developing and emerging countries. The pricing mechanisms are explained in detail next.
Basic Economic Principles and the Mechanisms of Price Determination in the Wholesale Electricity Markets
Chiefly, Power Pools and Power Exchanges use two mechanisms to determine prices, the pay-as-bid and uniform pricingauctions. Under both schemes, an independent system operator (ISO) invites bids from eligible and qualified bidders. Each bid specifies the number of megawatts the generator is able to sell, the time period during which it is able to generate and the price per megawatt hour. Under pay-as-bid scheme, each generator is paid its bid. The bids are classified in an ascending order, and as long as demand is higher than supply, the ISO continues buying electricity starting with the lower bids till equilibrium is reached. In this market, there are as many prices as the number of bids, up to the equilibrium.
In a uniform pricing scheme, a single price emerges. The ISO aggregates supply and demand and equalizes them at a single price (Baldick, 2009). The uniform price corresponds to the marginal cost of the least efficient generator. That is, every bidder gets the same price, irrespectively of its own bid. This mechanism is simpler than the pay-as-bid scheme and is used by most of the Power Exchanges and Pools. The simulation below explains this mechanism.
Power price determination is the single most important parameter to consider in any business, consumption and policy decision. Governments, regulatory agencies and competition authorities are deeply concerned with the level of electricity prices because electricity is used as an input of production in every industrial process. Understanding the mechanisms of price determination is thus essential for policy purposes. But it is also equally important to generators and users of electricity, should the latter be interested in the development of strategies which increase their profits and/or reduce their costs of electricity consumption.
In perfectly competitive markets, Pareto optimum is achieved because prices correspond to the marginal cost of production. At competitive market prices, consumers and producers are equally satisfied because their surpluses are maximized. In these markets, allocative efficiency is achieved because scarce resources are efficiently allocated to the production of electricity and other goods. Investments in electricity infrastructure (generation, transmission and distribution) are optimal. As far as consumption decisions are concerned, optimality conditions are also achieved. Perfectly competitive outcomes are thus the most desirable ones for economists and policy makers. It is believed that the auction markets used in PPs to determine prices have precisely the perfect competition market characteristics. From a theoretical perspective, prices determined using these mechanisms should then be optimal. The experience with wholesale electricity markets has not been conclusive because the real results differ from the theoretical ones (Joskow, 2008). This may be attributed to the fact that either electricity markets are naturally uncompetitive and/or the actual design of the market is not done appropriately (Slupik, 2012). Nonetheless, it is advisable to examine, in some detail, the functioning of the uniform pricing mechanism used in PPs to determine prices.
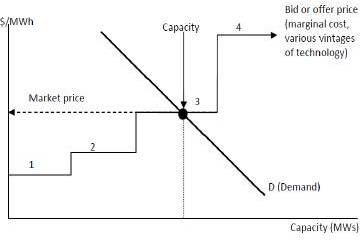
In PPs marginal cost is determined by the “marginal power plant”. As it is generally the case, the marginal power plant is usually the one having the most expensive technology. Base load (or base load demand) is satisfied instantaneously by low-cost generators which operate at their optimum capacity. Commonly, electricity generators use a portfolio of technologies to generate electricity. The costs associated with each technology in the portfolio are different because of differences in vintages of technology. Nonetheless, it is in the interest of each generator to use the least expensive source of energy to produce electricity. In deregulated electricity markets, the ISO (Independent System Operator) is the entity that allows supply to meet demand. It makes predictions about next day’s demand and asks generators to bid to satisfy the predicted demand. Adjustments in supply occur by taking into account the real-time discrepancies in demand and supply. If generators want to be chosen by the ISO, their prices must be competitive. In every time interval (15 minutes, half an hour, an hour, or day-ahead market), the ISO considers generators with the lowest costs possible. Under a uniform bidding process, a single price is announced which is the price of the last-chosen generator, i.e., the most expensive one. Every other generator gets the same price for the MWs sold. Each generator with lower costs than the last one realizes economic profits. The last one realizes normal profits. Thus, the final price is the marginal cost of generating the last MW. Graphically, the process of price determination is illustrated below.
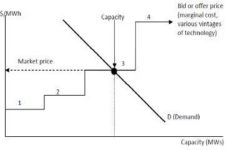
Fig. 1. Market Equilibrium: Price Equals the Marginal Cost of the Most Expensive Electricity Generator
Source: Developed by the author
Figure 1 illustrates how prices are determined in the wholesale electricity markets. Four plants, with various marginal costs, bid to satisfy demand (D). Only the first three are chosen by the ISO. In this graph, demand is actually satisfied by having two generators producing at full capacity and a third one producing just enough to satisfy the remaining demand not satisfied by the first two (residual demand). The market clearing price is the marginal cost of the third (marginal) generator.
Simulation of Price Determination
There are various ways to illustrate the process and the working of the mechanisms used to determine prices in the wholesale electricity markets. A simulation approach is used in this paper. It concentrates on the uniform auction pricingmechanism described above. This is the model used to determine prices in many PPs in emerging economies (Brazil, Russia and India) and in four Power Pools in Sub-Sahara Africa1, Central America (SIEPAC), in the US (PJM market) and in Scandinavia (NordPool). During the bidding process, generators have to have a thorough knowledge of their costs. They have also to know how their costs are expected to vary during the period they will operate their plants to generate power. Thus, the cost of power generation is the most single factor in the determination of the price of electricity in competitive wholesale markets. Besides the cost of generation and the costs associated with fuel and emission permits, there are a number of other factors that affect the fixed and marginal costs of power generation. These include:
- Technology availability which determines the size of the plant and the average and marginal cost of power generation
- Depreciation and plant obsolescence which affect fixed costs and encourage old plants to run more
- Location of the generation plant in the network which makes fixed and variable costs sensitive to distance and
- Provision of ancillary services (necessary for maintaining system reliability and security in electricity markets) which increases fixed and variable costs.
| 1 These power pools are: SAAP (Southern Africa Power Pool), WAPP (West Africa Power Pool), CAPP (Central Africa Power Pool) and EAPP/NB (Eastern Africa Power Pool/Nile Basin). |
Marginal cost is particularly sensitive during peak demand, i.e., in periods when the plant is used intensively to satisfy emergencies. Many market designs have their own systems which provide compensation for plants willing to offer services on a stand-by basis or during emergencies. Therefore, the decision to bid is chiefly guided by the variable costs of generation. This is an important piece of information that students need during the simulation. They also get data concerning the cost for each type of generation unit (hydro, coal, wind, nuclear, solar, etc.). This information is used to make bids and allow the market (the ISO) to determine the equilibrium price and quantity (MWs).
The target audience of the simulation is university students, business executives, regulators, industry analysts, representatives of consumer associations, environmentalists, research and teaching institutions and government officials dealing with energy markets. As the simulation unfolds students and other participants learn and discover a number of points with respect to the functioning of the electricity markets. They gain knowledge of:
- How competitive markets work in practice
- How the bidding mechanism of uniform pricing is used in energy markets
- How and why the marginal cost of the most expensive generator is chosen as the final price in the market and as the most efficient signal for investment decisions.
This case study may be used to teach various courses such as Microeconomics, Industrial Organization and Regulatory Economics, Energy Markets and Regulation, International Trade, Government and Business and Environmental Economics. A case study should be simple, rigorous and its results not so obvious. But it should be easy to replicate. To make the replication easy fictitious but “close-to-reality” data are provided in the appendix. Instructors would thus be able to use it, organize fictitious auction markets and apply the uniform pricing mechanism to determine prices in various competitive environments.
The simulation starts with a graph comparing electricity prices in various contexts and business environments. As a starting point, I normally use figure 2 to illustrate the differences in household prices among a number of countries and offer explanations for these differences. It is mentioned in class that factors which may explain price differences are country endowment in natural resources (used to produce electricity), market structure, cross-subsidies and above all regulation. Here, I diverge and I discuss the traditional (rate-of-return) and incentive-based models of regulation (price caps and its hybrids) and their role in the determination of retail electricity prices. Brief comments concerning the well-known examples of California, Brazil and Alberta (Canada) make the case more powerful, although these examples are not required for illustrating the bidding process used in the wholesale competitive markets.
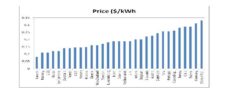
Fig 2. 2011 Electricity Prices for Households — International Comparisons
Source: Author’s compilation from IEA (International Energy Agency), Electricity Information, 2011, http://www.iea.org
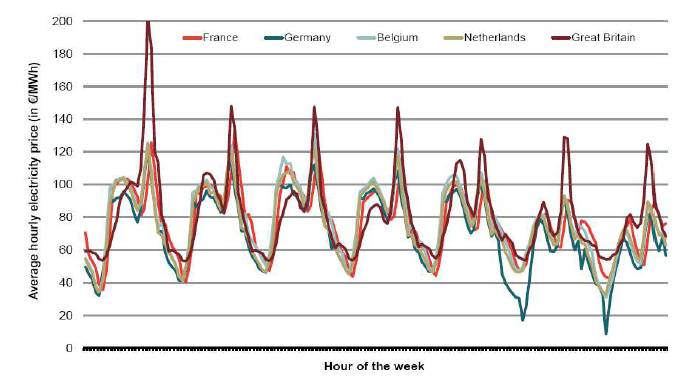
Then, I go on to discuss price determination in the wholesale electricity markets. I use figure 3 to compare hourly price volatility and the difference in prices among various Power Pools and Power Exchanges. Also, figure 3 serves as a starting point to discuss the Law of one Price — why the price of electricity ought to be the same in unconstrained interconnected markets — and why this is not the case in practice. Examples from other industries (primary commodities, oil and currency markets, etc.) may be used to illustrate the law of one price and the conditions under which this law may not be valid. Students realize the importance of information and the absence of barriers to trade in the determination of uniform prices. They get a very good feeling of the functioning of the markets and become able to explain reasonably well why homogeneous products/services, like electricity, may be traded at different prices in various markets or market segments.
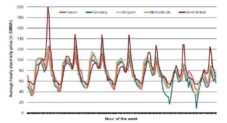
Fig 3. Wholesale Electricity Prices: International Comparisons
Source: Frontier analysis based on EEX, PowerNext, APEX and BELPEX data, p. 50
http://www.creg.be/pdf/NewsOnly/111026-Frontier_Economics-International_Comp_CandI_Energy_Prices.pdf
Electricity is not like other commodities. Its non-storability and its instantaneous consumption require that demand be always met with adequate supply so that the security and reliability of the system is preserved. Electricity, once produced, must be transmitted and transmission capacity is therefore an essential part of the network. Capacity constraints result in waste of electricity because the latter is generated but cannot be readily delivered to its customers. In interconnected markets, electricity traded as a commodity must obey the same market rules as any other commodity. But electricity needs a transmission capacity to be delivered efficiently. From a technical point of view, the non-convergence in prices (impairment of the Law of one price) may be largely attributed to the presence of bottlenecks in transmission capacity. The latter gives rise to congestion which creates price differences in various locations.
Obviously, price differences may also be attributed to the strategic behavior of generators to withhold capacity. Further, generators may use their market power to make prices higher than they ought to be in certain locations or market zones. In some markets, particularly in advanced economies of Europe, electricity price volatility and price differentials among countries may be attributed to the existence of external costs such as pollution permits and the use of various government schemes to promote the use of renewable energy.
It is important to stress that this paper ignores the extra costs generated by pollution, the so-called external costs, and the costs associated with the use of renewable sources of energy. Moreover, this paper does not explicitly deal with strategic manipulation of generators’ market power simply because its objective is to show the role of market forces in the determination of prices in competitive wholesale electricity markets. The latter issues do give rise to lively discussions, particularly when the simulation is at its end and the results (equilibrium prices and quantities) are known.
To simplify the simulation and for pedagogical reasons, it is easier to start the bidding procedure by specifying the time slots for which generators have to bid to satisfy demand. Obviously, electricity demand varies drastically during the day and there is a peak and off-peak demand. Costs too vary, inter alia, according to the variations in demand. At the beginning of the simulation, I normally ask students to work on a single hour of the day and I ignore the peak and off-peak variations in demand. For instance, I ask them to submit bids to satisfy the eight O’clock morning demand. Once it is explained and students have understood how it works for this particular hour, it is straightforward to increase the number of time slots and their bids.
I normally ask them to continue the game and bid for a peak and off-peak demand (two-hour bidding). From now on, students have a pretty good idea of how wholesale electricity markets work. They are able to work on bids for the next 2 hours and eventually for the next 24 fours (day-ahead or DAM market).
As the number of bids increases, it becomes more complex for the ISO (in this case, the instructor) to classify the bids according to their prices without the help of a computer program. Classifying the 24-hour bids and determining the market clearing price manually, is a tedious procedure. If the instructor uses the 24-hour bidding process, it is highly recommended that he use a computerized procedure, either a simulation program developed in-house or at least an Excel spreadsheet. One should bear in mind that the higher the complexity of the computer program used to illustrate the determination of the market clearing price, the longer it takes for students to grasp the workings of the market. It is highly suggested therefore to use the simplest way possible for single one-hour bidding and this is easily done manually and/or the use of an Excel spreadsheet.
Hypothetical but close to reality data are used for bidding. Some instructors may use real data from local generators but this is not a requirement for the success of the simulation. It may add complexity in the calculations and divert students’ attention from the real problem of price determination. Thus, a demand schedule is established for the next 24 hours, indicating how demand varies each hour and an Excel spreadsheet is used to graph the demand (see Appendix). Students have a precise idea of the demand and its variations. Some explanations may be provided about the variation in demand but no details are needed at this point.
The data on demand is public information, so every student gets the sheet with the same demand. On the same sheet, data are provided for the cost of production of each megawatt per hour. These costs include fixed costs and variable costs.
Starting and shutting costs for each vintage of technology may be provided too but at the initial bidding process this information may increase complexity without adding further clarity to the issue of price determination. In addition, detailed information is given on the total potential and available capacity for each technology. For instance, a producer may have a potential hydro capacity of 1,000 megawatts (MW) but its available capacity for the next hour may only be 650MW (65% of its potential). The instructor makes sure that the total available capacity is as close as possible to projected demand. This facilitates the establishment of a market clearing price and follows the trend observed in real markets situations.
Students get very interested in knowing the results of their competitors and this provides an opportunity to discuss the results with them and compare their performance. It has been observed that gender plays a role in the outcome of the auction markets. Generally speaking, male-only teams are more aggressive than female-only teams in their bidding process.
This makes performance quite variable. Male-only teams may realize either large profits or large losses. Female-only teams have an average performance making, most of the time, a very small profit. Thus, female-only teams are more risk-averse and tend to bid rather lower than their male counterparts.
There are many sites offering detailed information on the bidding process in both Power pools and Power exchanges. Interested readers can consult them online. For instance, NordPool, the most successful Power Pool in Europe and one of the pioneers in its field provides a lot of information and data on spot prices (DAM market), transmission capacity, and the regulation of the Nordic power System (http://www.nordpoolspot.com/). By the same token, India’s power Exchange offers detailed information concerning the DAM market, the quarter-hour bids and their volumes (http://www.iexindia.com/Reports/AreaPrice.aspx).
Data can be obtained in html, pdf and excel format which is very convenient for teaching purposes. The newly created (January 2012) Central America Power Pool has an interesting site (http://www.enteoperador.org) with lots of information about the functioning of the market and the bidding process used to determine the wholesale electricity prices in the region.
Conclusion
Developing and emerging economies have very disparate electricity markets, in terms of size and level of institutional and regulatory sophistication. Some of them have a limited number of active participants in their wholesale electricity markets and this makes the restructured electricity sector less competitive. Nonetheless, interconnection makes markets more liquid and more competitive. For instance, there are 27 authorized market participants in the Central America interconnected market (SIEPAC). Findings in the empirical literature indicate that it takes about twelve participants to make the market competitive.
Simulations like the one presented in this paper contribute to the understanding of the real functioning of the power markets (Borenstein 1999). By using simulations, students become able to develop bidding strategies and predict market outcomes. They develop intuitive skills and become able to see new possibilities in enhancing generators’ performance, particularly under changing business conditions. They do get a better understanding of the complexities of the bidding process using auction markets. They also develop the skills that are necessary to respond optimally to the constraints imposed by competitors and the ISOs alike.
References
Apt, J. (2005). “Competition has not Lowered US Industrial Electricity Prices,” Carnegie Mellon Electricity Industry Center Working Paper CEIC -05-01 www.cmu.edu/electricity
Publisher – Google Scholar
Baldick, R. (2009). “Single Clearing Price in Electricity Markets,” University of Texas at Austin, February 18,http://www.cramton.umd.edu/papers2005-2009/baldick-single-price-auction.pdf
Publisher
Borenstein, S. (1999). “Understanding Competitive Pricing and Market Power in Wholesale Electricity Markets,”University of California Energy Institute, Berkley, PWP-067, 1-17, August. http://www.ucei.berkeley.edu/PDF/pwp067.pdf
Publisher
Du, L., Mao, J. & Shi, J. (2009). “Assessing the Impact of Regulatory Reforms on China’s Electricity Generation Industry,” Energy Policy, 37, 712-720.
Publisher – Google Scholar
Dutra, J. & Menezes, F. (2005). “Lessons from the Electricity Auctions in Brazil,” The Electricity Journal, 18, 11-21.
Publisher – Google Scholar
Frontier Economics (2011). “Competition and Entry in the GB Electricity Retail Market,” A Report Prepared for Energy UK, January, 34 pages.
Publisher
Gentzoglanis, A. (2012). “China’s Electricity Industry at the Crossroads: New Challenges for Developing the Right Model of Regulation,” Chinese Business Review, Volume 11, Issue 1, 2012.
Publisher – Google Scholar
Joskow, P. L. (2008). “Lessons Learned From Electricity Market Liberalization,” The Energy Journal, Special Issue. The Future of Electricity: Papers in Honor of David Newbery, pp. 9-34.
Publisher – Google Scholar
Kwoka, J. (2008). “Restructuring the U.S. Electric Power Sector: A Review of Recent Studies,” Review of Industrial Organization, 32, 165-196.
Publisher – Google Scholar
Nagayama, H. (2009). “Electric Power Sector Reform Liberalization Models and Electric Power Prices in Developing Countries: An Empirical Analysis Using International Panel Data,” Energy Economics, 31, 463-472.
Publisher – Google Scholar
Sioshansi, F. P. (2008). “Electricity Market Reform and ‘Reform of the Reforms’,” Int. J. Global Energy Issues, 29, 3-27.
Publisher – Google Scholar
Słupik, S. (2012). “Barriers to Developing Competition in the Polish Electricity and Gas Market,” International Business Research; Vol. 5, No. 8, 160-171.
Publisher – Google Scholar
US Energy Information Administration. (2011). “Updated Capital Cost Estimates for Electricity Generation Plants,” Washington, DC. (http://www.eia.gov/oiaf/beck_plantcosts/pdf/updatedplantcosts.pdf).
Publisher
Appendix
Data on Costs and Vintages of Technologies
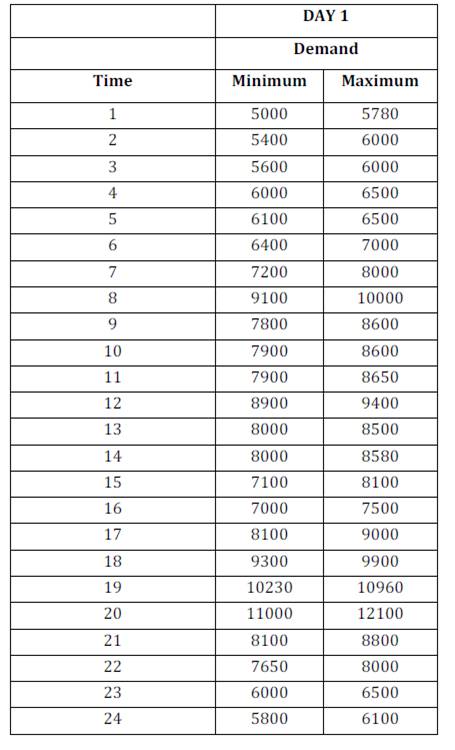
The data used in the simulation are shown in tables A1, A2 and in figure A1. Table A1 shows the variation in demand during the next 24 hours. This is ex ante, i.e., estimated demand with minimum and maximum variation. The real or actual demand will be known only ex post, i.e., in real time and the latter will determine the equilibrium price in conjunction with the supply (bids). The ISO (Independent System Operator) equates supply to real demand in order to get the equilibrium price using the bidding process described above. When supply is not adequate to satisfy demand, i.e., when there is a disequilibrium, the ISO uses the ancillary services to bring the market to equilibrium.
Table A1: Data for Total 24-hour Demand for Power
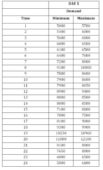
Source: Developed by the author using fictitious data and a typical daily demand for electricity
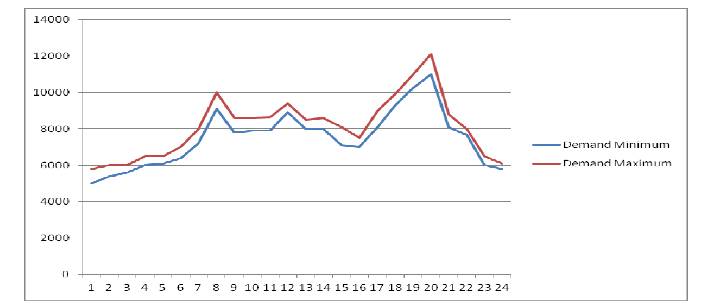
Figure A1 indicates a 24-hour demand and the absolute and relative peaks and troughs. This is a visual representation of the table A1 above. Students can get a clear snapshot of the variation of demand by using figure A1 and prepare their bids.
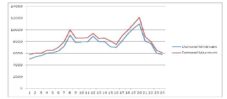
Fig A1. Total 24-hour Demand for Power
Source: From Table A1
Students, as power generators, use the cost data of table A2 in conjunction with the data of Figure A1 to prepare their bids. The technologies and capacities they possess are also indicated in table A2. It is important to note that the total installed capacity for each vintage of technology is not readily available for power generation.
Power availability and total and variable costs depend on the type of power plant. Although the table accounts for almost all the technologies commercially available, some countries, particularly the developing and emerging ones, may possess and/or master fewer technologies. For instance, nuclear, geothermal and PV grid-connected technologies may not be used by some emerging or developing countries. The high costs and their technological sophistication make them less suitable for them. The instructor may decide to exclude these technologies from the simulation. Starting costs are also included because they may play an important role in the bidding decision process.
Table A2: Costs according to the Vintage of Technology
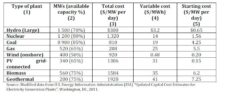
Source: Modified data from U.S. Energy Information Administration (EIA) “Updated Capital Cost Estimates for Electricity Generation Plants”, Washington, DC, 2011.
The average daily fixed cost is calculated by dividing the total daily fixed cost by installed capacity. The total daily fixed costs (TDFC) include the fixed operating and maintenance (O&M) costs and the annual financial costs of invested capital divided by 365 days (TDFC = Fixed O&M + Annual financial cost)/MW/365 days). The average variable cost (AVC) is the total variable cost divided by MWh (AVC = (Total Variable cost/MWh)).
The data in table A2 are fictitious but very close to real-world. Interested readers may use actual data by either visiting the web sites of ISOs cited above or by consulting the US Energy Information Administration for an annual update of the capital cost of electricity generation plants (http://www.eia.gov/oiaf/beck_plantcosts/pdf/updatedplantcosts.pdf). A complete list of factors that determine the cost of capital of electricity generation plants has been addressed by the California Energy Commission and interested readers may consult it at the following site: http://www.energy.ca.gov/2009publications/CEC-200-2009-017/CEC-200-2009-017-SD.PDF.
In the current context of competitive electricity markets, it is very important to get accurate estimates for the cost of capital. Electricity generators would exit the market should the market returns are lower than their real cost of capital. Risk factors are also important for projects in both developed and developing and emerging economies. Estimation of risks premiums and their returns must be done using state of the art financial models. These estimations are beyond the scope of this paper.