Introduction
The existence of rising health care costs in the United States is well-documented in the literature and has generated much debate regarding the source of this trend. To put these costs in perspective, expenditures in the United States on health care were approximately $2.7 trillion or 17.2 percent of Gross National Product (GNP) in 2012, almost four times the $696 billion spent in 1990, and eleven times the $246 billion spent in 1980. In addition, health expenditures are expected to reach nearly 20 percent of GNP by 2020 and more than 40 percent of GNP by 2050.
Given the above cost trends and their impacts on a variety of market participants, the extent of the problem has led to many explanations for why health care costs continue to rise uncontrollably. For example, some of the most common reasons given for the rising health care costs in the United States include: the aging of the population, high-cost technological advancements, prescription drugs, defensive medicine, and the intensity of services. All of these reasons seem plausible, but many researchers are unconvinced by these arguments alone, leading to a diverse amount of studies searching for other potential explanations for rising costs.
One such source, and the topic of this paper, involves systematic inefficiencies in the provision of health care, a characteristic that may vary across ownership types. Public choice theory suggests that public provision may be more inefficient than private provision due to the lack of incentives for efficiency. If such inefficiencies do exist across ownership types, then the notion set forth calling for a publicly provided health insurance program may be a poor solution to the rising costs of health care. However, in an attempt to address the inherent inefficiencies contained within the U.S. health care system, President Obama signed the Affordable Care Act on March 23, 2010 placing the government at the forefront of current and future healthcare reforms.
The law was meant to enact a set of comprehensive health insurance reforms that would gradually take effect over a four year period. For example, in 2010 a Patient’s Bill of Rights went into effect which included many cost-free preventive services for adults and children. Some examples for the adult population include various screenings for blood pressure and cholesterol issues, aspirin use for men and women, tobacco and alcohol misuse, as well as immunizations and diet counseling. Some specific examples for the female population (including pregnant women) are anemia, breast cancer and cervical cancer screenings, as well as contraceptive methods and counseling.
A few examples of preventive services for children include alcohol and drug assessments, autism and other developmental screenings such as hearing and vision, as well as immunizations. In 2011, the major focus was placed on providing Medicare patients with free preventive care services and beginning to offer discounts on covered name-brand drugs. These discounts are set to continue and provide seniors with additional savings over a 10 year period.
In 2012, the emphasis was placed on a new hospital Value-Based Purchasing program (VBP) in Traditional Medicare. This program offers financial incentives to hospitals to improve the quality of care beginning with measures relating to heart attacks, heart failure, pneumonia, surgical care, health-care associated infections and patients’ perception of care.
Additionally in 2012, incentives were put into place encouraging physicians to join together to form Accountable Care Organizations (ACOs). It was believed that doctors who joined these organizations would be in a better position to coordinate patient care, improve the quality, and to help prevent disease and illness while reducing unnecessary hospital admissions. The number of ACOs has been growing steadily since 32 Medicare ACOs were pioneered in 2011. As of 2013, an estimated 428 ACOs were found to be operating in 49 states.
In 2013, open enrollment in a competitive insurance marketplace began with the intent of allowing individuals and small businesses to buy affordable and qualified health benefit plans. This newly formed “Health Insurance Marketplace” was designed to make health coverage more affordable and as of January 2014, over 2 million people had selected a health plan through this option.
In addition to buying health insurance from the marketplace, low-income and middle class Americans also became eligible for tax credits intended to defray some of the costs of coverage in 2012. In addition, the number of people eligible for Medicaid was expanded. Finally, in 2015, new provisions will be put into place to reward doctors for the quality of care they provide as opposed to the pure volume of patients they see.
Although the implementation of the Affordable Care Act seems to imply the need for a larger government role in the provision of healthcare, many still debate whether the government should be involved at all when it comes to providing accessible health care. Like education, health care is usually thought of (correctly or not) as a fundamental right.
When some individuals are precluded from the medical care needed for their survival, a morality issue ensues. Like many other goods and services of this nature, many feel that such morality issues necessitate government involvement. However, if the government does claim responsibility for this problem, it very quickly becomes an extraordinary expense for the public. The purpose of this paper, however, is not to argue over the normative choice of who provides access to medical care from a morality standpoint; rather we address the issue of who is more efficient in the provision of the service.
Although we are certainly not the first to attempt to measure these inefficiencies, we do develop an empirical model that employs a different set of outputs than are most commonly found in the literature.
For instance, we consider outputs that are correlated more with the initial treatment of patients and preventative medicine rather than using “after the fact” measures such as mortality rates or patient days. We feel that these measures are perhaps even more important relative to the other types of outputs commonly found in the literature for two interrelated reasons: (1) lower costs, and (2) higher quality of care. Lowering health care costs has become a major goal for policymakers, but critiques claim that the existing proposals that aim to lower costs may also result in lower quality of care. Providing the appropriate initial treatment has the capability of achieving lower costs while at the same time achieving the goal of high quality medical care.
That is, it intuitively prevents people from having more serious (and expensive) medical conditions in the future. Thus, by using initial care measures of output (including some measures of preventative care) as we do here, we address a different attribute of hospital care relative to previous studies of this nature.
The remainder of the paper proceeds as follows. The second section provides a brief literature review. The third section describes the theoretical model. The data and empirical results are described in the fourth section, and the fifth section offers concluding remarks.
Literature Review
A common theme in the health care literature relates to the efficiency of the health care market. In particular, economists have developed a variety of frontier methods to measure the possible inefficiencies within the health care industry. The two most commonly used methods are known as data envelopment analysis (DEA) and stochastic frontier analysis (SFA), both of which have their advantages and drawbacks.
Farrell (1957) was the first to use DEA which uses linear programming to locate the best practice production frontier. Since the first health care applications of DEA were published in the mid 1980’s, numerous studies have since been published and accepted as an appropriate estimate of the efficiency of the decision making unit (DMU).
Econometricians have often criticized the use of DEA because it assumes that some observed production process is efficient and ignores the potentially important fact that observations in any data set may be subject to random fluctuations. (Hofler and Folland, 1991)
Aigner et al. (1977) and Meeusen and van den Broeck (1977) independently developed SFA, which avoids the potential problems associated with DEA. SFA estimates a deterministic frontier and assumes that departures from the best practice frontier may be stochastic (i.e. random shocks) or deterministic (i.e. inefficiency). (Rosko, 2001) Wagstaff (1989) and Zuckerman et al. (1994) were the first to publish studies using SFA with cross-sectional data while Wagstaff and Lopez (1996), Linna (1998), and Chirikos (1998) have employed SFA using panel data.
Most of the above-mentioned empirical studies have used SFA to estimate translog cost functions which is one of the most common methods employed to study health care organizations. However, our analysis more closely resembles the methods used by Gaynor and Pauly (1990), Defelice and Bradford (1997), and Brown (2003), who use models of technical efficiency for estimating a best practice production function using output measures such as number of office visits for primary care physicians or number of patients as a function of various inputs.
As mentioned previously, one hospital characteristic of particular interest to us is that of hospital ownership. Hospitals are categorized as either for-profit, not-for-profit, or public (government owned). As noted by Kessler and McClellan (2002) theory predicts that the for-profit organization form is efficient due to the “incentives that arise from the presence of a well-defined residual claimant with legally enforceable property rights.” When it comes to nonprofit organizations, Arrow (1963) showed that this type of legal entity for incomplete markets may be socially optimal.
However, later works by Newhouse (1970), Feldstein (1971), and Pauly and Redisch (1973) have shown that the nonprofit organization may be socially inferior or equivalent to the for-profit form even if markets are incomplete. Finally, bureaucracy theory predicts that public (or government ownership) will be inefficient due to the lack of incentives created by this organizational form and an objective function whose purpose is to maximize the budget rather than minimize costs.
With regards to the impacts of hospital ownership on medical productivity, researchers have reported a variety of results using a wide range of empirical techniques. Some studies, such as those by Zuckerman (1994) and Rosko (1995), have found for-profit ownership to be associated with higher costs, however, there are also studies such as Burgess and Wilson (1998) and Cowing and Holtman (1983) which have found for-profit hospitals to increase efficiency or reduce costs.
When measuring quality in terms of the survival rates of patients, Sloan et al. (2001) has found no differences in outcomes with regards to hospital ownership. With no definite consensus on how hospital ownership affects efficiency, it is important for researchers to continue to develop methods for measuring this aspect of the health care industry. Forbes et al. (2010) found that in terms of their potential to increase output for a given set of inputs, for-profit and public contract hospitals were more efficient than public and not-for-profit private hospitals.
Theoretical Model
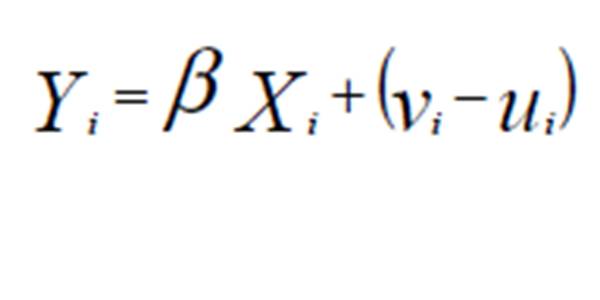
The model that is estimated loosely follows that of Battese and Coelli (1995) in which the inefficiency effects are expressed as a function of firm-specific characteristics and a random error. Our functional form chosen–linear–differs from that of Battese and Coelli (1995)–semi-log–largely as a result of differences in the dependent variables. Battese and Coelli (1995) construct a model of total output whereas we measure the percent of patients who received treatment (as opposed to total patients receiving treatment). Specifically, Output = f (labor, capital and other inputs) + Technical Efficiency (TE), and the model specification is as follows:
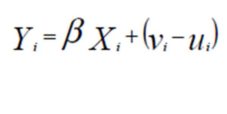
Where Yi are the outputs for hospital, i; Xi is a vector of hospital inputs for hospital i, and β are parameters corresponding
to our selected inputs. The error term is composed of
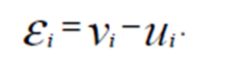
It is assumed that  is independent and identically distributed (i.i.d.), that
 and that and
  are independent of one another. Furthermore, is the non-negative random variable accounting for technical inefficiency. That is, we assume
  where
where  is a set of hospital-specific characteristics influencing hospital efficiency,
  is a vector of parameters and
  is an i.i.d. random error.
Data and Empirical Analysis
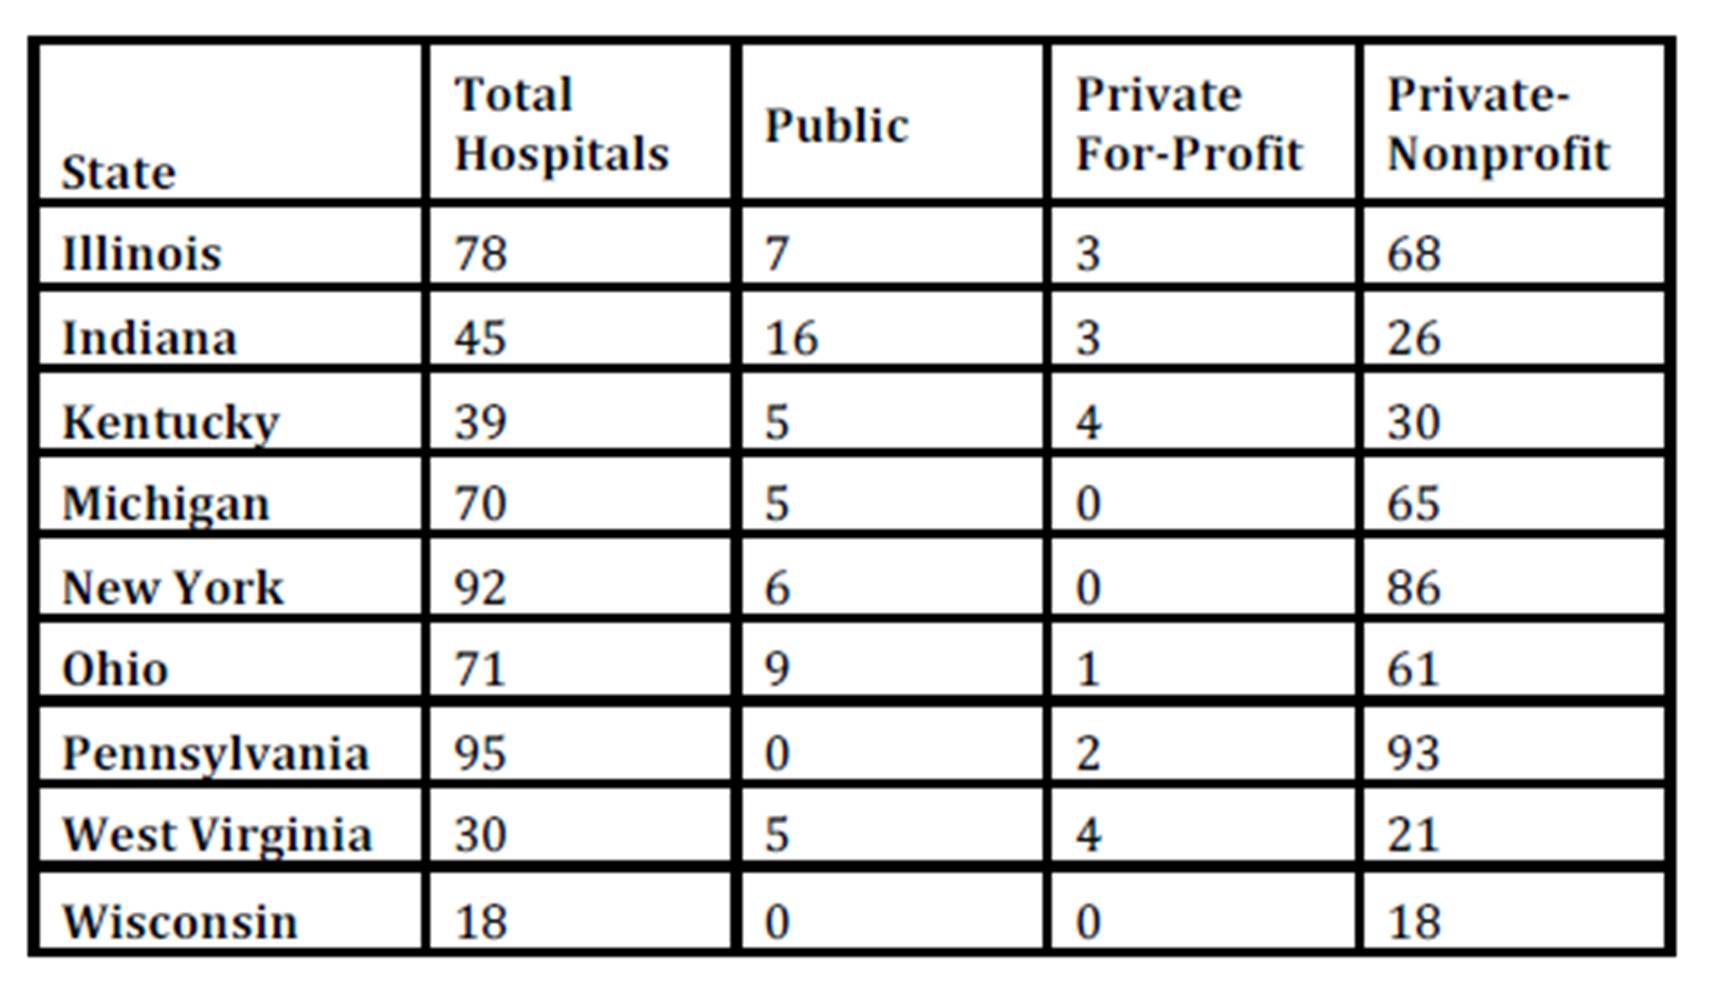
For fiscal year 2005, we obtained hospital level data for the hospital quality of care variables from the U.S. Department of Health and Human Services (HHS) and hospital input data from the American Hospital Association (AHA) for the following 9 states: Illinois, Indiana, Kentucky, Michigan, New York, Ohio, Pennsylvania, West Virginia, Wisconsin. County-level demographic variables were collected from the U.S. Census Bureau, the Bureau of Economic Analysis, and the Bureau of Labor Statistics. Table 1 displays the total hospitals by profit status and state in our sample.
Table 1:Hospital Count by State and Hospital Type
*Counts reflect using the Heart Failure and Pneumonia sample. There are two fewer private-nonprofit hospitals in the Heart Attack sample based on data availability.
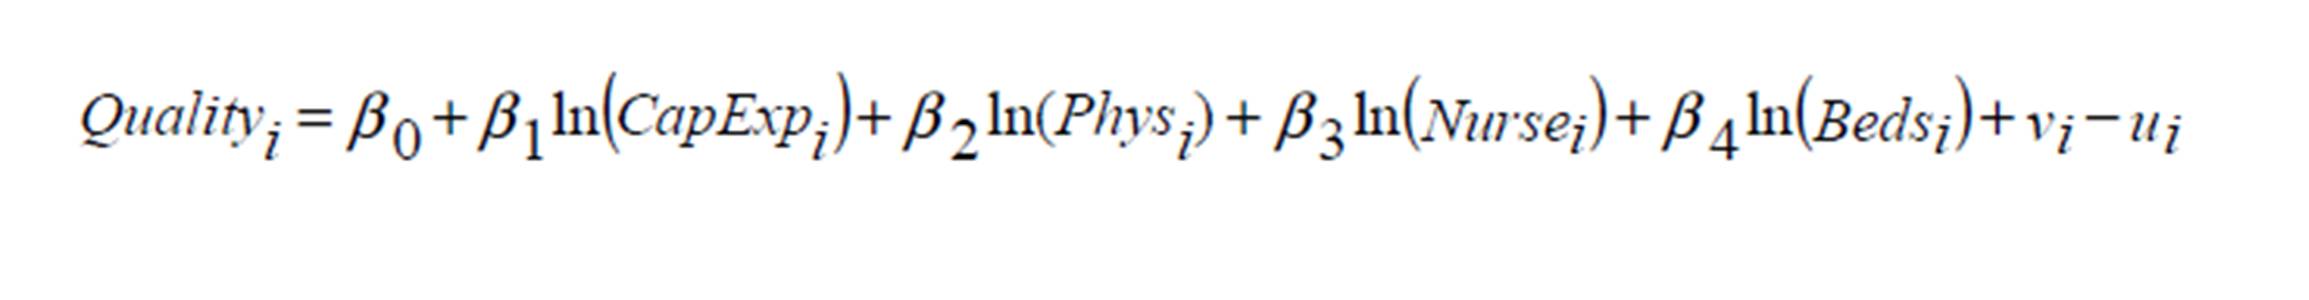
Relying heavily on previous studies of this nature, with particular emphasis on Brown (2003), we specify the following empirical model to test our hypothesis regarding the impact of hospital ownership and level of competition on the efficiency of hospitals:

Where

with the assumption that and 
The empirical specification of the frontier equation is similar to that of Brown (2003), although we include separate variables for physician and nurse employment rather than including a single full time equivalent employment variable. Also like Brown (2003), we include measures for profit status and a competitive index in the inefficiency equation. Our specification of the model differs from Brown (2003), among other reasons, in that he directly includes measures of managed care (HMO and PPO) whereas we attempt to capture the propensity of Medicaid and Medicare through the inclusion of demographic variables. We estimate all parameters in the production frontier simultaneously via maximum likelihood estimation using the Frontier 4.1 program.
Researchers of technical efficiency notoriously face the trade-off between potential misspecification bias by employing Stochastic Frontier Analysis (SFA) and potential measurement error by choosing Data Envelopment Analysis (DEA) (Erkoc 2012). In our case, we, like Battese and Coelli (1995) and Brown (2003), among others, opt to employ SFA for its advantages in treating “deviations from best-practice as comprising both random error (white “noise”) and inefficiency. … An advantage of the econometric approach is that it allows for formal statistical testing of hypotheses” (Theodoridis and Psychoudakis 2008). While beyond the scope of this paper, it may be beneficial to compare the outcomes of the two approaches using a common data set, particularly as new computational techniques are developed.
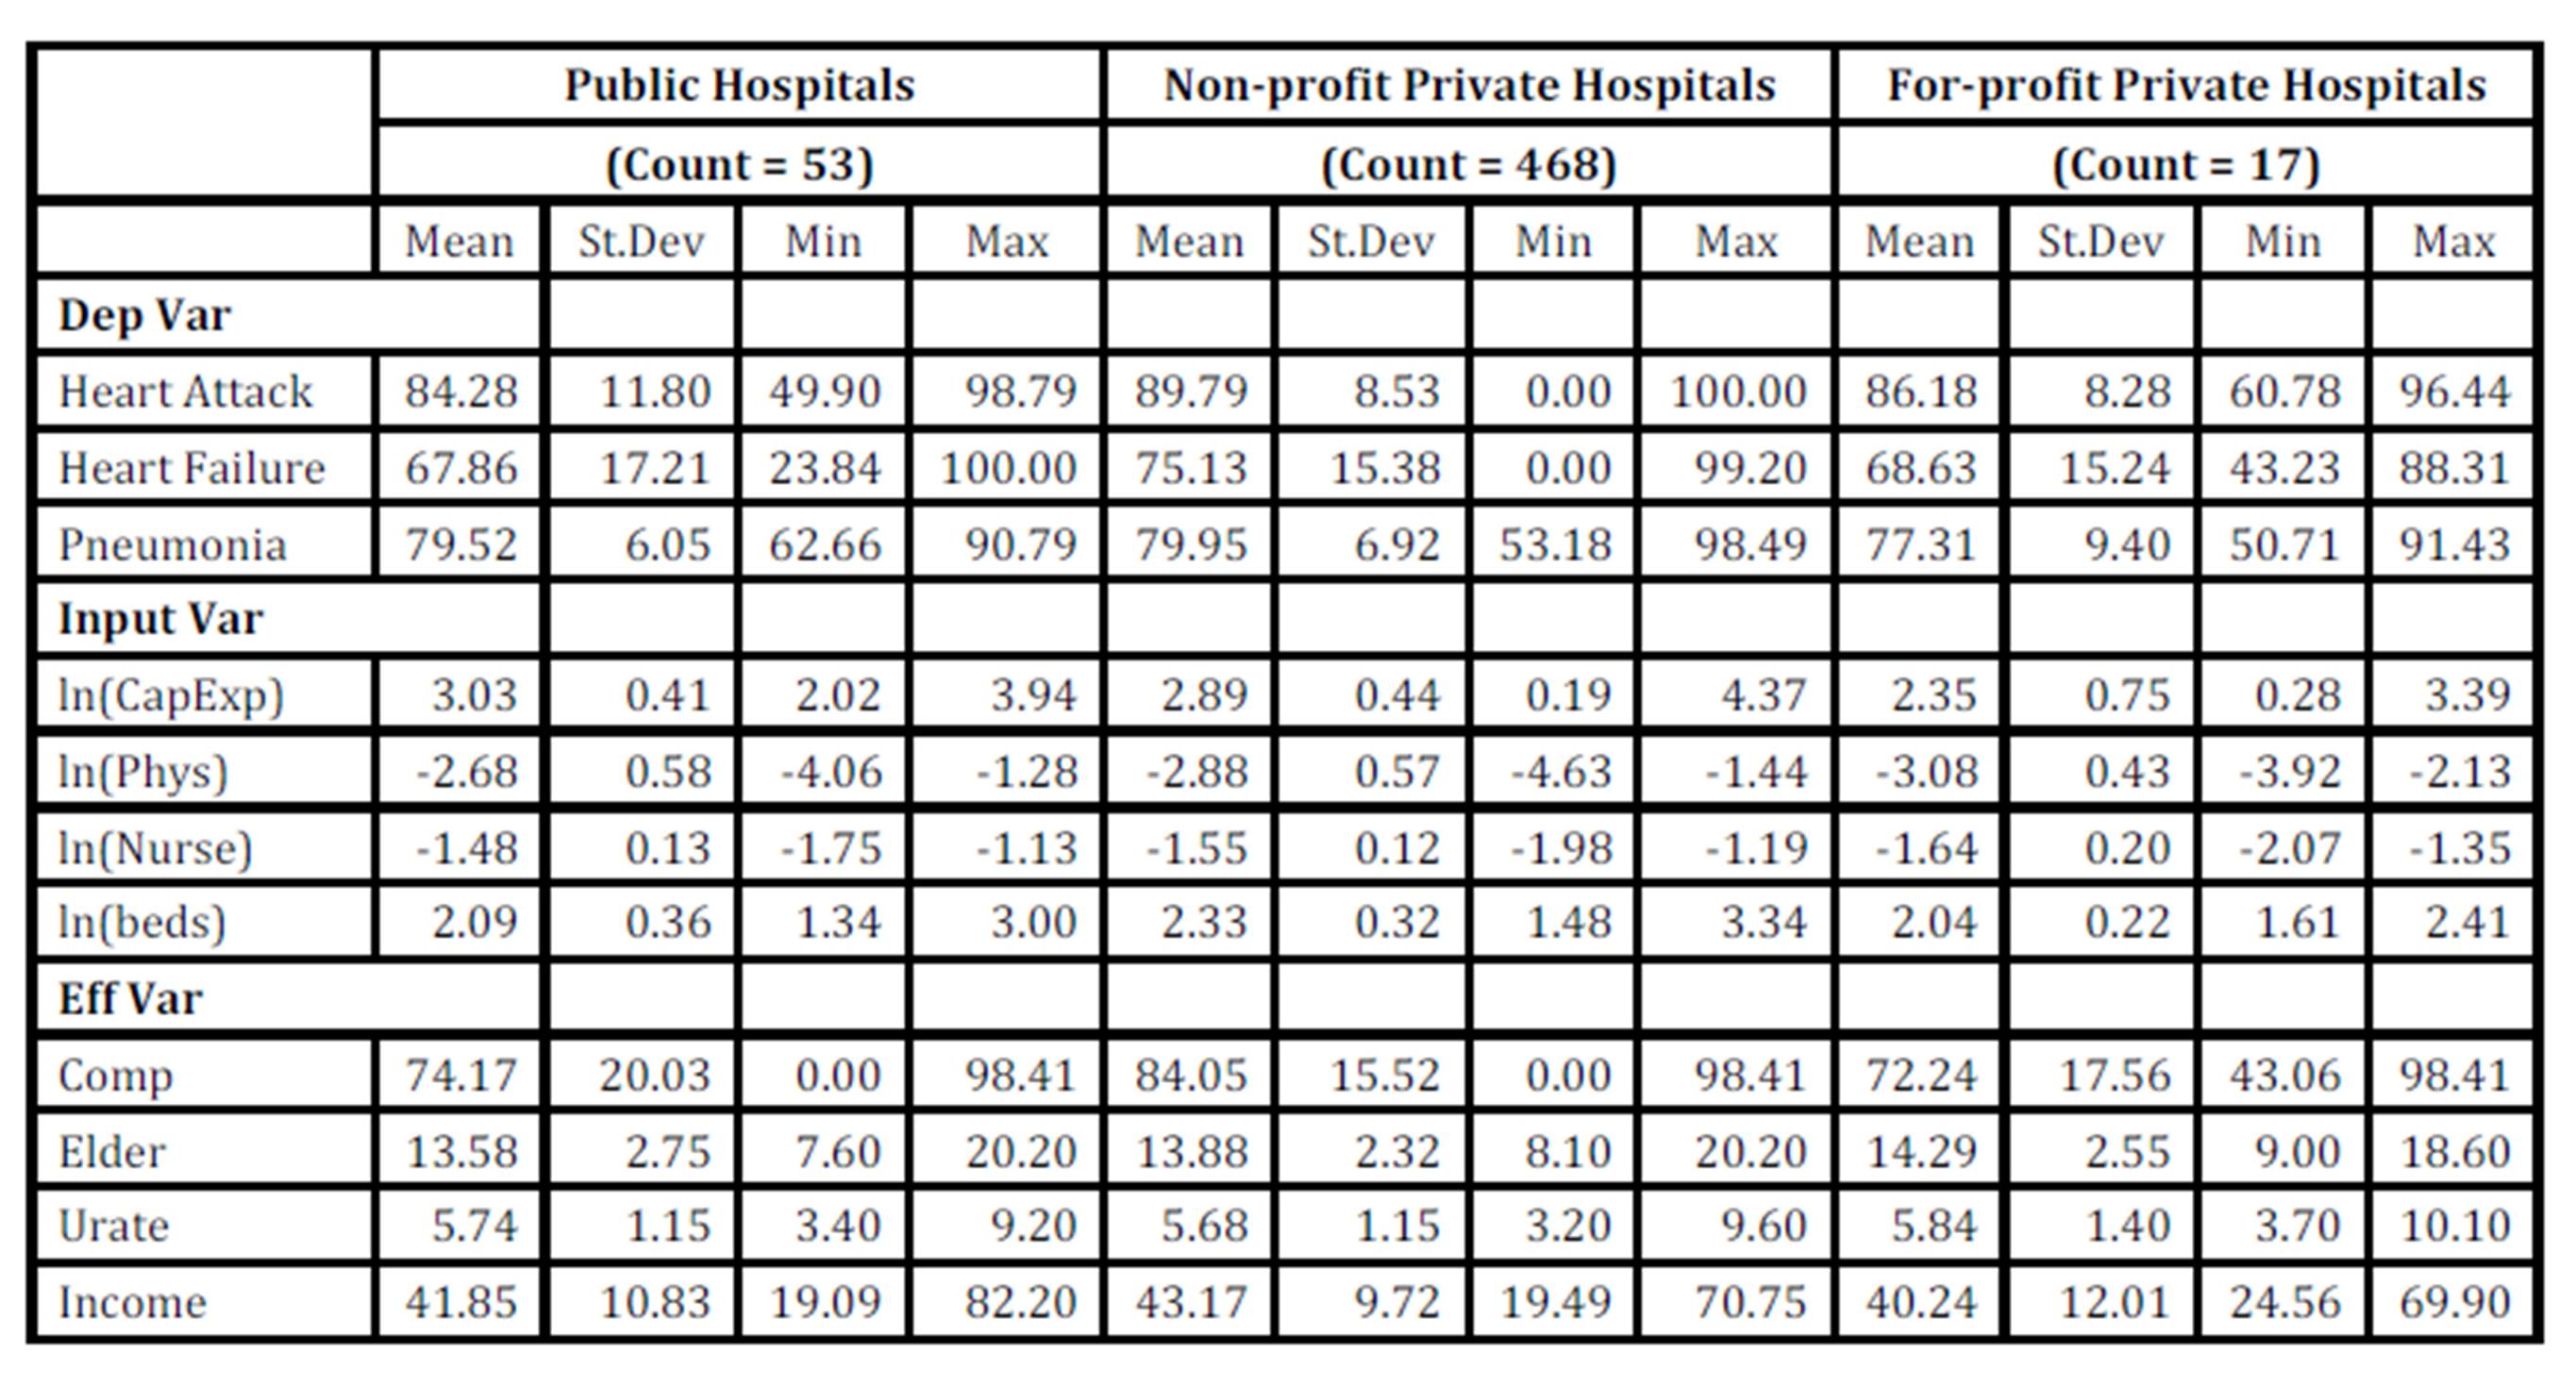
The dependent variable (Quality) represents a measure of hospital output with regards to three of the most prevalent conditions treated in acute care hospitals: heart attack, heart failure, and pneumonia. For each of these conditions, HHS reports the generally accepted initial treatments for the condition, the number of patients for whom each treatment was applicable, and the number of patients who actually received such treatment. For example, the following eight treatments are listed for a heart attack: aspirin upon arrival, aspirin upon discharge, ACE inhibitor or ARB for left ventricular systolic dysfunction (LVSD), beta blocker at arrival, beta blocker at discharge, PCI within 120 minutes of arrival, thrombolytic medication within 30 minutes of arrival, and smoking cessation advice/counseling. Using the specified treatments for each of the three medical conditions, we calculate a weighted average of the percent of patients who received the appropriate medical treatments. For this calculation, we weight each of the various treatments by the number of patients for whom the treatment was applicable. Thus, our three dependent variables should be interpreted as a measure of the percent of patients who received the generally recognized initial treatment (provided the treatment is applicable for the patient’s specific case) for their condition. The descriptive statistics for the dependent variables and all included explanatory variables can be found in Table 2.
The use of the above described quality of care variables offers a deviation from the literature, which has generally attempted to analyze long-term quality of care through the use of mortality rates and patient days. Our approach here is to examine the patient-interpreted quality of care provided in the initial visit based on observed treatment. While long-term quality of care is important, patients cannot immediately observe these outcomes and therefore cannot use this information to help them choose between hospitals for future care. However, patients and their families can observe what initial treatments were provided. Thus, the current study is useful both in determining which ownership type is most efficient in the provision of initial treatment and in providing some insight on how hospital quality is measured by patients.
We now turn to the consideration of hospital inputs used to construct the best practice frontier. As described in the theoretical section above, the production of quality of care is a function of two main inputs: labor and capital. We include two variables to account for labor: the number of full-time equivalent (FTE) physicians per patient and FTE nurses per patient (Phys and Nurse, respectively). We also include two variables to proxy for capital: the number of staffed beds (Beds) and hospital reported capital expenditures per patient (CapExp). We take the natural log of each hospital input variable.
Continuing on to the determinants of technical inefficiency, we include variables describing ownership, market competition, and three demographic variables to account for case mix and health insurance status. While the literature has yet to reach a consensus concerning the influence of hospital ownership, bureaucracy theory suggests that both for-profit (Prof) and non-profit (NonProf) ownership types should be more efficient than government owned hospitals. Thus, the coefficients on the Prof and NonProf variables are expected to be negative. Likewise, the coefficient of the”ƒcompetition variable (Comp) should be negative because economic theory suggests that higher levels of competition foster efficiency. The competition variable is calculated by first determining the Herfindahl index for each county allowing for the local market to encompass the home county and all contiguous counties. We then subtracted the Herfindahl index from one, bounding the competition variable between zero and one, in which values closer to unity signify higher degrees of competition.
The three county-level demographic variables included in the model are percent of the population over 65 (Elder), median household income for year 2004 (Income), and the unemployment rate (Urate). Percent elderly is a proxy for Medicare usage. The unemployment rate is also used as a proxy for Medicaid usage; however, this variable may also capture the influence of no insurance. The use of median income is intended to proxy for the presence and level of insurance coverage; more complete insurance coverage generally coincides with higher salaries. In addition, higher median incomes should also be accompanied by greater overall health (due to a more nutritious diet and possibly to more frequent health check-ups).
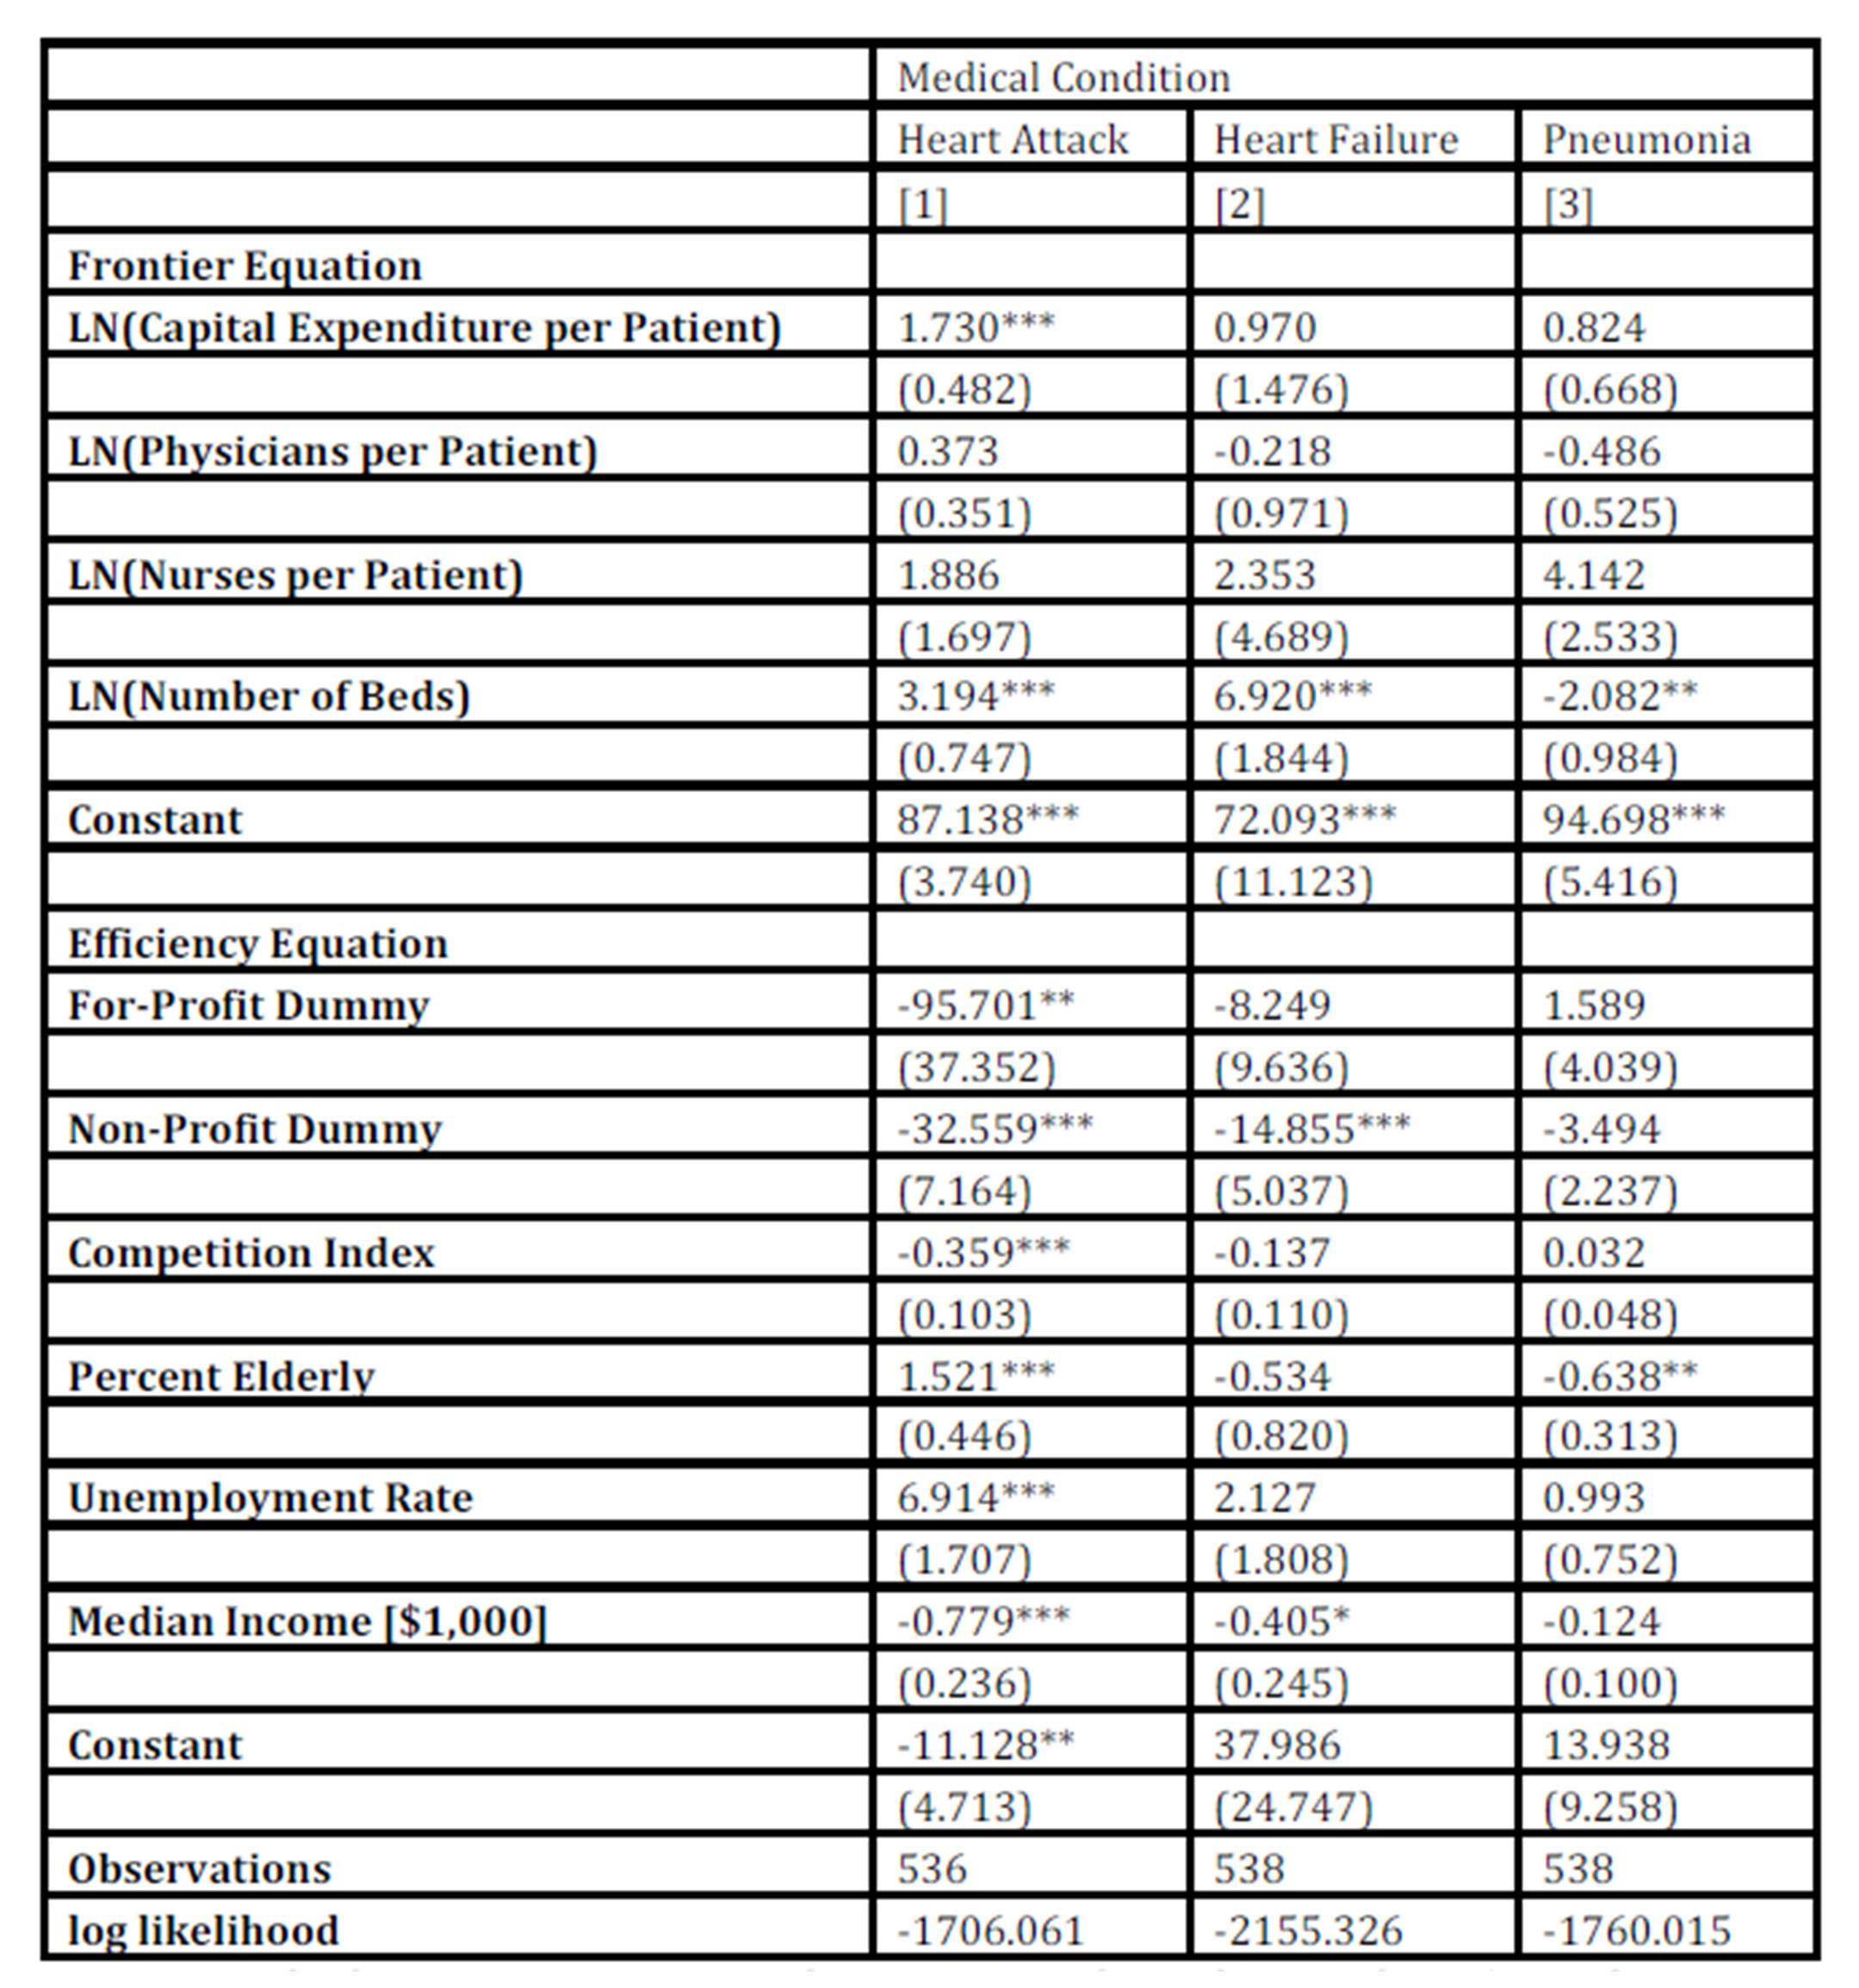
Table 3 presents the results from our empirical estimation of the efficient frontier model for each of the three medical conditions analyzed. After deleting missing observations and observations in which the natural log is not defined, we were left with 536 hospitals for the heart attack analysis and 538 hospitals for the heart failure and pneumonia regressions of the 975 hospitals initially included in the data set. The results for patients seeking treatment for a heart attack, presented in column 1 of the table, suggest that the efficient frontier for quality of care increases with capital while it is statistically independent of labor. In particular, a one percent increase in capital expenditures per patient leads to a 1.73 percentage point increase in the percent of patients who received the appropriate treatment for a heart attack. Similarly, a one percent increase in the number of staffed beds, a proxy for capital stock, is associated with a 3.19 percentage point increase in the efficient frontier, holding constant all other included variables.
All variables included in the inefficiency equation for heart attack are statistically significant and of the expected sign. A hospital located in a county with a greater share of elderly or a greater unemployment rate is shown to be more inefficient. This suggests that Medicare and Medicaid provide less incentive for hospital efficiency than if all patients paid for medical treatment privately. The results also indicate that hospitals are more efficient in areas with higher median incomes. Since health insurance coverage generally improves with income, this result may be interpreted that hospital efficiency improves with insurance coverage. Greater geographic competition between hospitals is shown to lead to greater efficiency, implying that hospitals located in rural areas with little to no competition behave as uncontested local monopolies and experience less incentive to improve efficiency. Finally, private hospitals (both for-profit and non-profit) are shown to be more efficient than government owned hospitals. Thus, the results for quality of care of heart attack patients offer some evidence in favor of bureaucracy theory–private hospitals are more efficient than public hospitals.
Turning to the estimation of the efficient frontiers for the treatment of heart failure and pneumonia (columns 2 and 3, respectively), only the number of staffed beds is statistically significant in the frontier equation. For heart failure, a one percent rise in the number of staffed beds increases the quality of care frontier by 6.92 percentage points. Surprisingly, an increase in the number of staffed beds is estimated to reduce the quality of care for pneumonia patients. This may indicate that as hospitals grow, they tend to exert more effort on the treatment of more complicated conditions which often require surgery and the use of newer technologies. Thus, the treatment of pneumonia and other similarly cured conditions tend to receive less emphasis, causing hospital performance in these areas to suffer.
Table 2: Descriptive Statistics
Table 3:Maximum Likelihood Estimates of Quality of Care Index
Notes: Standard errors appear in parenthesis. Statistical significance of 1%, 5%, and 10% represented by ***, **, and * respectively. Regressions also include state dummy variables in the frontier equation.
In the estimation of technical efficiency in regards to the treatment of heart failure, only the non-profit binary variable and median income are statistically significant, both of which are positively related to efficiency. Turning to technical efficiency in the treatment of pneumonia, only the percent of the population who are elderly is estimated to be statistically significant. A one percentage point increase in the elderly variable increases efficiency in the treatment of pneumonia by 0.64 percentage points. Hospitals located in areas with a high concentration of elderly will tend to specialize in the treatment of the elderly. And, given the increased susceptibility of the elderly to pneumonia, the positive relationship between the percent elderly and efficiency of pneumonia treatment should be expected.
Contrary to our initial hypothesis, the for-profit dummy variable is not statistically different from zero in the heart failure and the pneumonia regressions. Thus, for-profit private hospitals are shown to perform equally with public hospitals in the treatment of heart failure and pneumonia. The efficiency of pneumonia treatment in non-profit hospitals is also estimated to be of an equal level, statistically speaking, with public hospitals. Furthermore, competition does not appear to play a role in encouraging the efficient treatment of these two conditions.
Conclusion
Previous studies regarding the technical efficiency of hospitals have focused primarily on long-term health care outputs. In this study we approach the issue of hospital efficiency differently by estimating the best practice frontier for the initial treatment of patients admitted for one of the following conditions: heart attack, heart failure, or pneumonia. The importance of using the initial treatment of patients as a proxy for hospital output is twofold.
First, the correct treatment of patients in the initial stages of a medical condition is likely to lower the probability that a more serious condition will result and perhaps even prevent the condition from reoccurring, reflecting a high quality of care. Second, by providing the patient with the highest quality of care possible in the beginning stages of a medical condition, this is likely to prevent more expensive treatments in the future, lowering health care costs in the long run. Given the extraordinary increases in health care costs over the past several decades, it seems reasonable to focus both on preventative medicine and the initial treatment of patients as possible solutions to this problem.
After establishing the importance of using the initial treatment of patients as our hospital output variable, we turn to the inputs used to construct the best practice frontier. The number of full-time equivalent physicians and nurses per admission are used as a proxy for labor inputs and capital expenditures per admission and the number of staffed beds are used as proxies for capital inputs. The next and final step in our analysis is to consider possible determinants of technical inefficiency. Here we account for possible case-mix differences by including three demographic variables: percent elderly, median income, and the unemployment rate. In addition, we include a variable to account for the various degrees of competition that exist among hospitals, calculated by subtracting the Herfindahl index from one.
Finally, the topic of interest to our study is addressed by including dummy variables to account for ownership type. More specifically, we include for-profit and non-profit dummy variables which allows for a comparison of private and public hospitals.
We hypothesized that for-profit and non-profit hospitals would exhibit greater efficiency relative to public hospitals due to the different incentives created within these types of organizations. Our results did find some evidence in favor of this hypothesis. For instance, when considering the initial treatment of heart attack patients, both the for-profit and non-profit hospitals outperformed the government owned hospitals.
On the other hand, the same analysis using heart failure patients found that only non-profit hospitals are more efficient, while the treatment of pneumonia patients did not exhibit any statistically significant differences among ownership type.
The results of this study may offer potential explanations for why the rise in health care costs continues to outpace the costs of other consumer goods and services. We suggest that rising costs may in part be due to inefficiencies in hospitals that are a result of ownership type. By using a set of hospital outputs that to our knowledge have not been used in the same fashion, we feel that our findings offer an important contribution to the current literature. Future studies involving the initial treatment of patients and their impacts on health care costs could play an important role for policymakers in future health care debates.
References
1. Aigner D, Lovell C, Knox A, Schmidt P. (1977), “Formulation and estimation of stochastic frontier production function models.” Journal of Econometrics, 6(1), 21-37.
Publisher – Google Scholar
2. Arrow KJ. (1963), “Uncertainty and the welfare economics of medical care.” American Economic Review, 53 (5), 941-973.
Google Scholar
3. Battese GE, Coelli TJ. (1995), “A model for technical inefficiency effects in a stochastic frontier production function for panel data. Empirical Economics, 20, 325-332.
Publisher – Google Scholar
4. Brown SH, III. (2003), “Managed care and technical efficiency.” Health Economics, 12 (2), 149-158.
Publisher – Google Scholar
5. Burgess J, Wilson P. (1998), “Variations in inefficiency among US hospitals.” Canadian Journal of Operational Research and Information Processing, 36 (3), 84-102.
6. Centers for Medicare and Medicaid Services, Office of the Actuary, National Health Statistics Group, 2003 National Health Care Expenditures Data.
7. Chirikos T. (1998), “Further evidence that hospital production is inefficient.” Inquiry, 35 (winter), 408—416.
Google Scholar
8. Coelli TJ. (1996), “A guide to FRONTIER Version 4.1: a computer program for stochastic frontier production and cost function estimation.” CEPA Working Papers.
Google Scholar
9. Cowing T, Holtman A, Powers S. (1983), “Hospital cost analysis: A survey and evaluation of recent studies.” Advances in Health Economics and Health Services Research, 4, 257-303.
Google Scholar
10. Defelice LC, Bradford WD. (1997), “Relative inefficiencies in production between solo and group practice physicians.” Health Economics, 6 (5), 455—465.
Publisher – Google Scholar
11. Erkoc, T.E. 2012 “Estimation Methodology of Economic Efficiency: Stochastic Frontier Analysis vs Data Envelopment Analysis.” International Journal of Academic Research in Economics and Management Sciences, 1 (1).
Google Scholar
12. Farrell M. (1957), “The measurement of productive efficiency.” J Roy Stat Society Series A General, 120 (3), 253—281.
Publisher – Google Scholar
13. Feldstein M.S. (1971), “Hospital cost inflation: A study of nonprofit price dynamics.” American Economic Review, 61 (5), 853-872.
Google Scholar
14. Forbes, M, Harslett, P, Mastoris, I. and Risse, L. (2010), “Measuring the technical efficiency of public and private hospitals in Australia.” Supplement to Research Report, Canberra.
Google Scholar
15. Gaynor M, Pauly MV. (1990), “Compensation and productive efficiency in partnerships: evidence from medical group practice.” Journal of Political Economy, 98 (33), 544-573.
Google Scholar
16. Newhouse J. (1970), “Toward a theory of nonprofit institutions.” American Economic Review, 60 (1), 64-74.
17. Health Affairs. Continued Growth Of Public And Private Accountable Care Organizations. Accessed 28 February 2014: http://www.healthaffairs.org/.
18. Henry J. Kaiser Family Foundation, The. Employee Health Benefits: 2006 Annual Survey 2006. Accessed 16 June 2011: http://www.kff.org/insurance/7527/index.cfm.
19. Hofler RA, Folland ST. (1991), “Technical and allocative inefficiencies of United States hospitals under a stochastic frontier approach,” for presentation at the Midwest Economics Association Fifty-fifth Annual Meeting (St. Louis, MO).
20. Kessler DP, McClellan, MB. (2002), “The effects of hospital ownership on medical productivity.” RAND Journal of Economics, 33 (3), 488-506.
21. Linna M. (1998), “Measuring hospital cost efficiency with panel data models.” Health Economics, 7 (5), 415—427.
Publisher – Google Scholar
22. Meeusen W, van den Broeck J. (1997), “Efficiency estimation from Cobb-Douglas production functions with composed error.” International Economic Review, 18, 435—444.
23. National Coalition on Health Care. Health Insurance Cost. Accessed 1 August 2013:
24. http://www.nchc.org/nchc-policy-briefs-2/#sthash.fXrG70yQ.dpuf.
25. Newhouse J. (1970), “Toward a theory of nonprofit institutions.” American Economic Review, 60 (1), 64-74.
26. Niskanen WA, Jr. (1970), Bureaucracy and Representative Government. Aldine-Atherton, Inc.: Chicago & New York.
27. Pauly V, Redisch M. (1973), “The not-for-profit hospital as a physicians’ cooperative. American Economic Review, 63 (1), 87-99.
Google Scholar
28. Rosko MD., Chilingerian JA., Zinn JS., Aaronson, WE. (1995), “The effects of ownership operating environment, and strategic choices on nursing home efficiency. Medical Care, 33 (10), 1001—1021.
Publisher – Google Scholar
29. Rosko M. (2001), “Cost efficiency of U.S. hospitals: A stochastic frontier approach.” Health Economics, 10 (6), 539—551.
Publisher – Google Scholar
30. Sloan, FA, Picone GA, Taylor DH, Chou S.Y. (2001), “Hospital ownership and cost and quality of care: Is there a dime’s worth of difference?” Journal of Health Economics, 20 (1), 1-21.
Publisher – Google Scholar
31. Theodoridis, A.M. and Psychoudakis, A. (2008), “Efficiency Measurement in Greek Dairy Farms: Stochastic Frontier vs. Data Envelopment Analysis” International Journal of Economic Sciences and Applied Research, 1 (2), 53-67.
Google Scholar
32. U.S. Department of Health and Human Services. About the Law. Accessed 28 February 2014: http://www.hhs.gov/healthcare/rights/index.html.
33. Wagstaff A. (1989), “Estimating efficiency in the hospital sector: a comparison of three statistical cost frontier models.” Applied Economics, 21 (5), 659—672.
34. Wagstaff A, Lopez G. (1996), “Hospital costs in Catalonia: a stochastic frontier analysis.” Applied Economic Letters, 3 (7), 471—474.
Publisher – Google Scholar
35. Worthington, AC. (2004), “Frontier efficiency measurement in health care: A review of empirical techniques and selected applications.” Medical Care Research and Review, 61 (2), 135-170.
Publisher – Google Scholar
36. Zuckerman S, Hadley J, Iezzoni L. (1994), “Measuring hospital efficiency with frontier cost functions.” Journal of Health Economics, 13 (3), 255—280.
Publisher – Google Scholar