Introduction
Efficiency notion represents the principal component of a firm’s performance. In fact, the financial service field has currently been subject of exhaustive research works especially over the previous decade. These studies have been predominantly centered on the developed countries cases (USA, France, UK, Italy, etc). Indeed, two research lines have concerned, mainly, the banking industry and the insurance industry (see, for instance, Cummins and Weiss (1993), Berger et al (1997) and Luhnen and Eling (2010) for a survey of these investigations). Still, the most part of this area related efficiency empirical research has thoroughly been dealt with the banking sector, even though insurance turns out, nowadays, to be even more promising. However, most of these studies are based on a sample of US and European insurance companies with a limited number being interested in studying the developing countries’ case (see Luhnen and Eling (2010)). Hence, the purpose of the present paper lies in providing an evaluation of the productive efficiency performance for the Tunisian insurance industry during the decade 2000-2010.
It is worth noting that, as is the case with the developing countries, the insurance industry enjoys a paramount importance in Tunisia, for a number of reasons, namely, (i) it helps the private sector as well as households cover risks and protect themselves from potential losses due, mainly, to damages or accidents; moreover (ii) it could well mobilize long term savings and provide assistance to the banking sector in this regard. Hence, this sector’s efficiency proves to be critically important owing to the fact that the higher its efficiency is, the faster the country’s financial and economic development will be.
It is also worth noting that Tunisia has launched its membership in the WTO as part of a vast liberalization program; thus, proportionately engaging its industrial, commercial and financial sectors at different levels. Actually, this treaty might well initially affect the banking sector, followed by the insurance sector in a second place. Consequently, Tunisian banks have been enticed to undertake a promotional rehabilitation plan, whereby to sustain themselves to keep up with the new liberalization scheme. Hence, insurance firms will probably be in competition with local banks and foreign banks in a first step, as these banks keep coming up with new products such as life insurance. In a second step, local insurance companies will be obliged to engage into competition with foreign insurance companies. Indeed, companies with low productivity levels would be the most affected and vulnerable to endure a rather heavy pressure. They will bear a competitive disadvantage once the industry is open to foreign competitors. Thus, assessing the industry efficiency and its major pertinent features ahead of this liberalization program can be of valuable guidance to the authorities to reach an appropriate economic policy.
Noteworthy, also, an improvement in the industry’s technical efficiency would consequently be of great interest to the customers as well. In this respect, we may consider it particularly useful that some technical efficiency measures should be pursued by the Tunisian insurance companies, as provided in the light of this modest work, through which a short panel data relevant to 13 companies observed over an 11 year period. As a matter of fact, these companies sound to be well representative of the sector given the fact that they enjoy more than 90% of the market share in terms of premiums or claims.
Besides, technical efficiency estimation regarding the panel data framework entails pursuing certain special structure to be undertaken to highlight technical efficiency evolution. So, the relevant perspective results might well prove to be sensitive to such assumptions. In fact, most of the literature proposed models are not nested, which makes specification tests on the best model to fit the data for time-variant technical efficiency not permitted.
Accordingly, the results and conclusions on technical efficiency trends could be different for any particular application. Indeed, there exists a wide range of models, fit for dealing with technical efficiency variability, among which one can distinguish between two particular specifications: the parametric model and the non-parametric model as the DEA window model. We prefer to use the DEA window model. The latter helps confirm that technical efficiency is time-variant. Moreover, to check the robustness, the so-called “parametric window” analysis has been proposed to estimate a parametric frontier model for the same windows used in the non parametric DEA model.
Noteworthy, also, the second part of this work provides a detailed examination of the already achieved time-variant efficiency scores via parametric and non-parametric DEA window framework, using for instance, such procedures as the organizational form, a distribution mode, ownership structures etc. In this respect, a special distinction has been established between two explanatory variable-blocks: those which are under the insurer’s control and the regulatory and market associated ones. Moreover, we have made appeal to the Coelli et al.(1999) advanced method, for the purpose of predicting the most inefficient firms’ technical efficiency on adjusting the variables put under their proper control. The adjustment will be based on the same controlled variables’ respective level, as applied by the most efficient companies’ subject of the sample.
The remainder of the paper is structured as follows. Section 2 depicts a brief overview of the Tunisian insurance industry pertinent features. As for the applied methodology, it makes subject of section 3, while the achieved empirical findings and results are dealt with and discussed in section 4. Finally, the reached conclusions and possible extensions are presented in section 5.
The Tunisian Insurance Industry: A brief overview
As it is the case with the majority of the developing countries, the Tunisian insurance sector is characterized by certain limitations marking the scope of its activities. Indeed, and in respect of other developing countries, this industry is characterized mainly by some restrictive regulatory rules imposed by the authorities: a very concentrated market, very limited life insurance activities, and a low level of total premium on GDP, (1.6% in 2000 and 1.8 in 2010). As a matter of fact, these factors constitute the main elements leading to an inefficient industry. In this respect, Vittas (1996) along with Jouini’s (2003) published works contain a through description of the Tunisian insurance industry. Even though, no technical, cost or profit measures have been included in those studies.
It is worth highlighting that this industry involves 22 companies among which 12 enjoy diversified activities and four are specialized in life-insurance activities. As for the other operators, they are three specialized companies, (one in reinsurance, one in credit insurance, and the other in export insurance), and three Takaful specialized insurances. There also exist four off-shore companies operating with non-residents.
As regards the present work, our sample selection is limited to just 13 companies. These companies represent actually the real actors in the Tunisian market, enjoying more than 90% of the total premiums and claims. Hence, The Tunisian insurance market is highly concentrated; the Herfindahl index based on claims is equal to 1920 during the 2000-2010 denoting a very high concentration level, the index is discovered to be stable, 1950 in 2000-2001, and 1910 in 2009-2010. This index stability, noticed over the decade, suggests that the Tunisian insurance market was remarkably non contestable. In fact, the Tunisian insurance industry is rather close to an oligopoly, since very few companies enjoy more than 50% of the market share. In addition, the market structure is marked by the predominance of private ownership: There are two public companies owning 19.8% of the market share in 2010, 4 mutual companies owning 19.1% and more than 60% of the market is controlled by 12 private joint-stock companies. Overall, more than 90% of the companies’ activities are concentrated in property liability insurance, while life insurance is poorly developed, making up less than 10% of their operations in 2010.
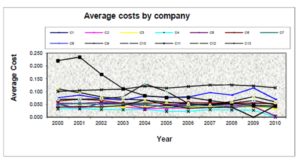
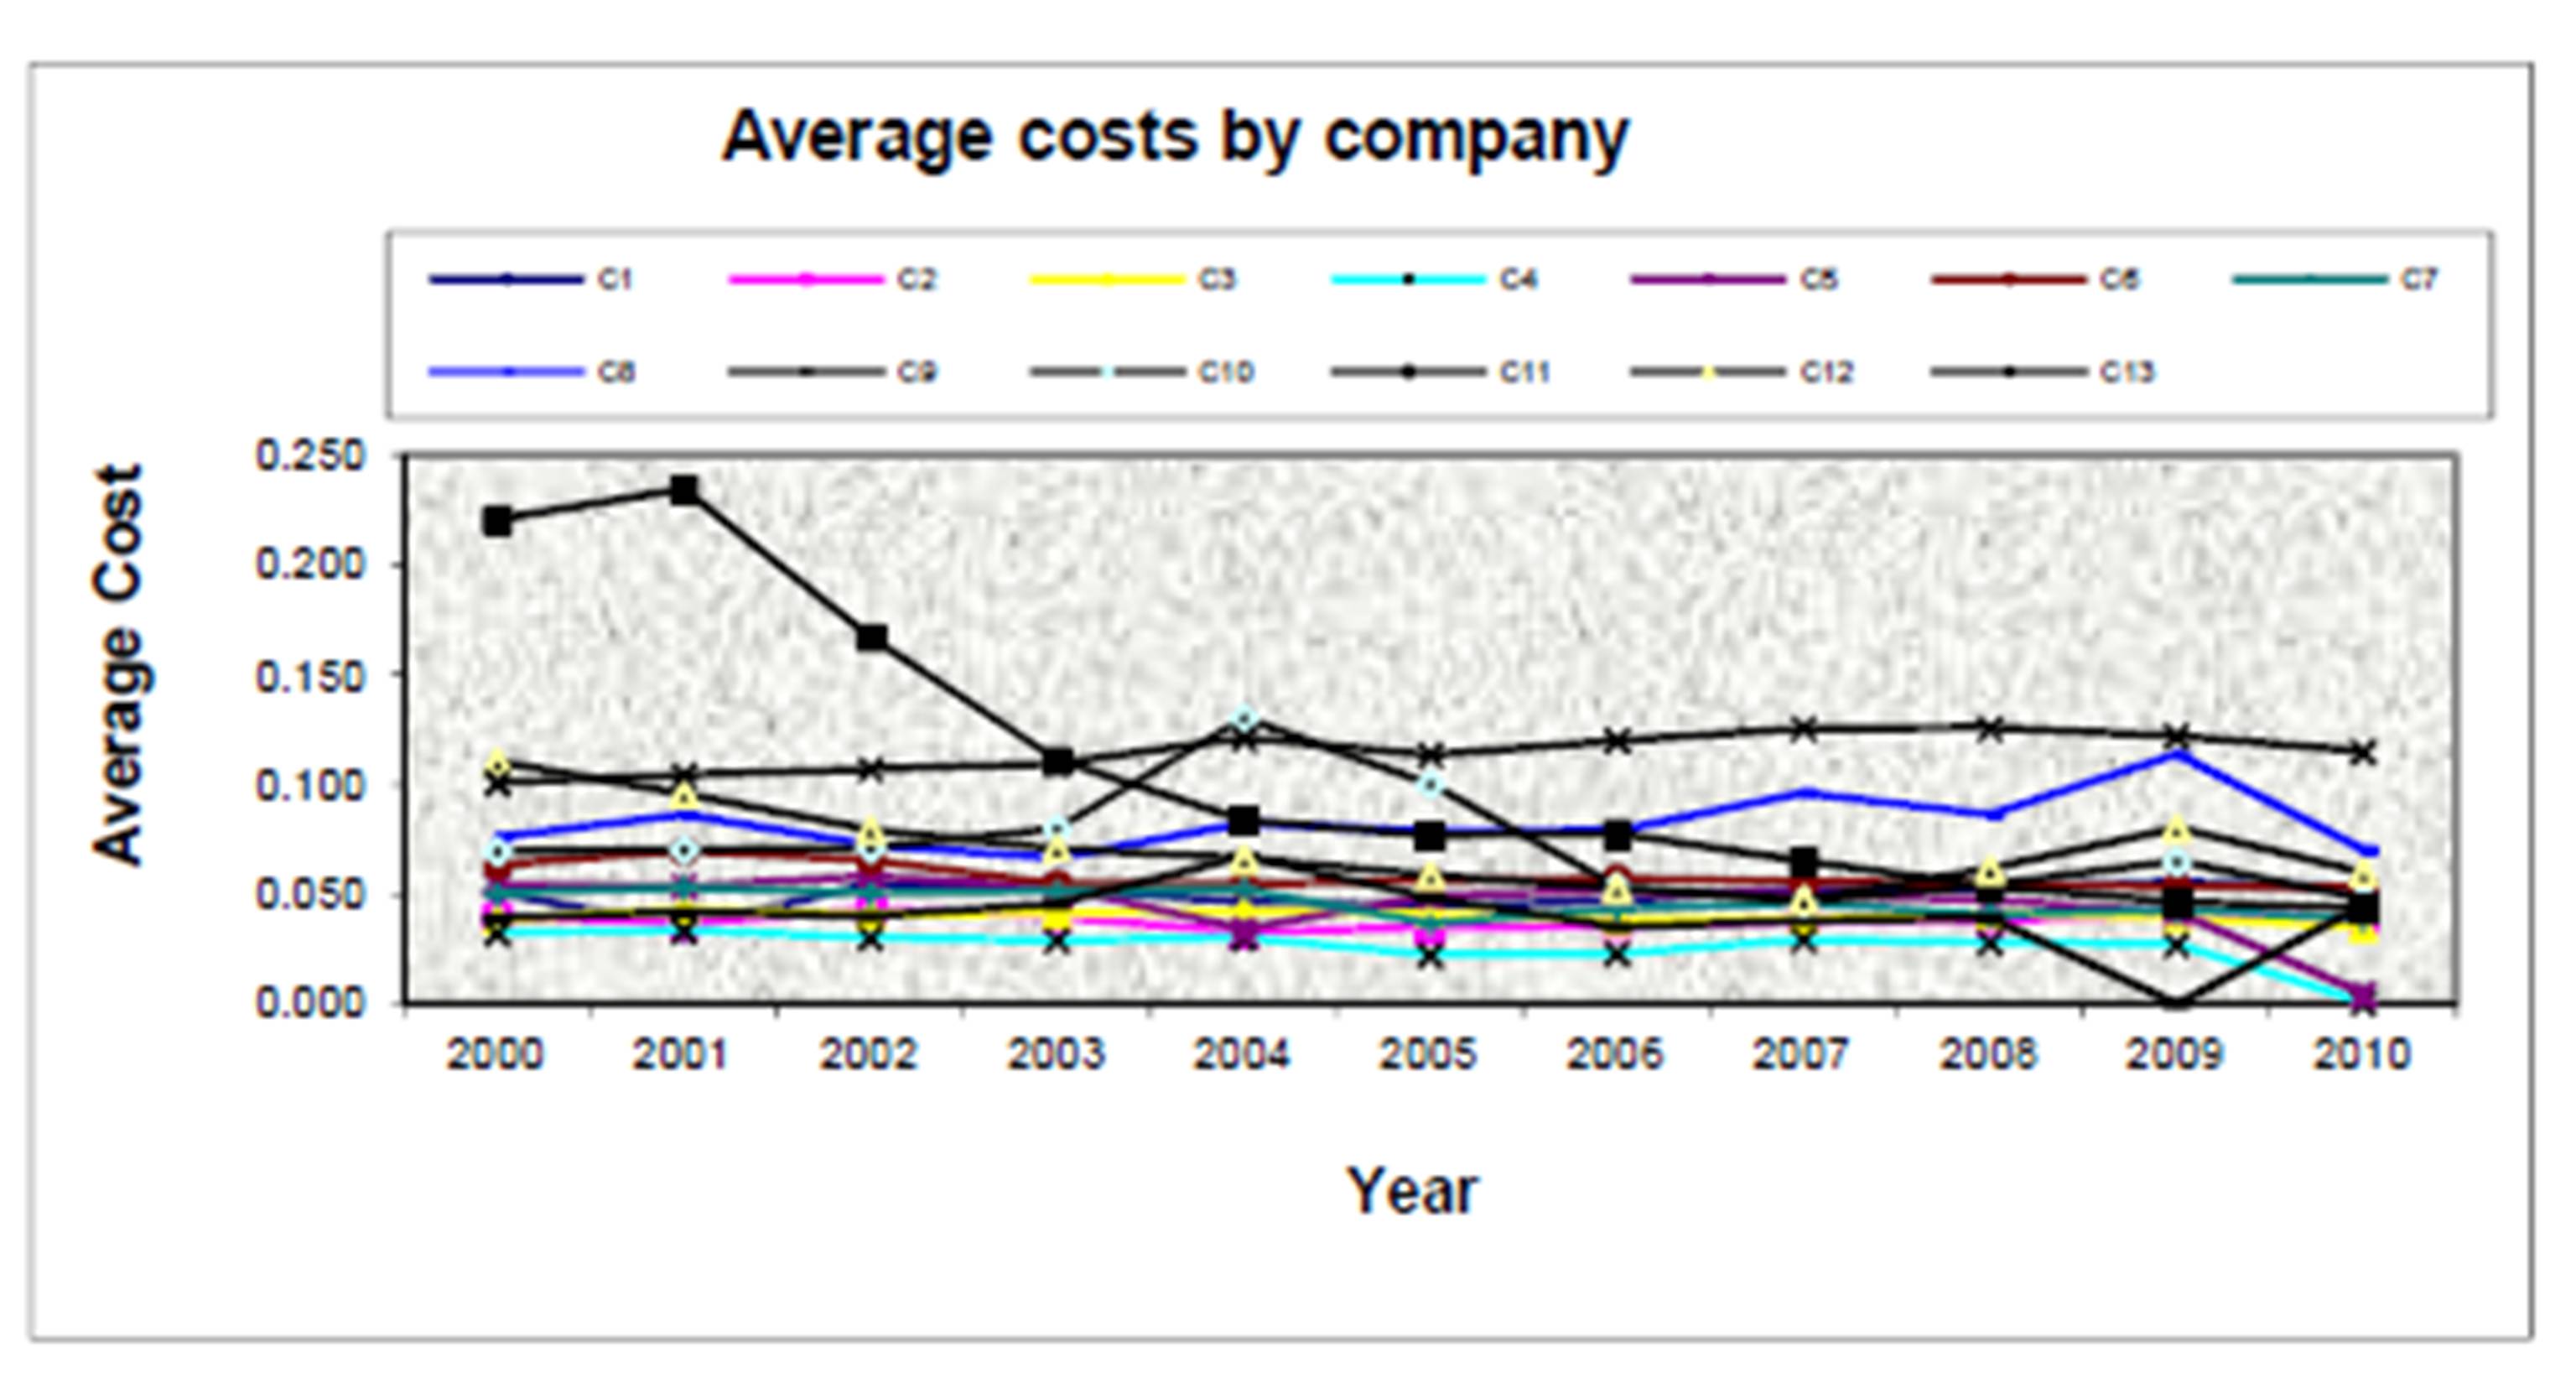
Figure 1: Company average cost evolution
Thus, one might well deduce that lack of a real competitive pressure, typically characterizing this sector, has resulted from highly dispersed average costs, as expressed by figure 1. Indeed, average costs, as calculated by the ratio of total cost to total assets over the entire period studied, appear to be very stable reaching a threshold of 0.9% in 2000 and 0.8% in 2010. Yet, one might well notice the prevalence of large scale remarkable dispersion among companies subject of study. This finding actually reveals that some companies do appear to control their average costs more effectively than others. This fact might well have its explanation in the difference apparent in cost efficiency. Still, due to the absence of enough available information on input prices, our analysis will be exclusively focused on technical efficiency.
Methodology
It is worth mentioning that for an effective technical efficiency empirical measurement to take place, via panel data sample framework, a special frontier construction approach needs to be opted for, i.e. either a parametric frontier model or a non-parametric one. Regarding the first model case, several choices are available and might be considered in terms of parametric form likely to help assess technical inefficiency evolution over time. As for the second model, such assumptions are not required, and it is actually this second type which will constitute the subject of study in the present work.
Window Frontier Model and Panel Data
The non-parametric DEA model is considered as a frequently applied framework whereby technical efficiency can be estimated. The main advantage attached to this method lies in the fact that it does not require specifying the technology by a specific functional form. Most often, this method is usually applied for the sake of investigating cross sectional data, under static conditions. Noteworthy, if the number of DMUs is important in the cross sections, it becomes possible to run a DEA model to get a special TE measure corresponding to each unit, and then examine the TE evolution concerning each single firm over the entire period.
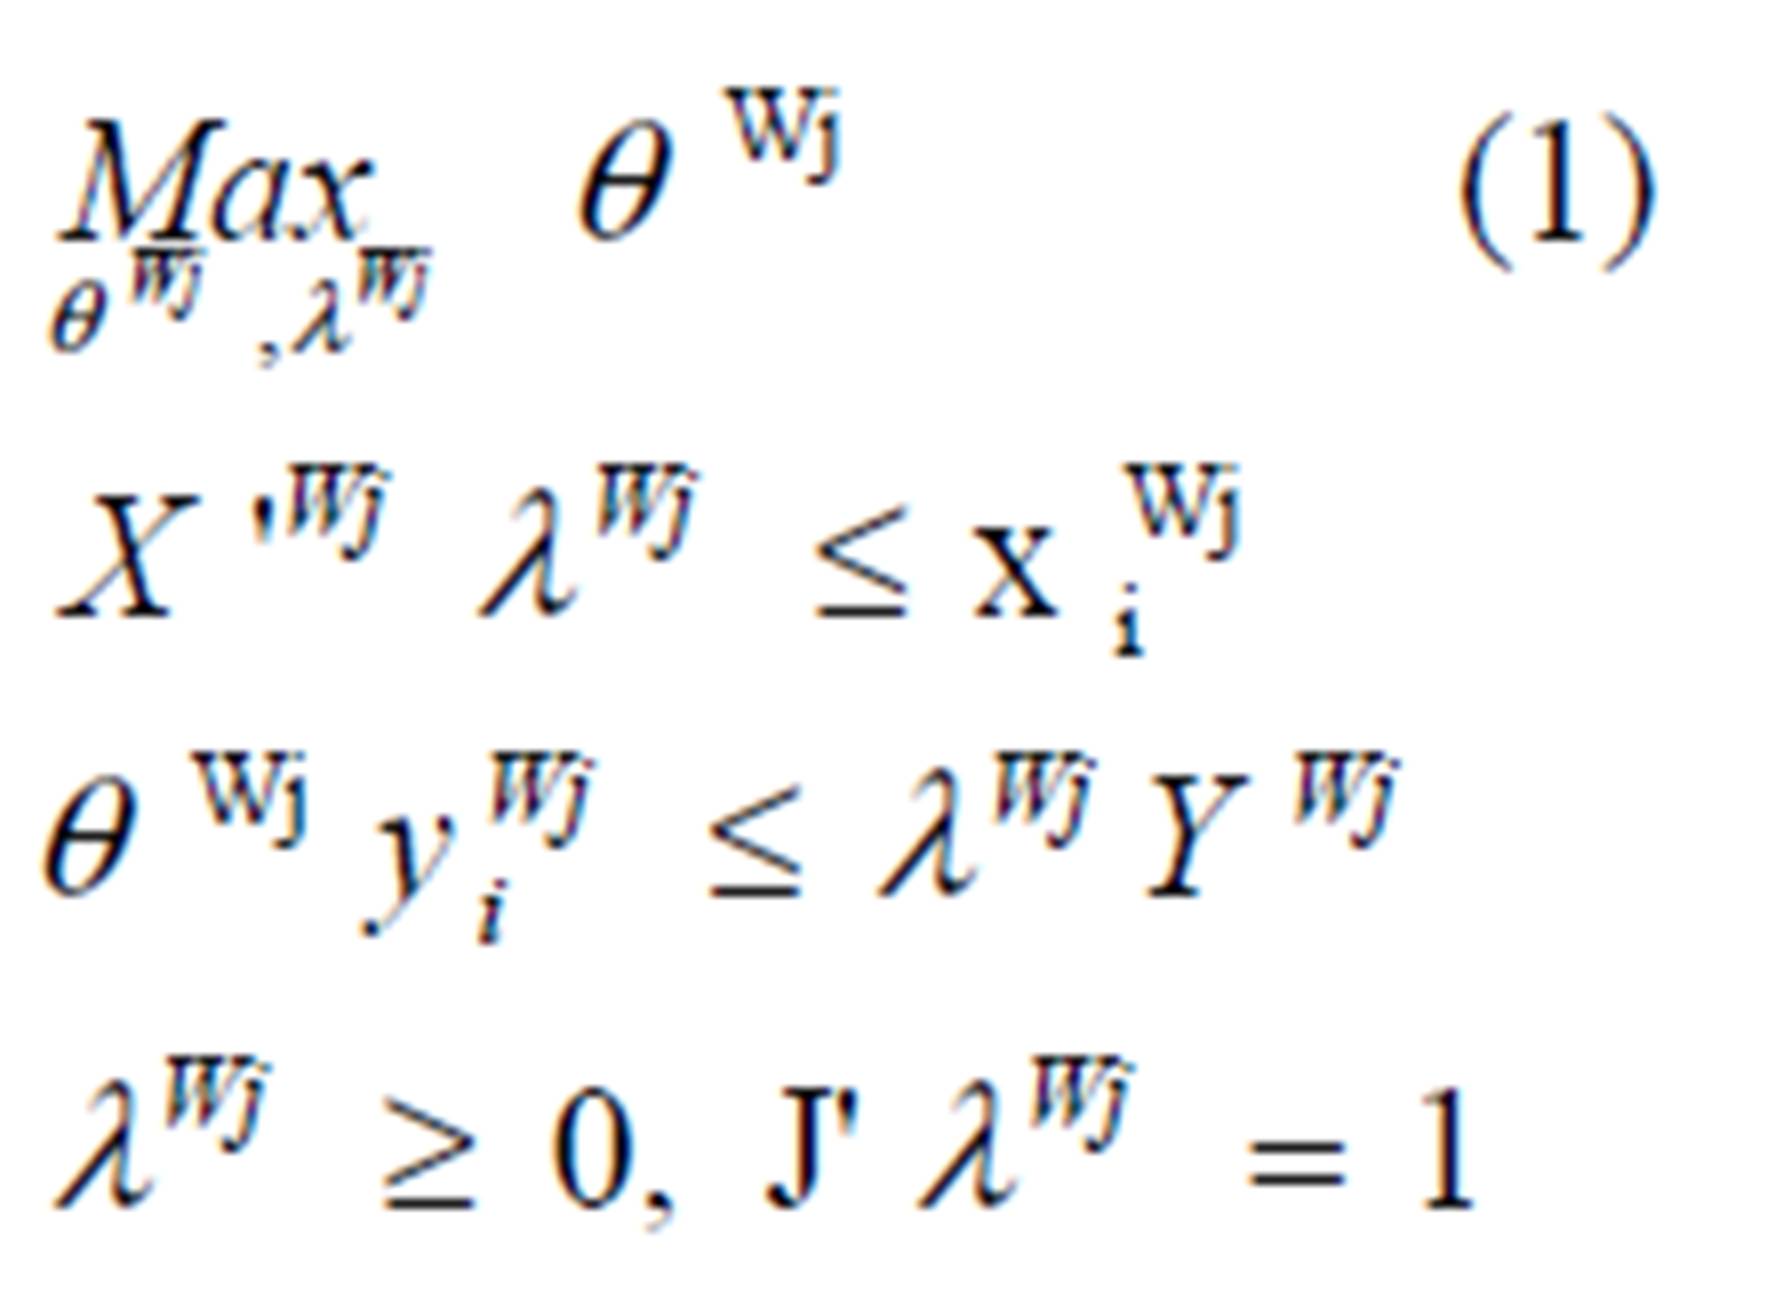
Regarding panel data, the DEA window method stands as another alternative whereby to take account of the data contained TE components’ dynamics. The idea of the DEA window method serves to form windows through the merger of successive cross sections. Hence, if, for instance, p is the window length1 (p≤T), the first window W1 is formed by the p first cross sections and observed for the years 1,2,…, p; the second window W2 is formed by a second set of cross sections, observed for years 2,3,…, p+1, and so on and so forth . The process is kept on till reaching the last time period T. Thus, the ultimate window turns out to be composed of the T-p, T-p+1,…, T cross sections. In sum, after the window length is fixed, one turns to consider the successive cross-sections’ series while applying the DEA models on them. In this way, every firm or DMU is compared not only to its proper p realizations, but also to the other DMUs’ achievements, and all of them are actively shifting over time. Thus, for a sample of producers using K inputs and producing M outputs, the output-oriented Window DEA model would constitute a fit solution to the following linear programming problem:
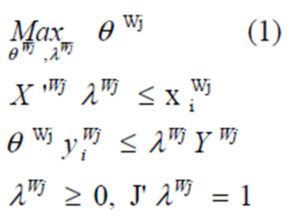
Where XWJ is K by Np the input matrix in the window WJ with columns XiWJ (with index i denoting the window related observation). YWJ is M by Np matrix of outputs with columns yWJ. λWJ is Np by one intensity vector, and J is a vector of ones.
This program has to be solved for each window DMU, so that the technical efficiency scores pertaining to each DMU2 can be obtained. Regarding any particular DMU, its average efficiency score could be assessed on a yearly basis for the sake of deducing the technical efficiency evolution process.
Actually, this method has the advantage of making the evolution free from any parametric formulation for the inefficiency components in the model, which is not the case for the parametric frontier models. Still, the DEA window model exhibits the same limits as the DEA model, as the data innate noise is often not considered. As a result, one may apply a parametric frontier model to the windows’ model defined earlier, in such a way as a “parametric window frontier model” can be attainted. In this respect, two frontier types can be depicted, namely, a deterministic frontier if noise in the windows’ frontier specification has not been considered, or else, a stochastic frontier once noise is added to the model. In both cases, one may well take the advantage of the DEA window method as no parametric form needs to be imposed on the TE components’ evolution. Besides, a symmetric error term can also be introduced in the parametric frontier specification while constructing a stochastic frontier on the parametric DEA window, thus, extending the DEA window model. In a last stage, the achieved results can be compared to the different literature-advanced methods for the purpose of identifying the most appropriate specification fit for TE evolution corresponding to the data available.
The Two-stage Method
It is worth mentioning that the frontier models’ major interest lies in allowing the TE measurement, corresponding to companies subject of the sample, to be derived. Once the relevant firm’s TE scores are attained, one might well ask about how differences among such scores can be interpreted. In this respect, two major well-known methods are commonly applied to solve such a problem. The first method is known as the one-stage method, which enables to estimate the relevant frontier and provide pertinent explanation on efficiency component by means of variable sets (see Battese and Coelli (1993), Wang and Schmidt (2002), Johnson and Kuosmanen ( 2011) ). The frontier is, then, estimated via the maximum likelihood method.
The main limit of this method is that any specification error in the explanation of TE components will systematically bias the parameters of the frontier itself. So, the derived TE scores could also be affected by such a bias. For this reason, some authors tend to prefer the two-stage method (see Cummins and Weiss (1999), Banker and Natarajan (2008), Kuosmanen and Johnson (2010) Simar and Wilson (2011)). According to this method, the frontier is estimated on a first stage, while on a second stage the efficiency scores are regressed on a list of explanatory variables. This is the most commonly used method in the financial service efficiency literature. Besides, it has the advantage of being applicable to both the non-parametric as well as the parametric approaches.
Data and Results
The sample subject of our panel data is made up of 13 Tunisian insurance companies observed over the period ranging from 2000 to 2010. These companies, we consider, constitute a representative sample of the Tunisian insurance industry as they involve more than 90% of the market shares on claims or premiums. Indeed, we reckon that these companies, in their entirety, share the same technology range, given the fact that we do not have enough specialized companies in order to estimate specific frontiers. The commonly used definition of outputs and inputs, as used in the empirical literature by Cummins and Weiss (2000), will actually be applied in this particular research.
In this context, every company is considered to use physical capital, financial capital as well as labor as inputs to produce a particular output. The physical capital is measured by total real estate, while the financial capital is measured by equity capital, and the labor input by the total number of employees per company. As for the Output, it is measured by means of total amount of premium3 earned by company. The choice of input and output is in line with the recently elaborated empirical literature dealing with the insurance field, (see Cummins and Weiss (2000)) for output and input variable definition). All nominal data have been converted to real value by means of GNP deflator relevant to the year 2000, used as the basic referential year. In fact, the different time-varying technical efficiency models are estimated in this respect, namely, the earlier discussed ones. The idea lying behind this process consists in retrieving the best specification fit for our data set, since each model is based on some specific assumptions.
The Window Analysis
A special DEA window analysis is undertaken in this particular conduct. Such a method has the advantage of not imposing any parametric specification both for the frontier as well as the technical efficiency component’s temporal evolution. Indeed, this analysis would serve to signal any particular trends or fluctuations remarkable in the technical efficiency scores without imposing any particular functional form on these fluctuations. So, the DEA model is performed on the entirety of companies via different-year-length, 2, 3, 4 and 5 lengths providing 10, 9, 8 and 7 window runs. Conclusions concerning the technical efficiency scores evolution per company are very close for any of the window lengths used. For this proper research, we retain the case of 3 years-length only.
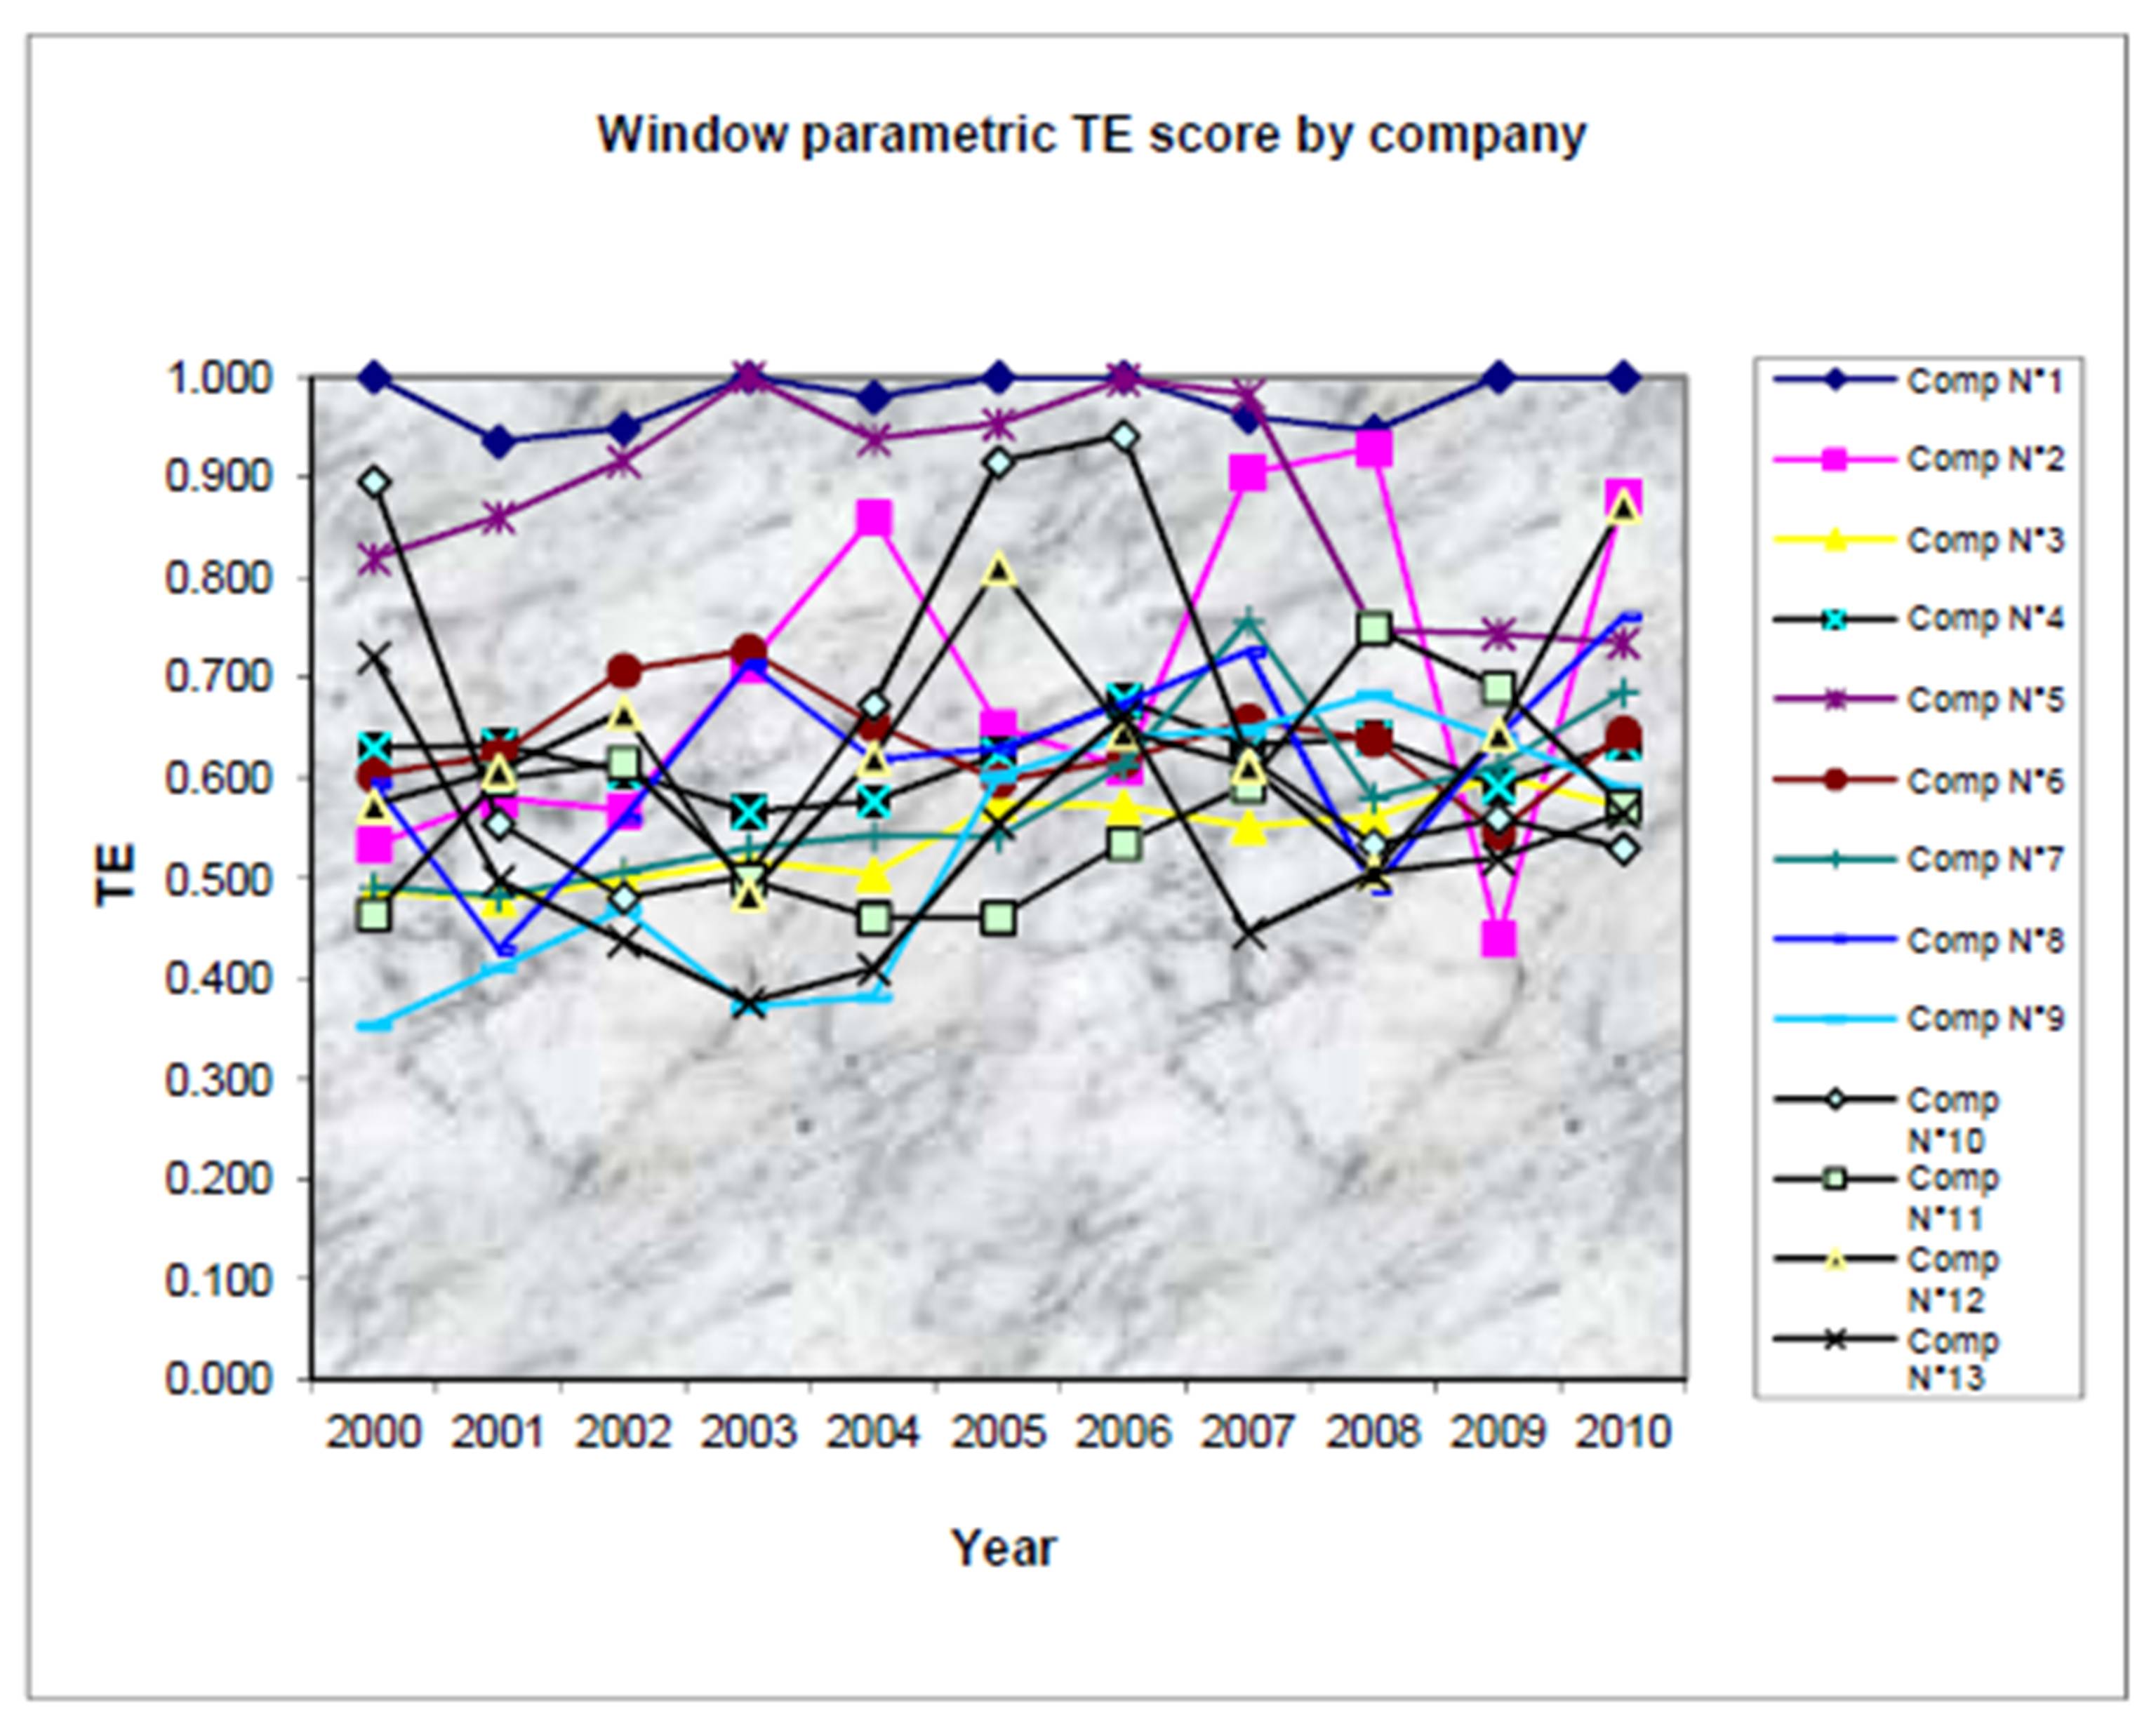
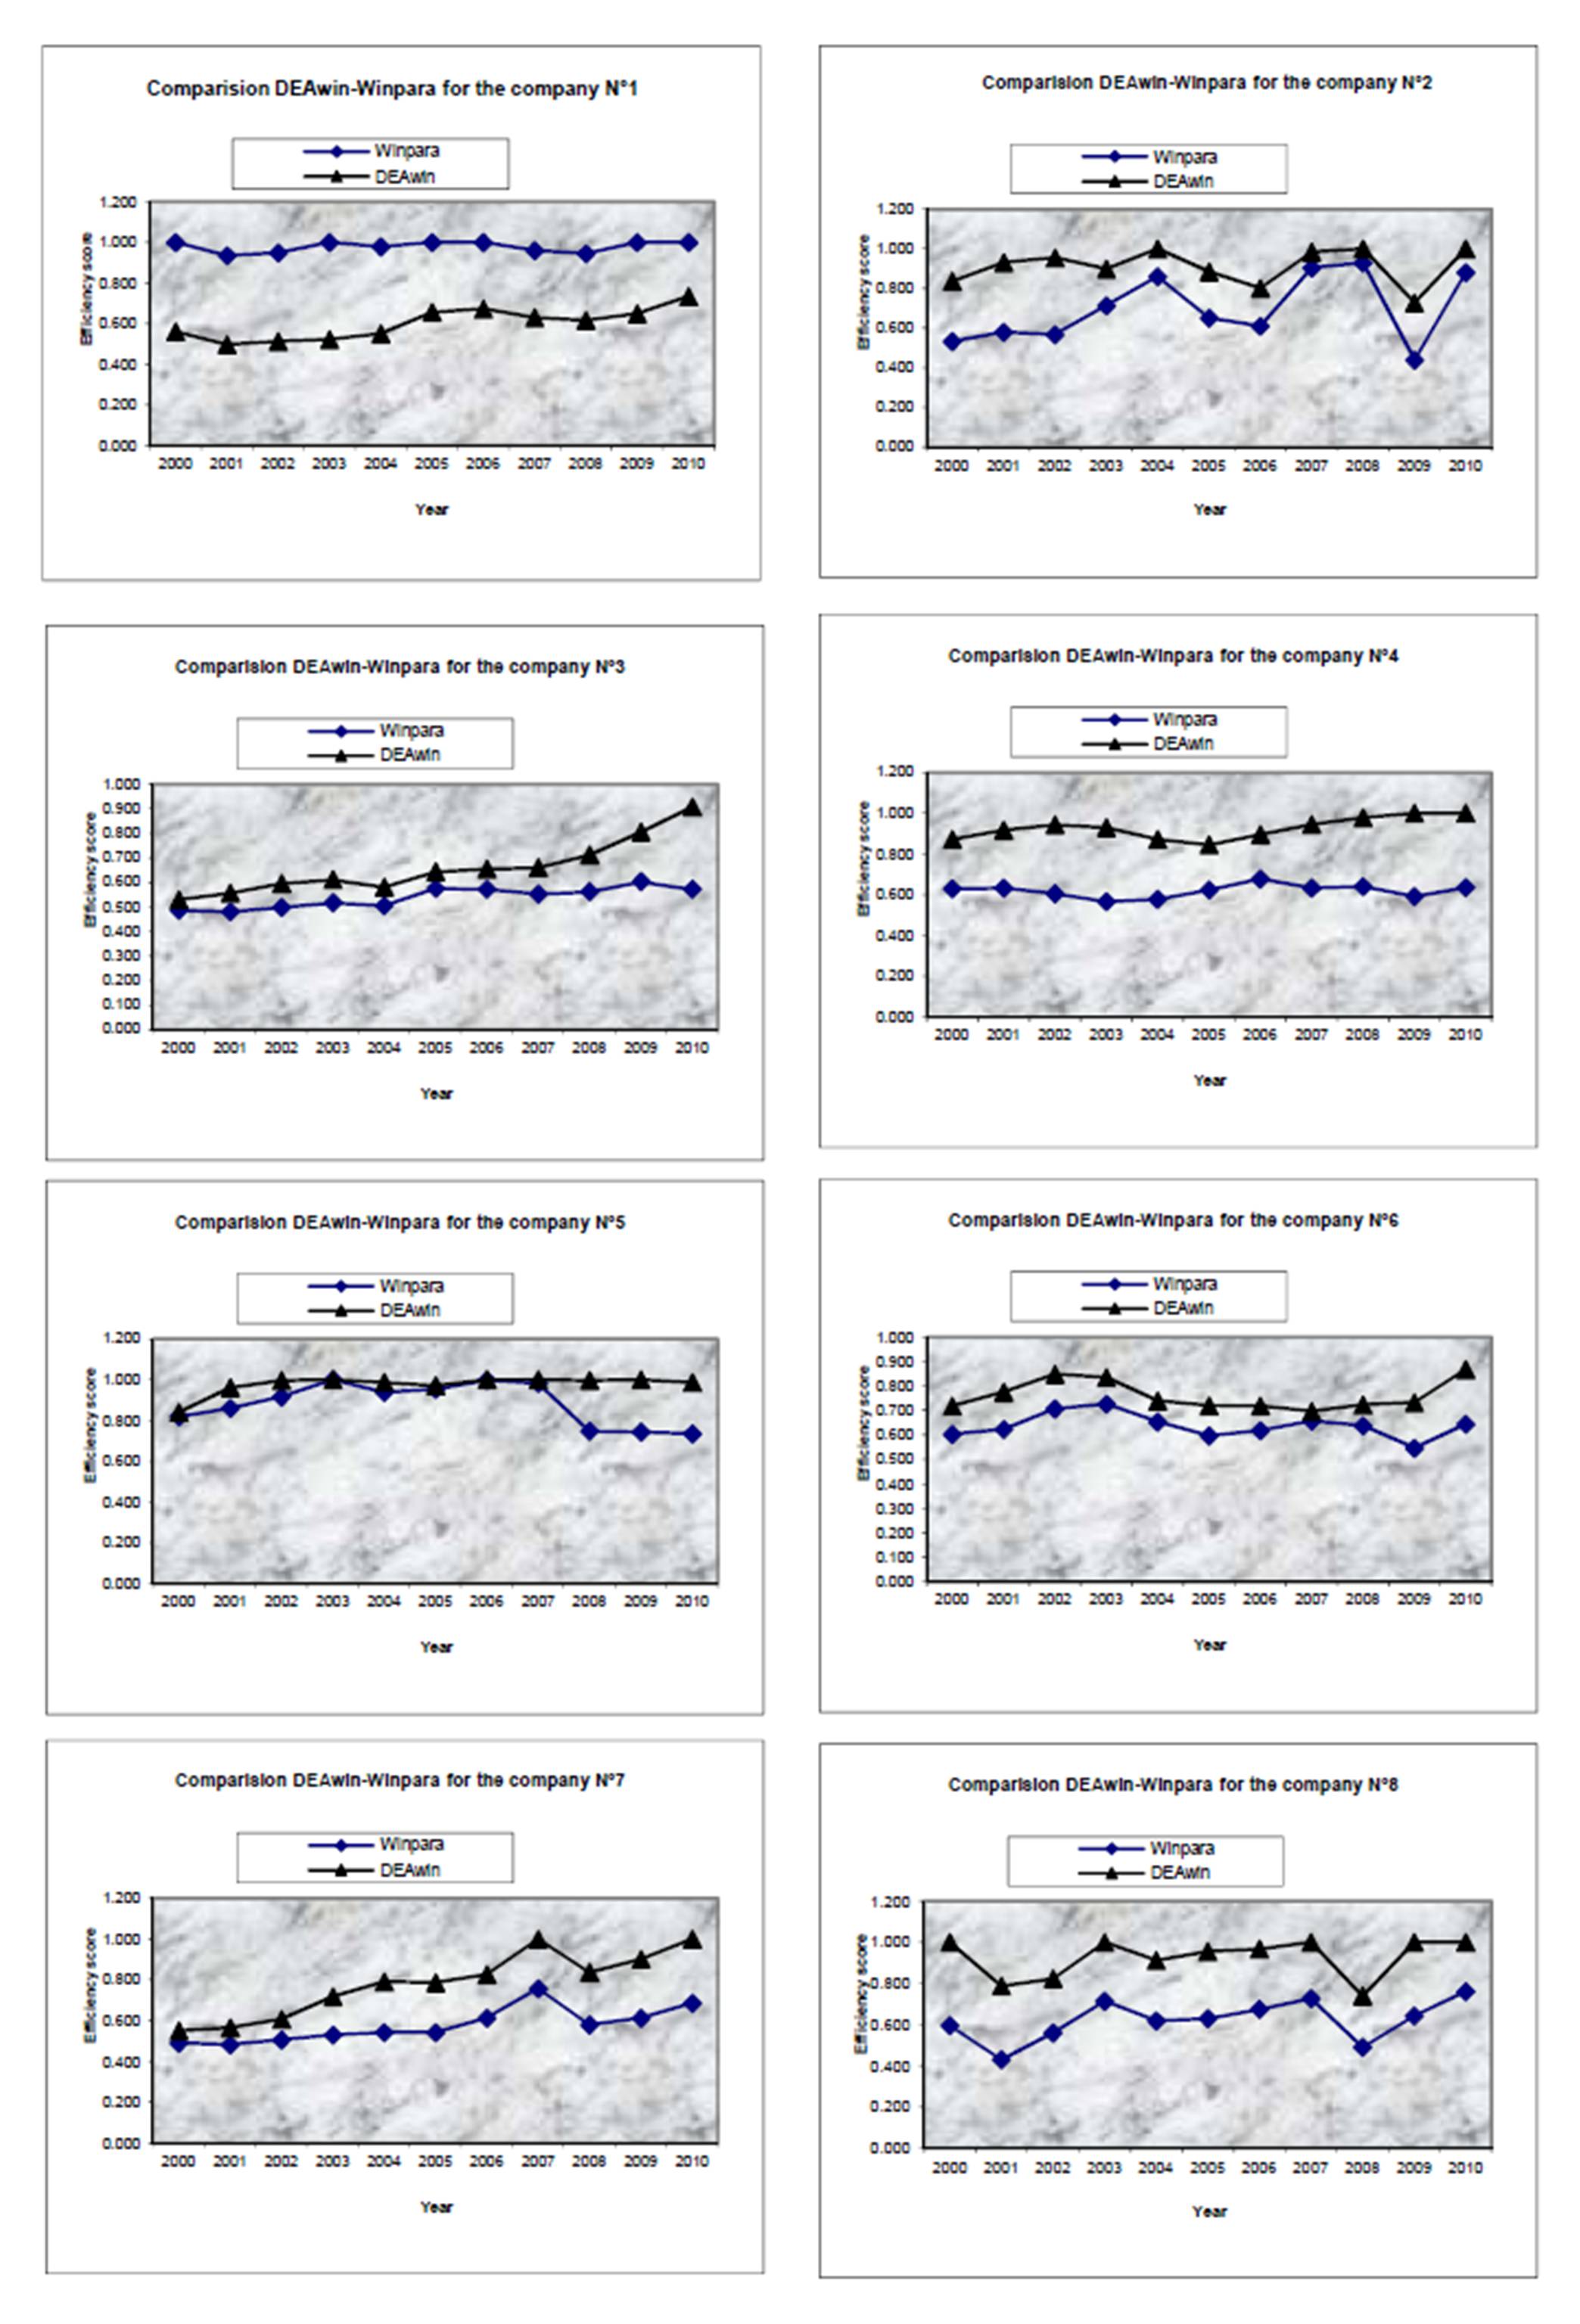
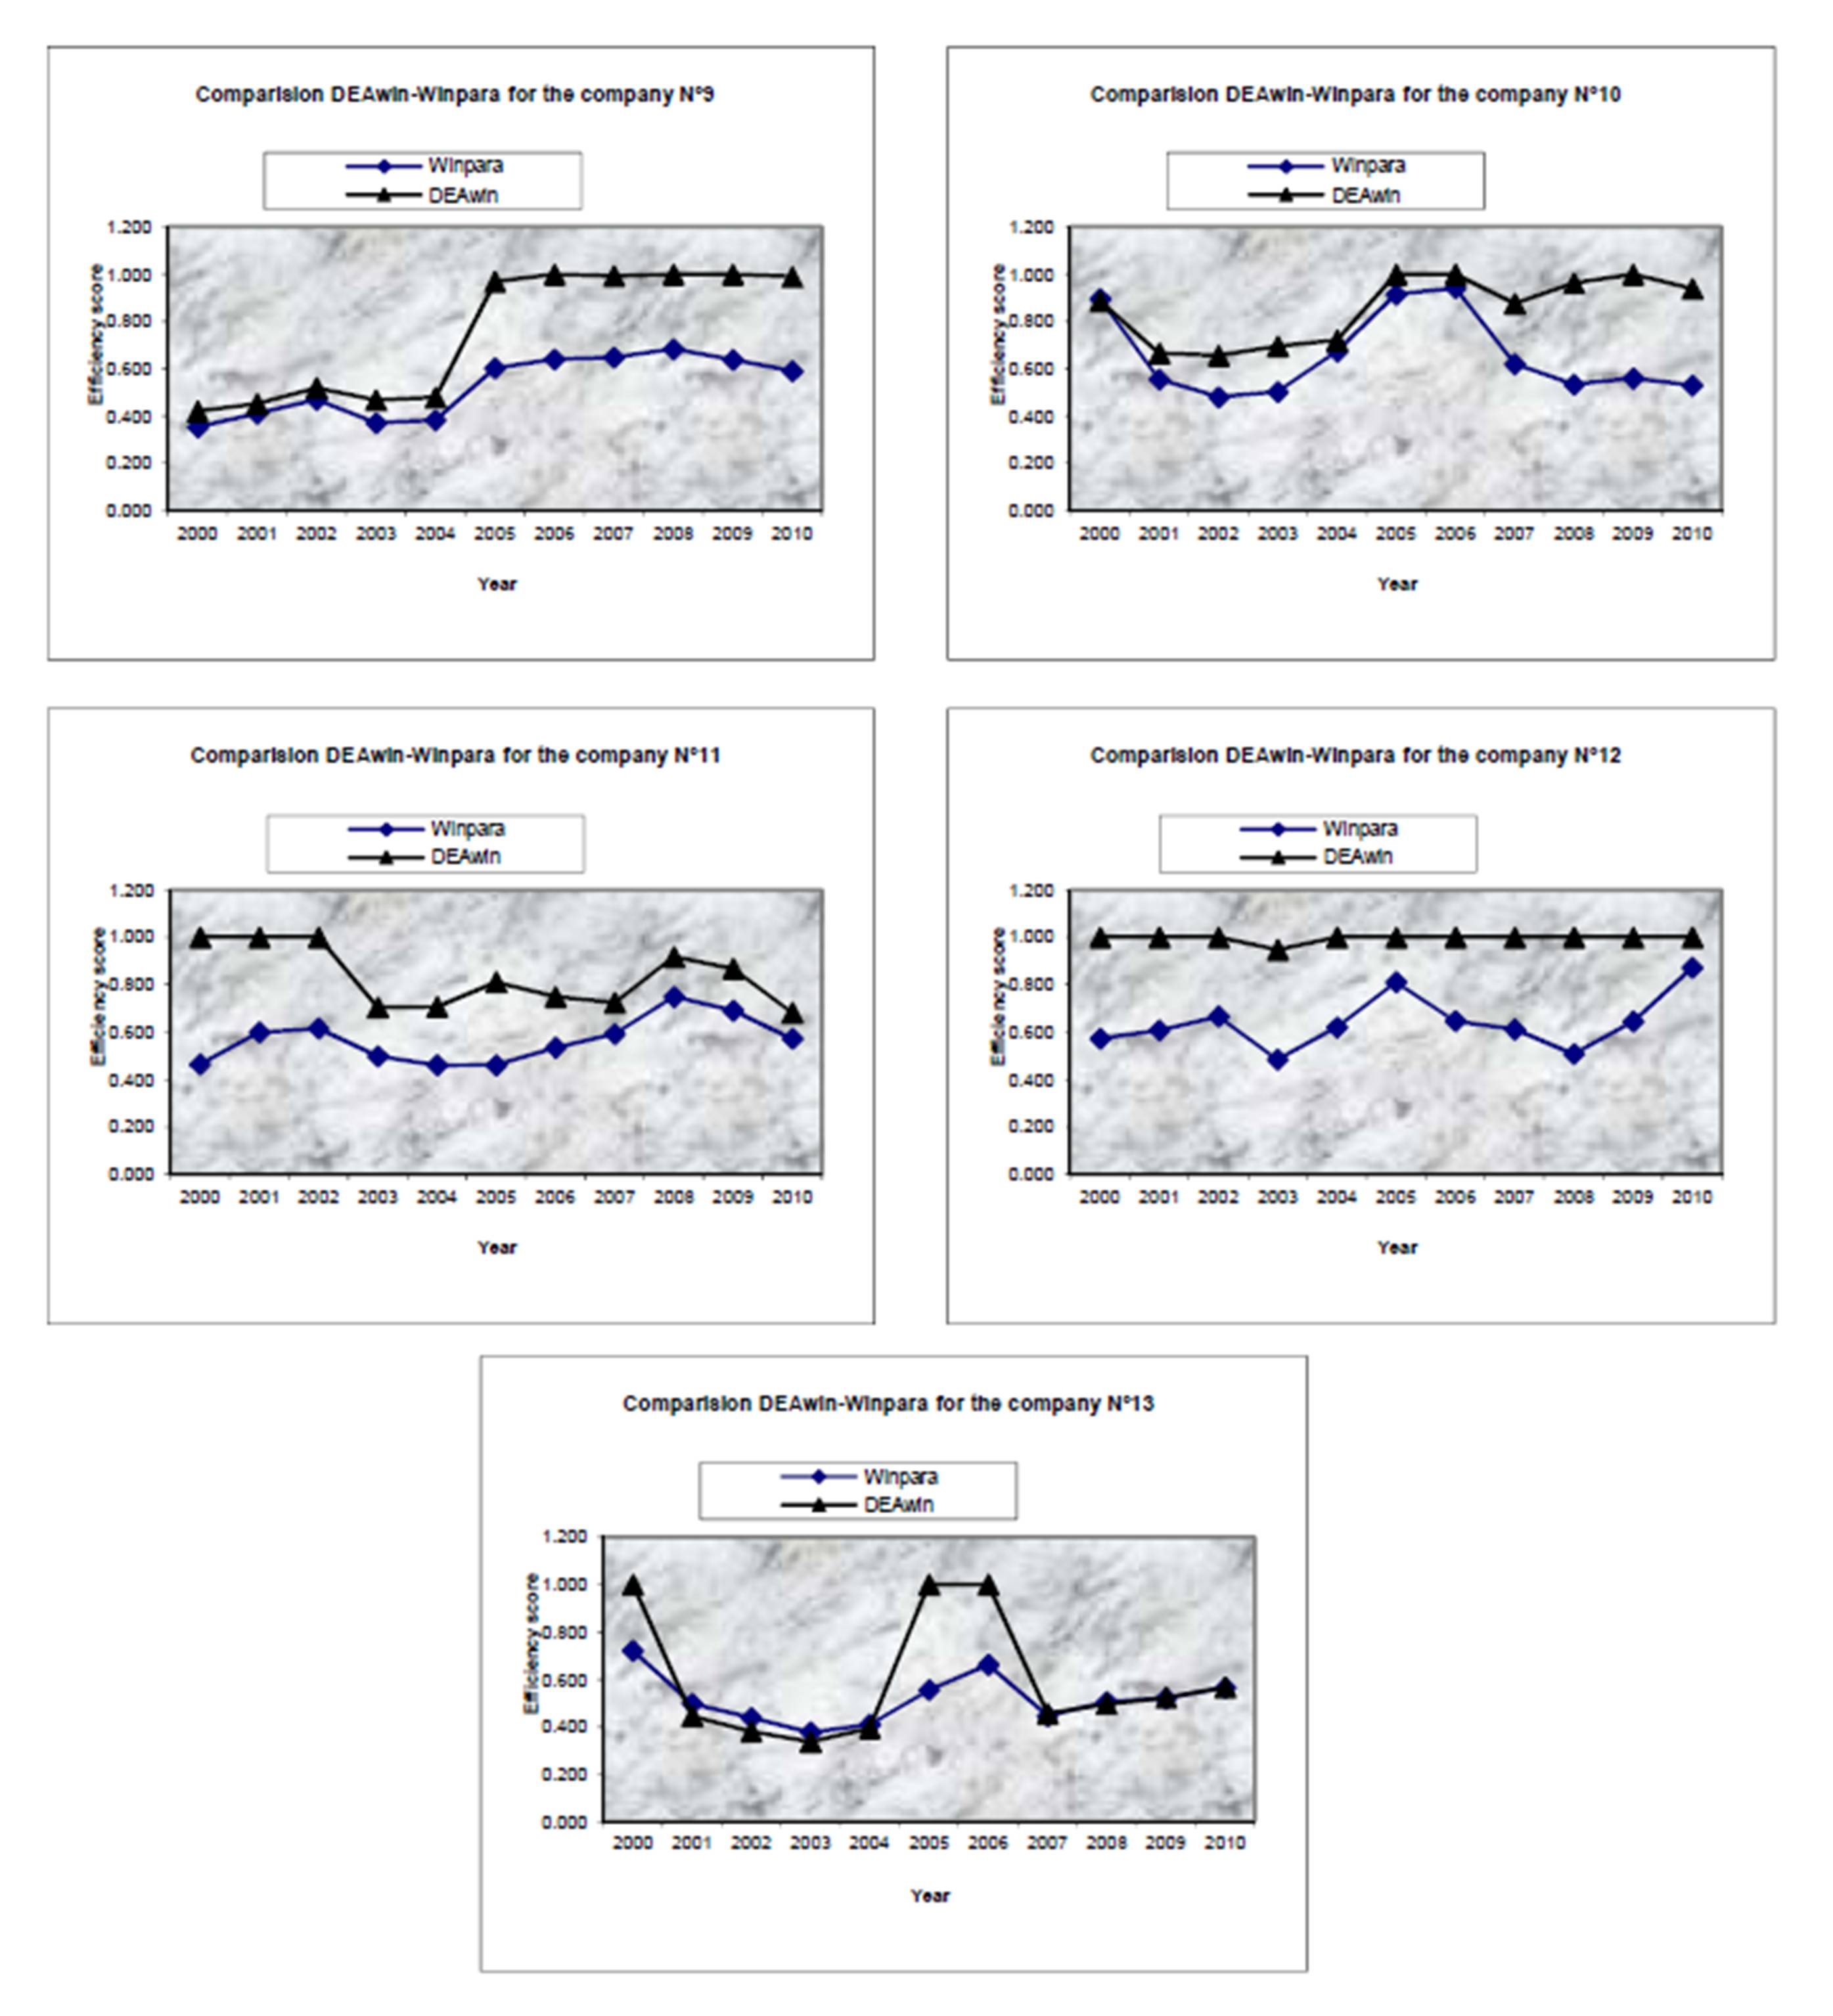
The most interesting result is that technical efficiency by company turns out to be time-variant. Furthermore, every company seems to have its own evolution in terms of TE, as depicted in the company TE figures reported in the appendix. Furthermore, and for the sake of validating the robustness of our attained results, a similar window analysis has been conducted and a Translog deterministic4 frontier has been estimated on each window in order to get the measurement of efficiency scores for each company in the window. This method has been thoroughly detailed in the previous section of this paper and dubbed parametric window method. Similarly, the same previously mentioned window lengths (3 year length) are used. In effect, the results achieved are very robust to the window length as it was obtained via the DEA window method.
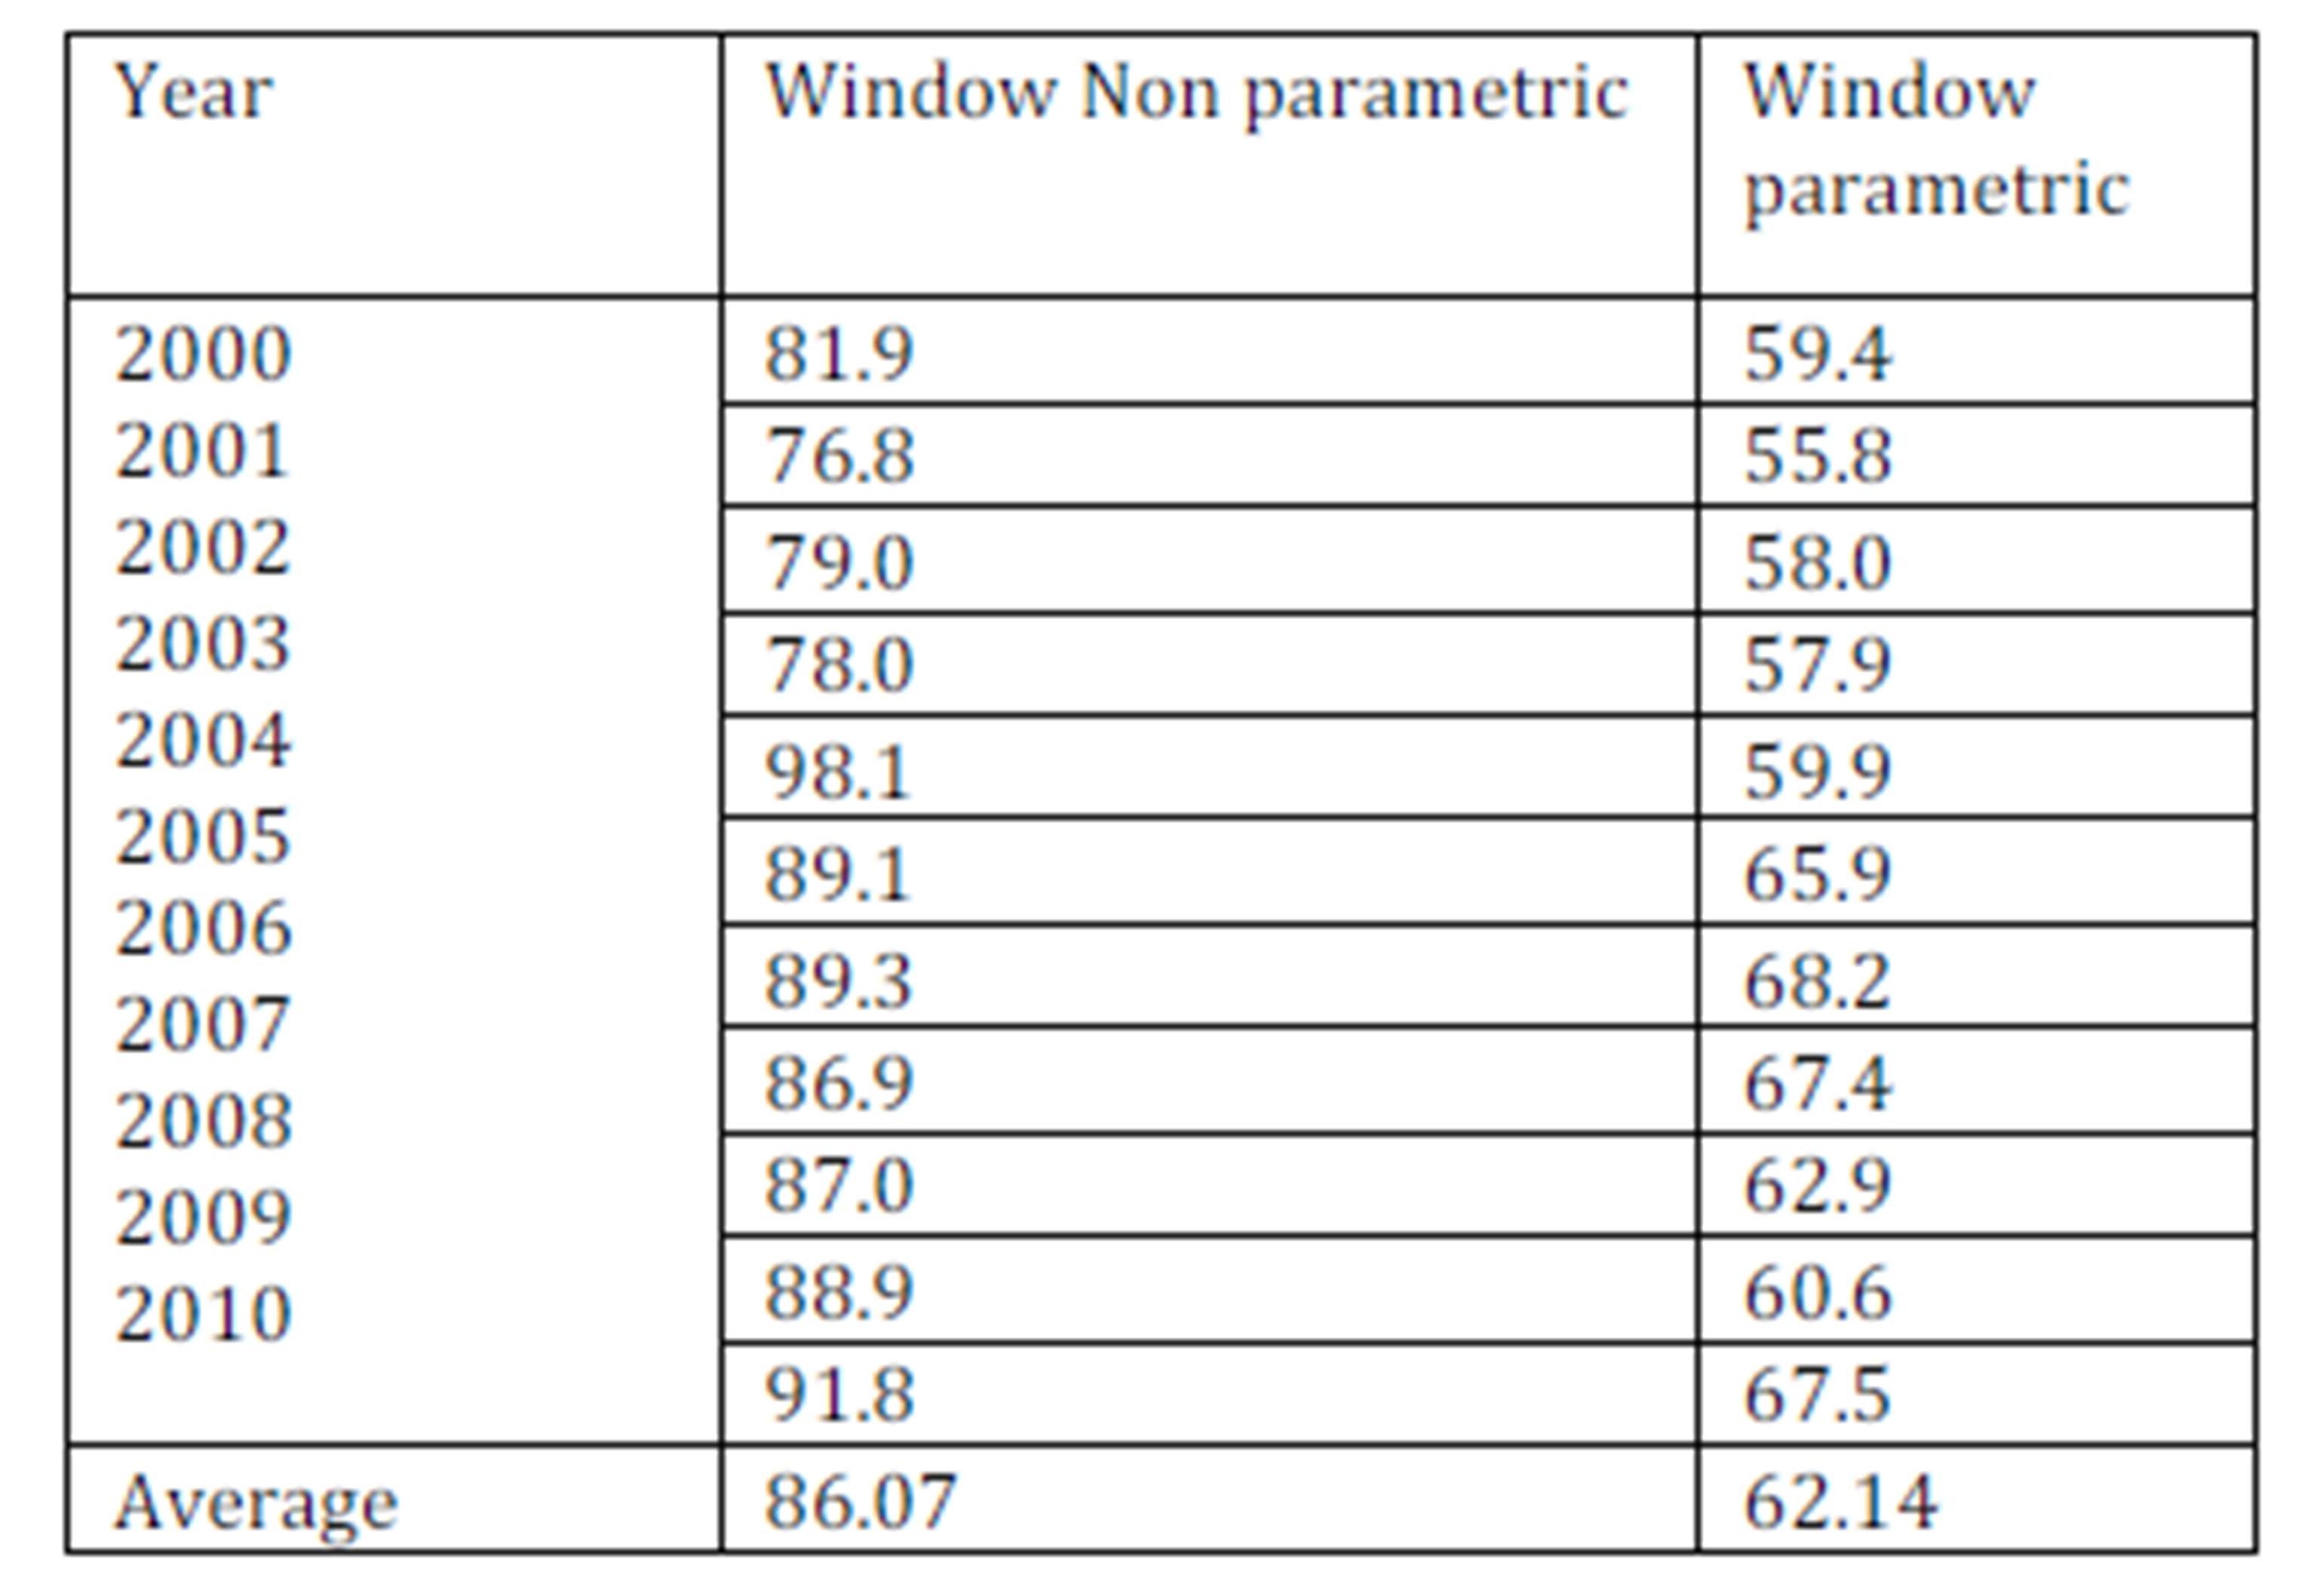
The average TE score values’ evolution per company, appearing in the windows, is reported in the appendix figures. These figures confirm the previously reached conclusions highlighting that each company does have a proper TE evolution over time. Moreover, the superposition of the two TE scores’ evolution achieved via both parametric Window and non-parametric Window models are quite close. Besides, the technical efficiency scores’ correlation rank obtained through these two methods is high (70%).Yet, the reached TE scores’ average values prove to differ quite largely: with non-parametric Window model providing higher TE average scores (86%, for the 3-year length non parametric window model, and 62%, for the 3-year length parametric window model).
The efficiency scores derived via the non-parametric window model are discovered to be greater than those stemming from the window parametric model. Such a result might well have its justification in the fact that, by construction, the DEA model helps rather identify much the efficient firms than does the parametric deterministic frontier model .Thus, each window’s average efficiency scores in each window obtained via each method will be different. However, in comparing the average values, technical efficiency evolution over time suggests well a strong time-variability correlation as depicted in table 1 below. In addition, figure II in the appendix illustrates the technical efficiency scores temporal evolution as achieved through window models (both parametric and non parametric). The reached finding turns out to be very interesting for a number of reasons, mainly: (i) for the entirety of the studied companies, both methods exhibit a similar time-variability of technical efficiency scores, and (ii) it has also been revealed that technical efficiency variability over the investigated period does not prove to be the same for all companies. These conclusions are not conditioned by a specific functional form of technical efficiency variability.
Table 1: Average technical efficiency score by year (in %)
TE scores’ interpretation and a new company benchmark
The reached results suggest that the studied companies exhibit a specific time-variant technical efficiency component. This part of research is devoted to provide a special explanation of these TE differences. In this respect, two variable blocks can be distinguished; the first block is composed by all the variables which are under company’s control. Thirteen variables have been retained, among which are: Claims to premium ratio, reinsurance to premium ratio, and returns on total assets. Moreover, ratios reflecting every company’s output choice in terms of premium selection have also been considered. Besides, four proportions of direct insurance premiums to total premiums have been retained, namely, motor premiums, fire premiums, life premiums and health premiums proportions. These variables should represent the company’s commercial strategy in terms of either customer selection or moral hazard reduction. Furthermore, the four last variables have been cross-sectioned to detect some sort of scope economies likely to help explain technical efficiency.
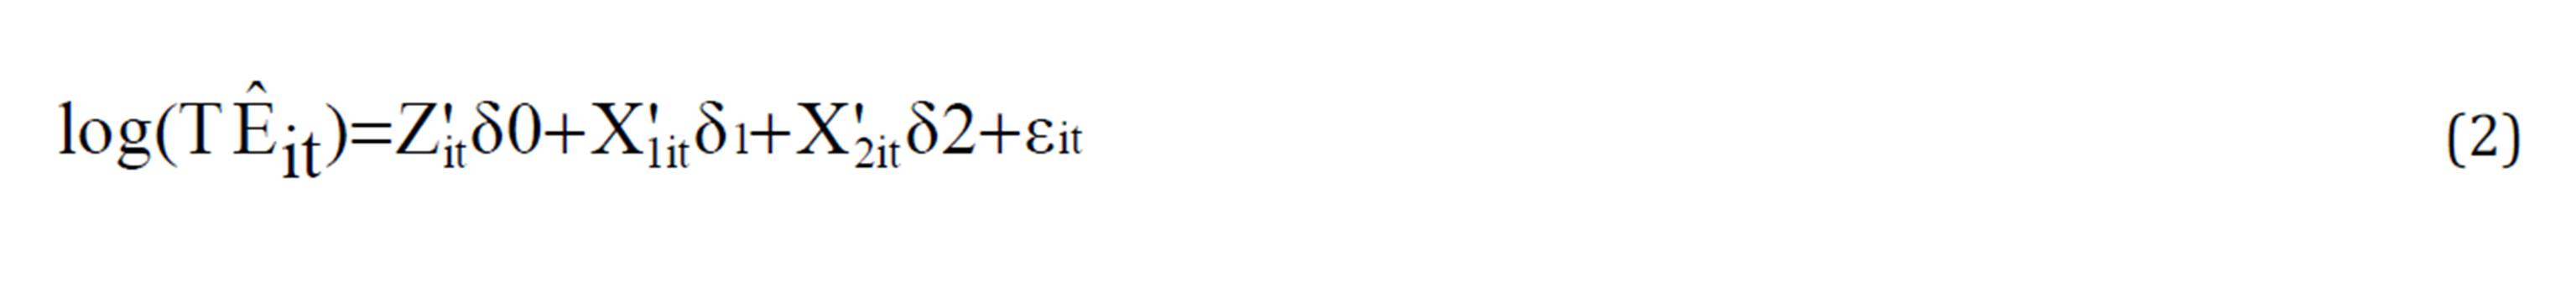
As for the second variables’ block, it includes all the institutional and environmental variables that are not under these companies’ control. In this respect, seven variables have been retained, namely: three organizational dummy variables (Public, Private and Mutual), return on equity ratio, solvency ratio, Herfindahl index based on premiums and company age. Hence, the following semi-logarithmic model has been estimated to explain the TE scores:
Where:Z‘it is the vector involving the variables not related to the companies control or to the factors dealing with environment. In this regard, two variables have been considered: the Herfindahl index as well as the company age.
While the first variable serves to measure the competition level within the Tunisian insurance industry, the second variable is rather more connected with every firm’s proper history.X’1it is the vector that comprises the explanatory variables which are not under companies’ control, such as firm ownership structure: public, private and mutual, along with two extra variables which reflect the regulation imposed constraints aimed at protecting the insurance customers, more particularly, the equity to total premium ratio (RETEQU) and the solvency ratio (RATSOL).X’2it stands for the company control variables’ vector. In this respect, the following ratios have been retained: the claims paid to premium ratio (RATSIN), the reinsurance ratio (RATSREINS) and the return on total assets (RATROA). Concerning the first ratio, RATSIN, it serves to measure each company’s ability to control claim payments.
As regards the second ratio, RATSREINS, it controls more the risk management of the companies. As for the third ratio, RATROA, it is conceived to relate the companies’ efficiency to their profitability. Besides, four ratios dealing with every company’s output choice in regard to proper premium selection have also been accounted for. Indeed, four proportions of direct insurance premiums to total premiums have been retained, namely: motor premiums (CARSHARE), fire premiums (FIRESHARE), life premiums (LIFESHARE) and health premiums (HEALTHSHARE), (these variables should represent the company’s commercial strategy in terms of either customer’s selection or moral hazard reduction). To note, these four variables have also been cross sectioned in order to detect some sort of scope economies likely to help explain TE. In fact, most of these variables have been frequently applied in the empirical literature for the sake of explaining insurance companies’ efficiency, mainly, Cummins and Weiss. (2000), Mahlberg and Url (2003), Yao and al (2007), Barros and al (2010). Noteworthy, however, none of these studies has undertaken the decomposition of TE into both controlled and non-controlled effects.
In addition, an error term εit has been introduced so that any possible errors can be accounted for, since the endogenous variable in the model is estimated and not observed. The estimation results are depicted in table 2 below.
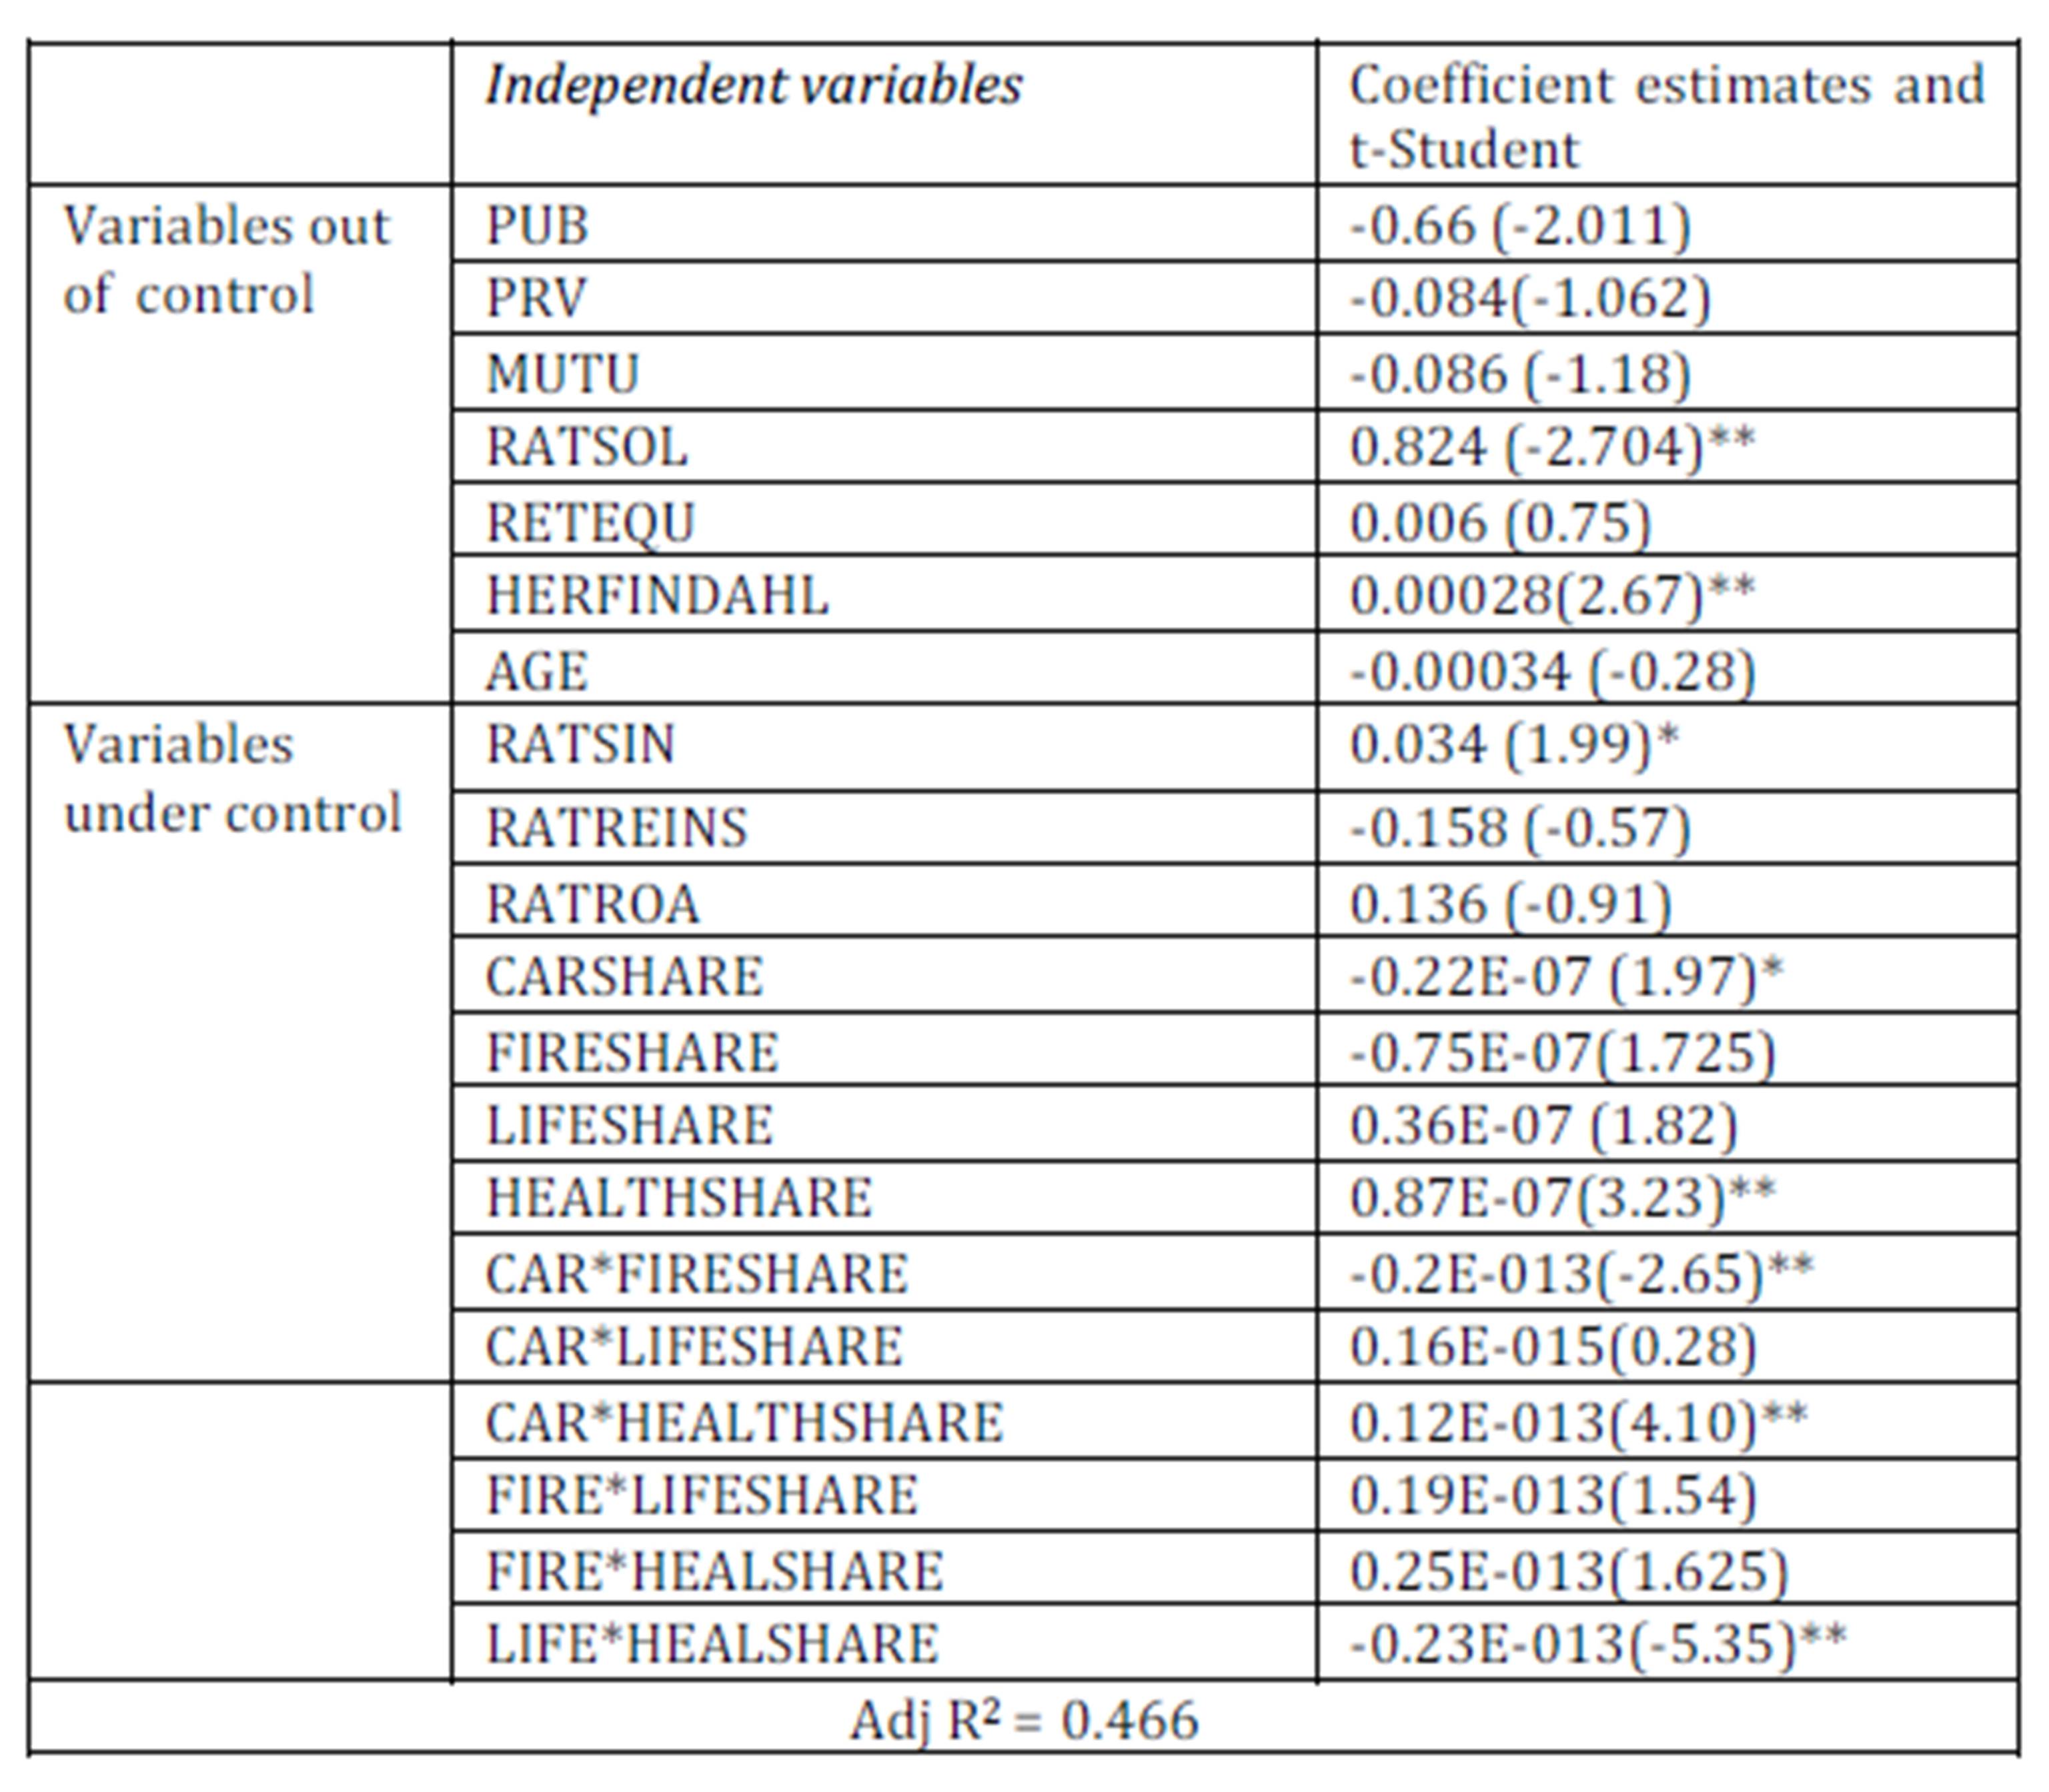
Worth noting, the concentration index, HERFINDAHL, is positive and significant. In fact, a negative coefficient has been expected, since a less concentrated market means more competition which would increase the companies’ TE. In our case, a positive coefficient would indicate that a more concentrated market helps further enhance companies’ TE should they enjoy some market power. As for the AGE variable, it is not significant suggesting that new companies’ introduction should not represent a disadvantage in terms of TE with respect to already operating firms.
Table 2: Inefficiency components
**, * Significantly different from zero at the thresholds of 1% and 5% respectively.
On a first examination of the variables outside company control, just very few among them seem to be significant. The dummy variables’ associated coefficients: public, mutual and private statues are not statistically significant, denoting that ownership structure, public versus private or mutual, has no impact on technical efficiency. Yet, the equity ratio RATEQU turns out to be positive and significant, while the solvency ratio RATSOL proves to be positive and non-significant. In effect, the Tunisian regulating authority imposes a fixed threshold of solvency ratio (20%) for the sake of protecting the insured against any potential claims.
Several under-company control variables turn out to be significant. RATSIN is positive and significant, highlighting that an improvement in claims payment by companies would remarkably result in a remarkable increase in efficiency. Concerning, the reinsurance RATREINS and profitability RATROA ratios, they appear to be non-significant. Besides, the majority of variables describing the TE relevant output composition prove to be significant (at both 5% and 10% levels). The motor premium to total premium has had a negative impact on TE. This result might well be justified by the motor premium decreased level due to low prices’ level. As a matter of fact, the motor premium amount is fixed by the concerned authorities, thus making premiums increase without any consideration of cost increases.
Nevertheless, other studies have indicated that the motor premium prices are regulated, engendering several companies’ deficit (Jouini (2003)). The fire premiums’ share has had a negative impact on these companies TE, owing mainly to the same cited reasons. In regard to life and health premium products, ratios have been discovered to have a significantly positive effect on firms’ TE. This result suggests that the Tunisian insurance companies need to develop these two products for an effective improvement of their TE. This result corroborates some specialists’ findings, worth mentioning among them are Jouini (1999) and Vittas (1996) who have focused on the low level of life insurance in Tunisia, as a major cause of their inefficiency.
Coelli et al. (1999) have proposed a method whereby TE adjusted-measure can be assessed specially for the case in which companies operate within a different environment. This methodology sounds very interesting with regard to our study case, in so far as our proper explanatory variables are decomposed into three blocks. Hence, it would seem interesting to re-evaluate the efficiency scores of the most inefficient companies on applying the most efficient companies’ favourable variables under control, or when operating in the convenient and profitable environment. In this respect, and as indicated on table 2, CARSHARE, FIRESHARE etc. appear to be the variables that represent the firms’ commercial strategy in terms of customer selection. So, the most efficient of these companies are expected to be applying the best choice. Consequently, it will be interesting for the inefficient companies to re-evaluate their TE by adjusting these controlled variables with reference to the sample’s most efficient companies.
As such a measure might well sound to be sensitive to any particular firm, a more flexible adjusted measure has been considered with respect to the first quartile of the sample’s most efficient companies. Coelli et al. (1999) consider that the variables retained to explain inefficiency variation do affect the random variable truncated distribution mean standing for technical inefficiency in the frontier specification. Their method has been adapted to our study case in the following way:
– The Tunisian insurance industry technology is represented via a translog stochastic model, in which the inefficiency terms uit are referred to by a truncated normal model with a mean  , where X1it and X2it designate both variables’ blocks defined earlier, while Z‘it designates all the other variables. These variables have been defined earlier.
– The frontier parameters are estimated via maximum likelihood method, while the individual TE scores are obtained via conditional method.
– The truncated distribution mean estimate is already decomposed into two parts: , which represent the environment stemming variables’ contribution, and
  , which denotes the controlled variables’ effect as derived by companies. To adjust the TE measure, the first quartile of , noted q1(), is taken for the outside-company control variables’ block. Yet, once the measure is considered by adjusting the first quartile of , noted
q1(), an adjusted measure for controlled effects will be achieved.
– The efficiency scores are then recalculated for the most inefficient companies via conditional method after adjusting the truncated distribution mean value by  . Afterwards, inefficiency is adjusted to the most favourable environment and
 to the most favourable variables under companies’ control.
Thus, comparing TE adjusted and unadjusted levels by separating both controlled and uncontrolled variables would be of great interest in so far as economic policy is concerned. Such a procedure would help indicate the extent to which inefficiency might be promoted. Should TE adjusted controlled variable be more important than the environmental adjusted measure, this would mean that most of insurance industry attached inefficiency turns out to be inherent within the companies themselves. Inversely, however, it would turn out to be rather related to the regulator.
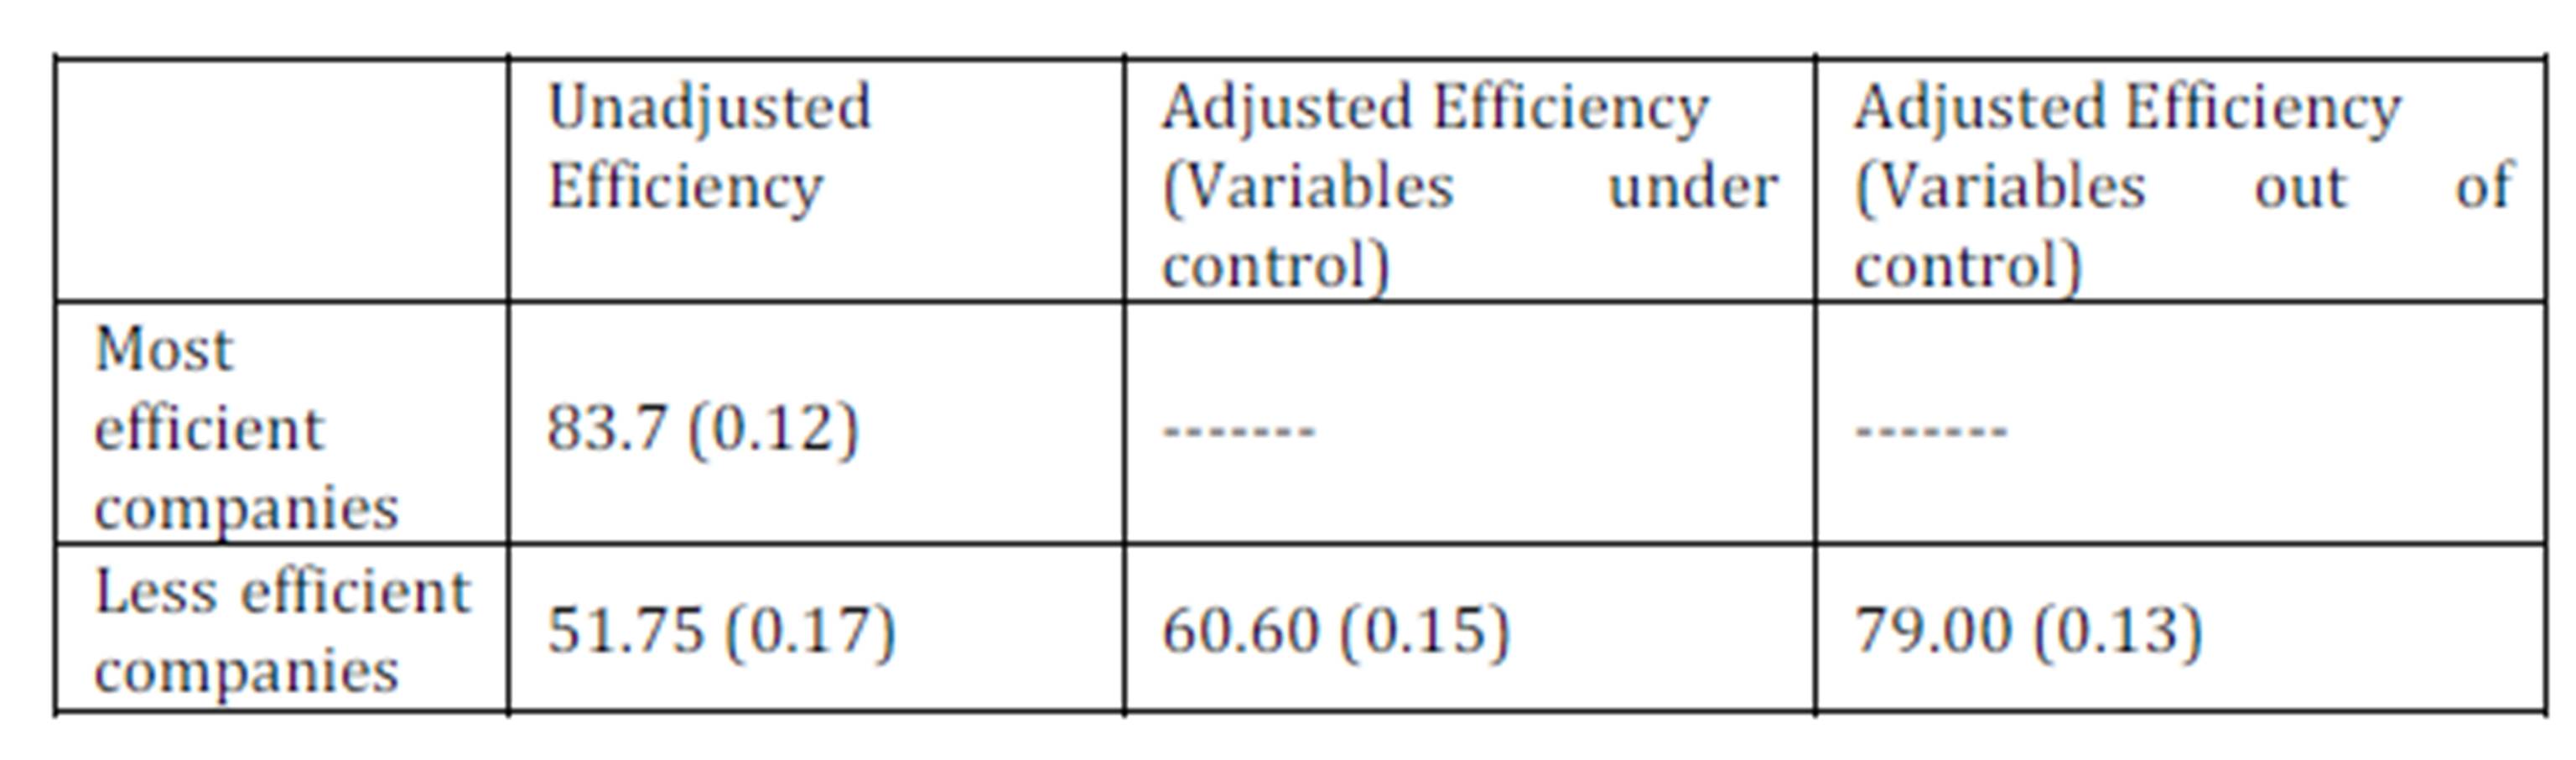
Table 3 below illustrates the efficiency scores estimates reached before and after the controlled and uncontrolled variables’ adjustment.
Table 3: Technical efficiency adjusted for controlled variables
As can be noted, these results reveal that the most inefficient companies exhibit an inefficient score of a rate of 51.75% should they adjust by adopting the strategy proper to the sample’s most efficient companies. The latter’s estimated TE would reach 60.60%, thus, their relevant TE would be increased by roughly 9%. Still, their adjustment efficiency score within the most favorable environment would be 79%. This finding highlights that the most inefficient companies’ TE would increase much more by a proportion of no less than 27% in average through variables lying out of the companies’ control. In fact, any effort made by the regulator to relax the companies’ ownership status, solvency ratio or equity ratio would certainly help this industry improve its productivity.
Conclusion
The present study falls under the pioneering original evaluative studies dedicated to investigating the technical efficiency of the Tunisian insurance industry. It is, actually, focused on estimating technical efficiency relevant to this industry by means of panel data. In this regard, two proposed efficiency trend-analysis models have been compared within a temporal panel data framework, namely, the parametric and non-parametric DEA window. The latter do not entail imposing any functional form for the TE component evolution over time. Based on the non-parametric model, it has been demonstrated that technical efficiency is time-variant and every company has its own technical efficiency evolution over time. This finding seems to be robust enough if one considers a parametric frontier evaluation of the windows. Accordingly, this particular model turns out to yield a result that corresponds greatly with the non-parametric one.
In addition, the model has also been regressed in order to analyze and interpret the achieved technical efficiency scores. In this respect, two variable blocks have been proposed, the first of which presents variables under full company control, and the second which are much under the regulators control. Finally, a TE adjustment measure relevant to the most inefficient companies has been put forward. Actually, it has been discovered that such firms are liable to improve their TE by almost 10% should they be in position to pursue the managerial strategy applied by the most efficient companies in the sample. This result underlines the fact that for the sake of modernizing this industry, a greater proportion of efforts to be made lie in the regulators’ hands. Ultimately, this work is liable to be extended in several ways.
First, it would be interesting to extend the “window parametric” model proposed in order to estimate the Malmquist index and to decompose the productivity changes in this industry. Second, one may use models which are based on a parametric specification of the production frontier to estimate TE, as, the Cornwell, Schmidt and Sickles (1990), Battese and Coelli (1992), Lee and Schmidt (1993), etc. Finally, should sufficient information be provided concerning input prices or outputs price, one would be able to estimate cost efficiency and profit efficiency.
Notes
1The length of the window is 3 years.
2For each window, we should get p different TE scores, since each single DMU related window successive observation is considered as if the DMUs are different.
3There is a controversy in the empirical literature on whether the output produced by the insurance companies should better be measured by premiums or claims. In Tunisia, most of the companies reimburse claims to costumers with long delays. So, the inputs used each year do not reflect the amount of claims of that year. For this reason the estimates of the production function were not all significant when we defined output by the amount of claims.
4We use the deterministic specification in order to have the specification which is closer/the closest to the DEA model specification.
References
1. Banker, R. D. and Natarajan, R., (2008). ‘Evaluating contextual variables affecting productivity using data envelopment analysis‘. Operations Research, 56(1), 48—58.
Publisher – Google Scholar
2. Barros, C. P. and Barroso, N., (2005). ‘Evaluating the efficiency and productivity of insurance companies with a Malmquist index: A case study for Portugal‘. Geneva Papers on Insurance: Issues and Practice , 30(2), 244—267.
Publisher – Google Scholar
3. Barros, C. P., Nektarios, M. and Assaf, A., (2010). ‘Efficiency in the Greek insurance industry‘. European Journal of Operational Research, 205, 431—436.
Publisher – Google Scholar
4. Battese, G. and Coelli, T., (1988). ‘Prediction of Firm-Level Technical Efficiency with a Generalized Frontier Production Function and Panel Data‘. Journal of Econometrics, 38, 387-399.
Publisher – Google Scholar
5. Berger, A. N., Cummins, J. D. and Weiss, A., (1997). ‘The coexistence of Multiple Distribution Systems for Financial Services: The case of property-Liability Insurance‘. Journal of Business, 70, 515-546.
Publisher – Google Scholar
6. Berger, A. N., Cummins, J. D., Weiss, A. and Zi, (1999). ‘Conglomeration versus strategic focus : Evidence from the insurance industry’. The Wharton School, University of Pennsylvania, WP 99-29-B: s.n.
7. Coelli, T., Perelman, S. and Romano, E., (1999). ‘Accounting for environmental influences in stochastic frontier models: with application to international airlines‘. Journal of Productivity Analysis, 11, 251-273.
Publisher – Google Scholar
8. Cummins, J. D. and Hongmin, Z., (1998). ‘Measuring Economic Efficiency of The US Life Insurance Industry: Econometric and Mathematical Programming Techniques’. Journal of Productivity Analysis, 10, 131-152.
9. Cummins, J. D. and Misas, M. R., (2001). ‘Deregulation, Consolidation, and Efficiency: Evidence from the Spanish Insurance Industry’. Working paper, Wharton Financial Institutions Center, Philadelphia.
Google Scholar
10. Cummins, J. D., Tennyson, S. & Weiss, M., (1999). ‘Consolidation and Efficiency in the U.S. Life Insurance Industry’. Journal of Banking and Finance, 23, 325-357.
Publisher – Google Scholar
11. Cummins, J. D. and Weiss, M., (1998). ‘Analysing firm performance in the insurance industry using frontier efficiency methods’. Working paper, The Wharton School.
Google Scholar
12. Cummins, J. D. and Weiss, M. A., (1993). ‘Measuring Cost Efficiency in the Property-Liability Insurance Industry‘. Journal of Banking and Finance, 17, 463-81.
Publisher – Google Scholar
13. Cummins, J. D. and Weiss, M. A., (2000). ‘Analyzing Firm Performance in the Insurance Industry Using Frontier Efficiency Methods’. In: Dionne, G., ed., Handbook of Insurance Economics. Kluwer Academic Publishers, Boston, MA.
14. Doherty, N. A., (1981). ‘The Measurement of Output and Economies of Scale in Property-Liability Insurance‘. Journal of Risk and Insurance, 48, 391-402.
Publisher – Google Scholar
15. Ennsfellner, C., Lewis, D. and Anderson, I., (2004). ‘Production efficiency in the Australian insurance’. The Journal of Risk and Insurance, 71(1), 135—159.
16. Farrell, M. J., (1957). ‘The Measurment of Productive Efficiency‘. Journal of The Royal Statistical Society, 120, 253-281.
Publisher – Google Scholar
17. Fecher, F., Kessler, D., Perelman, S. and Pestieau, P., (1993). ‘Productive Performance of The French Industry‘. Journal of Productivity Analysis, 4, 77-93.
Publisher – Google Scholar
18. Gardner, L. and Grace, M., (1993). ‘X-Efficiency in the US Life Insurance Industry‘. Journal of Banking and Finance, 17, 497-510.
Publisher – Google Scholar
19. Hornstein, A. and Prescott, E. C., (1991). ‘Measures of the Insurance Sector Output’. Geneva Papers on Risk and Insurance, 16, 191-206.
Google Scholar
20. Johnson, A. L. and Kuosmanen, T., (2011). ‘One-stage estimation of the effects of operational conditions and practices on productive performance: asymptotically normal and efficient, root-n consistent StoNEZD method‘. Journal of Productivity Analysis, 36(2), 219—230.
Publisher – Google Scholar
21. Kuosmanen, T. and Johnson, A. L., (2010). ‘Data envelopment analysis as nonparametric least squares regression‘. Operations Research, 58(1), 149—160.
Publisher – Google Scholar
22. Mahlberg, B. and Thomas, U., (2000). ‘The Transition to the Single Market in the German Insurance Industry’. Working Paper, Vienna University of Economics and Business Administration, Vienna, Austria.
Google Scholar
23. Mahlberg, B. and Url, T., (2003). ‘The effects of the single market on the Austrian insurance industry‘. Empirical Economics, 28, 813—838.
Publisher – Google Scholar
24. Schmidt, P. and Sickles, R. C., (1984). ‘Production frontiers and panel data’. Journal of Business and Economic Statistics, 2, 367-374.
Google Scholar
25. Seiford, L. M. and Thrall, R. M., (1990). ‘Recent Developpments in DEA: The Mathematical Programming Approach to Frontier Analysis‘. Journal of Econometrics, 46, 7-38.
Publisher – Google Scholar
26. Simar, L. and Wilson, P. W., (2011). ‘Two-stage DEA: caveat emptor‘. Journal of Productivity Analysis, 36(2), 205—218.
Publisher – Google Scholar
27. Vittas, D., (1996). ‘Tunisian Insurance Sector’. The World Bank, policy Research Working Paper, WPS 1451.
28. Wang, H. J. and Schmidt, P., (2002). ‘One-step and two-step estimation of the effects of exogenous variables on technical efficiency levels‘. Journal of Productivity Analysis, 18(2), 129—144.
Publisher – Google Scholar
29. Yao, S., Han, Z. and Feng, G., (2007). ‘On the Technical Efficiency of China’s Insurance Industry After WTO Accession‘. China Economic Review, 18(1), 66—86.
Publisher – Google Scholar
30. Yengert, A., (1993). ‘The Measurment of Efficiency in Life Insurance: Estimates of a Mixed Normal-Gamma Error Model‘. Journal of Banking and Finance, 17, 483-496.
Publisher – Google Scholar
Appendix

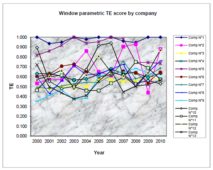
Figure 1: The evolution of TE scores via the DEA window and the DEA
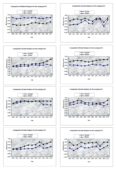
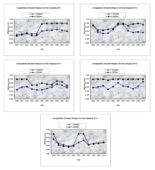
Figure 2: The time variability of TE per company