Introduction
In the context of a global economy, tax systems play a decisive role in the mobility of production factors. Thus, the importance of labour tax reform in the integrated economic systems, like the European Union, is given by the fact that in recent years the European labour market faced high unemployment rates, despite the high priority given to this issue by the European Commission and national governments. In these circumstances, one widely recommended measure in the E.U. is to improve labour taxation, especially as the European Union is still an area of high tax burden on labour compared to other developed economies.
According to the Europe 2020 Strategy (2010) if taxes were to rise, it should be done in conjunction with making the tax systems more “growth-friendly”. Thus, raising taxes on labour should be avoided, since the past experience indicated that raising taxes occurred in the past at great costs to jobs. Therefore, in the current context of tight fiscal policies, the E.U. recommendations emphasise the need to continue shifting taxation away from labour to other sources of taxation as a way to support job creation.
Therefore, the problematic of taxation requires special attention and rigorous research. Based on these arguments we focused our study on determining the effects of labour tax variation on the E.U. labour market during the period 2000-2012. We draw on fixed effects panel data estimation in order to model the robust dependencies between labour taxes and the main labour market outcomes, such as employment and earnings in the E.U.
The structure of the paper is the following. The literature review is presented in section 2, while section 3 is dedicated to a descriptive analysis of the main macroeconomic indicators. The results of the econometric analysis are presented in section 4, while the conclusions are presented in section 5.
Literature Review
In the last EU report on tax reforms – Tax Reforms in EU Member States in 20141– it is mentioned that in most Member States taxes on the labour market continue to be quite high, especially to the detriment of the low-paid people or other vulnerable groups, contributing to their long-term exclusion from the labour market and in many cases, causing social inequity. High taxes on labour force can reduce incentives for low-skilled workers, and especially for employers, and thus reducing the income tax and social security contributions leads to a potential increase in both supply and labour demand, which implies a higher employment rate and a more efficient use of labour.
A reduction in labour taxation without any compensation for the loss of the budget income is not a feasible option for any country. Therefore, it is recommended that the reduction of taxes on the labour market be compensated by tax increases in areas that affect less the economic growth (consumption tax on immovable property, pollution) or by a reduction in public spending.
Lately, in most Member States, the tendency to increase labour taxation has focused on people with higher incomes through surcharging the higher income, tax credit restrictions and/or cutting tax exemptions. This indicates that the tax reforms on the labour market have tried, wherever possible, not to be achieved at the expense of those with a low income even when the fiscal sphere is limited (Alexandru (Davidescu), 2014).
Moreover, there has been a widely accepted belief that when considering the labour tax effects on employment, certain labour market institutions, including high taxation and generous benefits, can lead to low employment or high unemployment. For instance, Behar (2009) made a comparative analysis of tax wedges, unemployment benefits and employment for the case of the Central and Eastern European countries (the 10 newest E.U. members as of 2007, excluding Cyprus and Malta) and found statistically significant differences in the medians of unemployment benefits and the labour market outcomes of the less productive workers, but insignificant differences in prime-age outcomes and tax wedges. Within the new members, the non-parametric analysis suggested a weak dependency between tax wedges and the duration of benefits associated with poor labour market outcomes.
In another study, Koskela (2001) discussed the relationship between labour taxation and employment through a union bargaining framework, where the wage rate is negotiated between the representatives of employees and employers and firms unilaterally determine employment. The main findings suggested that in imperfectly competitive labour markets, higher labour taxes — income and payroll taxes — will increase labour costs and have negative effects on employment, while tax progression tends to moderate wages and boost employment.
Moreover, if labour tax bases are unequal due to tax exemptions, the structure of labour taxation matters so that the tax wedge may not be a sufficient statistic to describe the channel of influence of labour taxation (Lazar, 2014). Finally, distortionary effects of labour taxes in more corporatist economies should be smaller than in economies with more decentralised wage bargaining.
Onaran et al.(2010) analysed the effects of globalization on implicit tax rates on labour income, capital income and consumption in the EU15 and Central and Eastern European new member states. For the EU15 case, they found a positive effect of globalization on the implicit tax rates on labour income, but no effect on implicit tax rates on capital income and also a negative effect of globalization on implicit tax rates on consumption.
However, when considering the case of Central and Eastern European new member states, there was no effect of globalization on any of the three implicit tax rates.
Moreover, they checked for differences among the welfare regimes within the EU15 and found that globalization has a particularly strong effect in the social democratic regime on all implicit tax rates. Globalization has a statistically significant negative effect on the implicit tax rates on capital income in the social-democratic and southern regimes, a marginally significant negative effect in the liberal regime and no significant effect in the conservative regime. Regarding the implicit tax rates on consumption, there is a significant negative effect of globalization in the social-democratic, conservative and liberal regimes. In the case of the implicit tax rates on labour income, globalization causes an increase in all four welfare regimes.
Based on the international literature and the empirical studies in the field, we decided to quantify the impact of labour taxes upon employment for the European Union case. Since our approach consisted of a multifactorial econometric analysis, several other macroeconomic factors were also included in the study, such as: gross domestic product (GDP), foreign direct investments (FDI), trade openness and inflation rate.
When referring to the GDP, the economic theory suggests that it is an indicator of economic well-being and the empirical studies confirm that a positive and significant impact upon employment is normally to be expected (Seyfried, 2011; Andreica, et al. 2011; Padalino and Vivarelli, 1997; Boltho and Glyn, 1995).
However, according to the empirical findings, the contemporary impact of prices upon employment rate fluctuations should normally be negative, as inflation leads to an increase of labour costs and therefore a reduction of employment (Andreica et al., 2010).
Moreover, in contemporary economic policy the impact of globalization upon labour market outcomes plays a significant role and cannot therefore be neglected from the analysis (Dimian et al., 2013). Although it is considered as a threat by workers in developing countries, employment growth generated by globalization is seen as a major contribution to reducing poverty (Jenkins, 2006). Work, taken as a whole, is affected by globalization in a variety of ways, such as through foreign direct investment, increased openness to trade or international transfer of technology.
Even though foreign direct investments inflows are without doubt appreciated as a stimulating factor to employment growth in a healthy economic environment as it may bring capital, technology, management know-how, jobs and access to new markets (Vasilescu et al., 2011; Driffield and Girma, 2003; Zhao, 1998), the empirical findings concerning the benefits of trade openness upon labour market outcomes are diverse. For instance, in the long run the effect of trade on employment should be positive since trade openness is seen as an important lever for the developing countries to get out of poverty. However, in the short run adverse effects may be expected (due to frictional unemployment, which is associated with the reallocation of workers across sectors). According to the European Commission study (2010), trade openness creates more jobs than it destroys, especially in the cases of developing countries with low income levels.
For example, the effects of trade on employment in India were examined by Sen (2008) using several methods upon data on manufacturing industry for the period 1975-1999. His main findings were that the impact of trade on employment in the manufacturing sector is minimal. On the other hand, the results of Jayanthakumaran (2006) when studying the effects of trade on labour market outcomes in Australia showed that the impact of earnings is significant and positive in the manufacturing industry, while the technologic index has a negative impact. The influence of the effective rate of protection has a positive and significant effect, while trade openness is negatively correlated with employment. Marginal intra-industry trade is positive, but statistically insignificant.
Taking this into consideration, the paper will focus on modelling the impact of labour taxation along with other macroeconomic indicators upon employment and earnings for the case of the 27 E.U. countries for the period 2000- 2012.
Data Description
In this paper, we used annual data for 27 European countries (excepting Croatia, for lack of data on all variables), for the period 2000-2012. Thus, we analysed the employment rate (employ) and net earnings (earn) in relation to the taxes on labour (tax), the gross domestic product (gdp), the foreign direct investment (fdi), the trade openness (trade) and the inflation rate (ir). The employment rate is expressed in percentage for the 15-64 age group. The foreign direct investment is the inward FDI stock as the percentage of GDP, while the GDP is expressed as index (with 2005=100) for the econometric analysis, but in euro per inhabitant (prices of 2005) for the statistical analysis. The taxes on labour are expressed as percentage of all taxes. The sources of the data were the Eurostat Database and the UNCTAD database.
Over the time (2000-2012), the employment rate in the European Union countries did not increase very much (the annual growth rate was over 1% only for Bulgaria). Unfortunately, there are some countries that registered small reductions in the employment rate: Cyprus, Denmark, Greece, Ireland, Portugal, Romania, Spain and United Kingdom (less than 1% per year).
Regarding the target set for the employment rate for the 20-64 age group, there are four countries that are pretty far from it, although there is enough time to recover the “distance”: Greece (16.8 percentage points below), Spain (15.4 pp), Bulgaria (12.5 pp) and Hungary (11.8 pp). On the other hand, Germany recorded in 2013 a rate of 77.1%, while its target for 2020 is 77%.
With respect to labour taxation, considering the taxes as % of total taxes, in almost half of the member states the taxes on labour decreased in the period 2000-2012. The greatest reduction was registered in Bulgaria (11.4 percentage points), while the greatest increase was recorded for Greece (6.8 pp). For 2012, the differences in levels across the Union are quite marked: the labour taxation ranges from 32.9% in Bulgaria to 58.6% in Sweden and it is worth mentioning that the taxes are higher among the older member states.
One can observe that in countries with large employment rates, the labour taxation is also high (figure 1) and a group of four countries stands out: Netherlands, Sweden, Deutschland and Austria. Another group (United Kingdom, Luxembourg and Cyprus) can be observed in the upper-left side of the figure, with high employment rates, but relatively low taxes on labour.
If we consider the entire period under investigation, 16 of the member states registered their maximum in 2012, two of them in 2011 and five in 2008, while the minimum value was mostly registered in 2009 (ten countries) and in 2003 (eight countries).
Econometric Analysis
Based on the macroeconomic data set for the period 2000 — 2012, we decided to model the dependencies between labour taxes, GDP, FDI, trade openness and inflation rate upon employment for the case of the 27 E.U. countries, by using panel data estimation.
First, the Hausman test was applied, in order to determine whether a fixed-effects model (FE) is more appropriate than a random-effects model (RE) (see Baum, 2001; Wooldridge, 2002). The results indicated that we are dealing with a FE model, where the individual effects are correlated with the explanatory variables.
Further on, we checked if the standard errors are independent and identically distributed, homoskedastic and not autocorrelated (Cameron and Trivedi, 2009), by applying both a modified Wald test for group wise heteroskedasticity proposed by Baum (2001) and a serial correlation test proposed by Drukker (2003).
The results indicated that the errors were both autocorrelated and heteroskedastic and in order to overcome these problems, we had to use the robust fixed-effects (within) technique, based on Driscoll and Kraay standard errors (Hoechle, 2007).
The robust fixed-effects employment equation for the 27 EU countries is presented below.
employ = 61.86 — 0.164*tax + 0.018*fdi +0.175*gdp — 0.012*trade — 0.072*ir
(25.2)*** (-2.9) *** (4.3)*** (10.0)*** (-4.2)*** (-7.7)***
where between brackets are the t statistics, and *** stands for a 1% significance level.
The econometric equation of employment is a classic one in terms of the coefficient signs and even of the intensity of the determinant factors. Thus, the GDP has the greatest influence (coefficient 0.175), confirming the economic theory on the direct link between the macroeconomic output and the level of employment (a reverse form of this relationship is given by Okun’s Law). The FDI flows have also a positive influence on employment, but at a more moderate level (coefficient 0.018) both because of the global economic crisis period and the fact that the domestic factors are primordial in supporting employment in each country. It is also possible that the new production capacity resulted from the FDI saves labour force through modern technological contribution, but also creates some new employment opportunities in collateral economic activities and/or situated upstream/downstream on the production chain.
Regarding the factors with a negative influence, the labour taxation stands out (coefficient -0.164), which illustrates a normal demand curve (the inverse relationship between the price of work and the quantity required), but also a disruptive effect of labour taxation on the balance between the demand and supply. The fact that the coefficient is very close to the corresponding coefficient of the GDP shows how sensitive the labour demand is to changes in the taxes. Another interesting thing is the negative influence (very low coefficient -0.012) of the degree of openness of the economy to foreign trade, showing the high level of competition on the single market of the E.U. It is possible that the negative sign of this coefficient is caused by the countries that have less, or could even lose in the intra-community trade. Regarding the negative impact of inflation on employment (coefficient -0.072), we are dealing with a Philips curve relationship, signalling that even a moderate inflation can negatively affect the macroeconomic situation and hence the employment of the workforce.
The wage equation shows that the most important factor that supports the growth of the earnings is the tertiary education (coefficient 2.2), confirming the high price of high-skilled labour and of course promoting the Knowledge Economy (as the high-skilled labour force is more expensive). It is interesting to notice the influence of the CPI (+1.02 coefficient) which signals inflationary pressures generated by wages (an increase of one percent of the CPI leads to an increase of 1.02% for wages, so a little more). Moreover, the CPI corresponding coefficient exceeds that of the GDP (0.76), showing a possible asymmetry in the distribution of the macroeconomic outcome since the increasing adjustments of wages for inflation are higher than those caused by the GDP growth.
earnings = 5.38 — 0.0105*implicit_tax + 0.022*educ + 0.00032*fdi + 0.0076*gdp — 0.00060*trade + 0.0102*ir
(44.7)*** (4.09)*** (1.78)* (1.99)* (11.47)*** (-2.05)** (18.4)***
where between brackets are the t statistics, and *,**, *** stands for a 10%, 5% and respectively 1% significance level.
Regarding the positive and consistent influence of the GDP dynamics on earnings (coefficient 0.75), it confirms the predictions of economics on the correlation between the macroeconomic outcome and the remuneration of the production factors. The FDI impact on wages is interesting in terms of the positive sign of the coefficient attached (+ 0.032) and less in terms of its size. Thus, we can say that the FDI flows save labour force, especially by substituting the lower-skilled workers with the highly-skilled ones.
The negative influence of the implicit labour taxation rate is normal since it shows the share of all taxes on labour, in total labour remuneration. Thus, the more these taxes and contributions are increased, the more the net income is reduced (the value of the coefficient is significant – 1.05). The impact of trade openness indicates a negative influence on wages (-0.06). In other words, competition in the European Single Market reduces both wages and employment. In fact, either the Asian competition should not be neglected (eg. textiles and clothing industry in the E.U.).
Conclusions
In this study, we analysed the impact of labour taxation on both employment and earnings in the European Union. We employed annual data for the period 2000-2012 and in addition to labour taxation we also used as explanatory variables the following indicators: the gross domestic product, the trade openness, the foreign direct investment and the inflation rate.
The analysis first started with a descriptive analysis of the macroeconomic indicators. We discovered that during the period under investigation the employment rate in the European Union countries did not vary too much. The labour taxation (as % of total taxes) decreased in almost half of the member states (the largest reduction was of 11.4 percentage points in Bulgaria and the largest increase was of 6.8 pp for Greece). An interesting aspect of the taxes on labour in the European Union is that the differences in levels across the Union are quite pronounced: they range from 32.9% in Bulgaria to 58.6% in Sweden. Also, in countries with large employment rates, the labour taxation is also high, a group of four countries standing out (Netherlands, Sweden, Deutschland and Austria). United Kingdom, Luxembourg and Cyprus on the other hand have high employment rates, but relatively low taxes on labour.
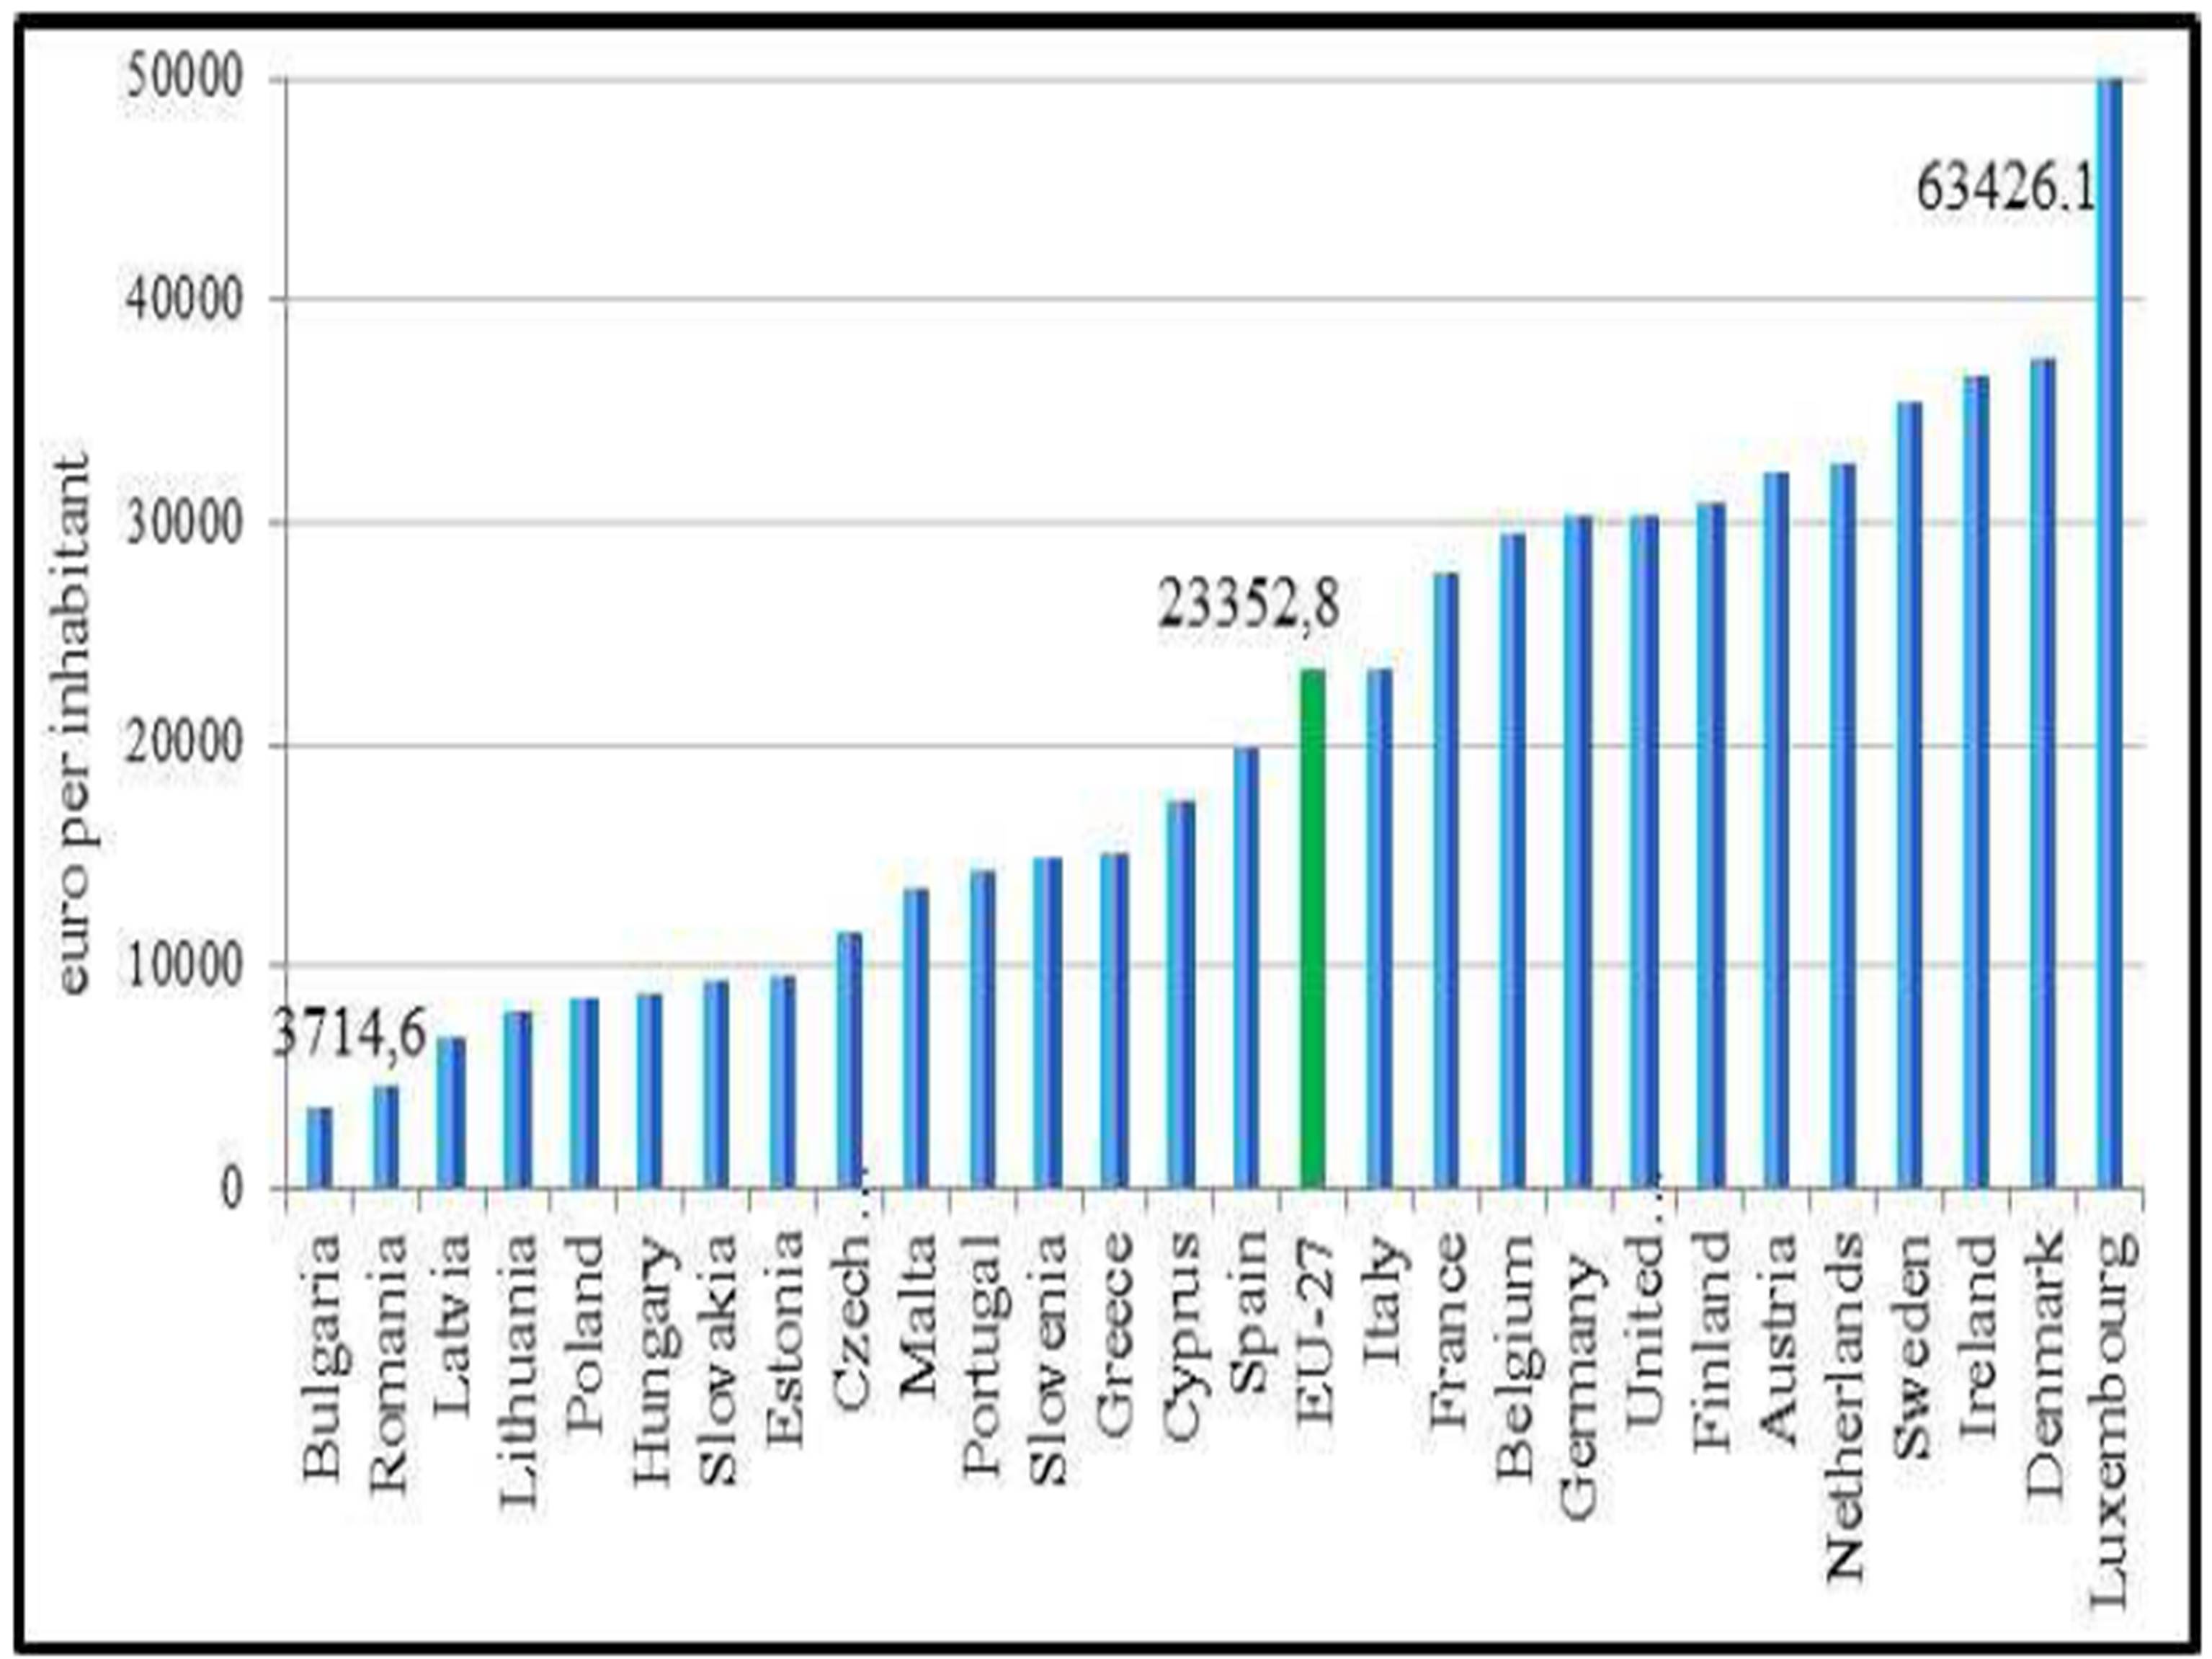
Regarding the gross domestic product, its distribution across the E.U. member states is quite noteworthy. The largest gross domestic product in the European Union for the year 2012 was registered in Germany, but Luxembourg is by far the leading country regarding the GDP per capita.
In 2012, the monthly earnings were the smallest in Romania (fewer than 100 euros) and Bulgaria (with less than 200 euros). By contrast, the workers in Luxembourg and Sweden have the highest average earnings, more than 2300 euro in 2012. In the period 2000-2012, the highest increases (in real terms) were recorded in Sweden, Finland and Denmark (588€, 494€ and 337€ respectively), while the smallest increases were observed in Spain (7€) and Italy (14€). There are also 3 countries that paid less (in real terms) in 2012, than in 2000: Romania (-13€), Ireland (-66€) and United Kingdom (-433€).
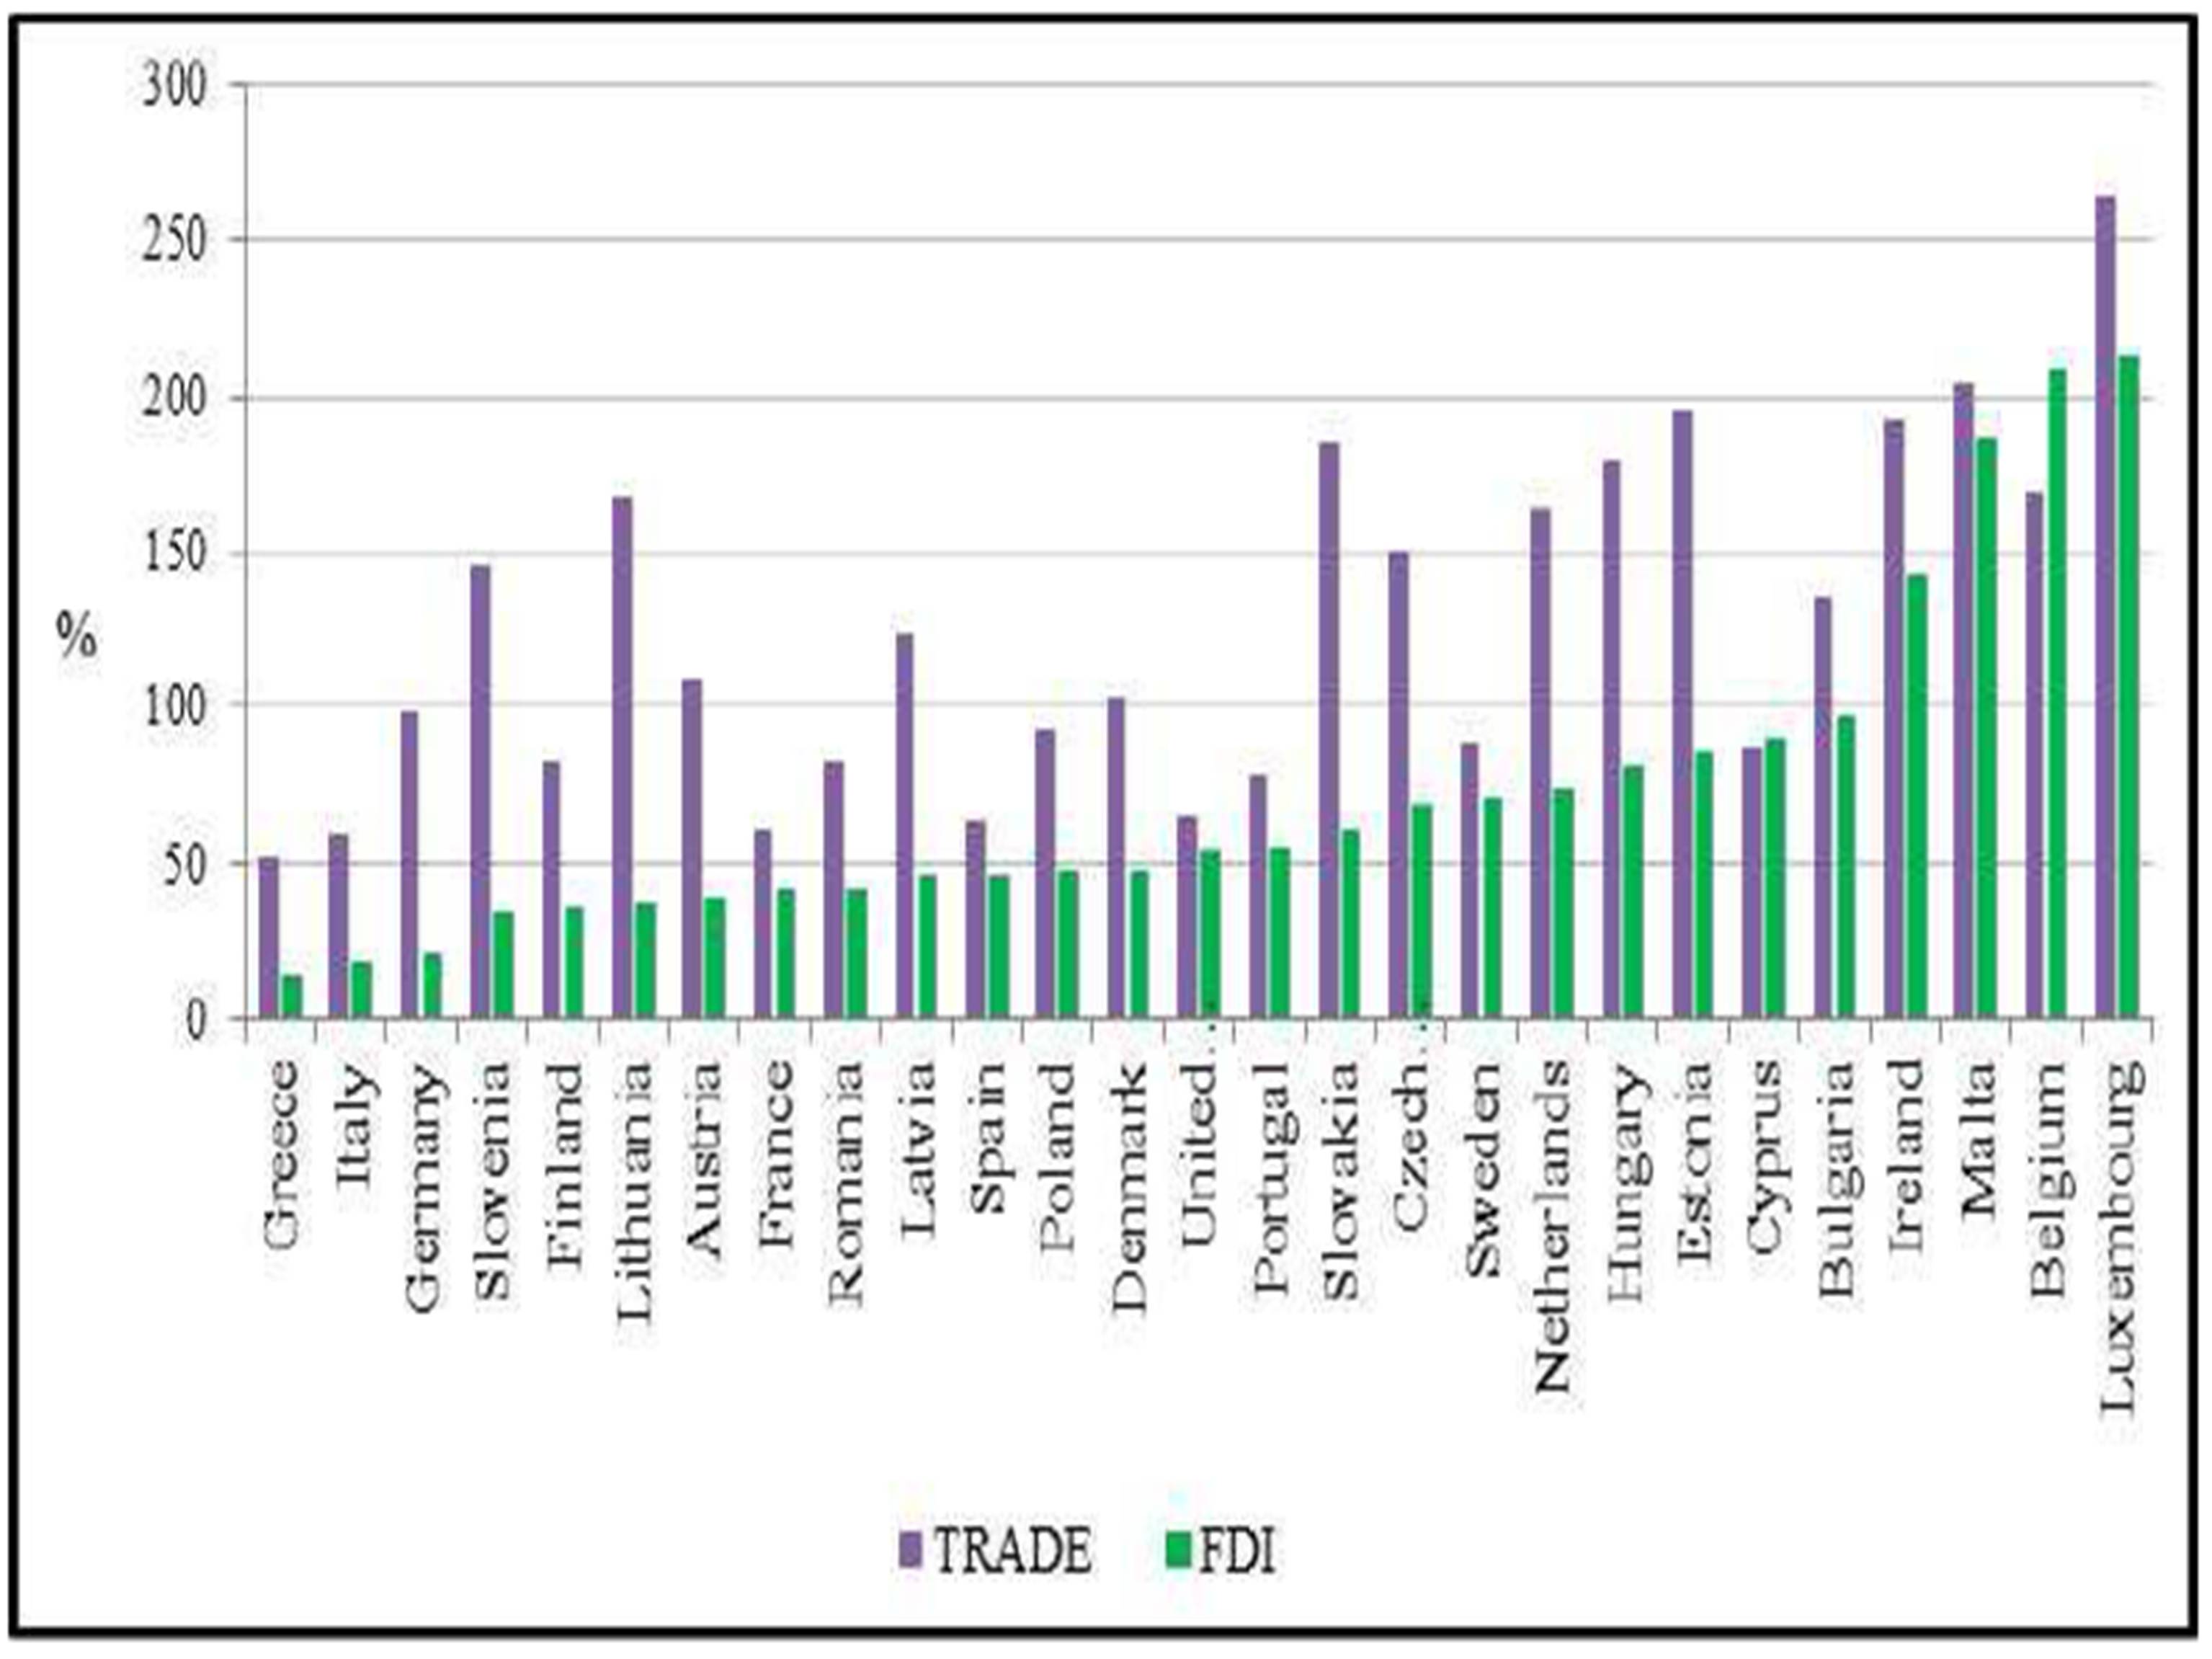
In terms of foreign direct investment for the year 2012, the countries in European Union are quite scattered: on one side there are the countries that attract a very large share of FDI (Luxembourg, Belgium, Malta, Ireland) with ratios over 100% of GDP, and on the other side, we find Greece, Italy or even Germany, with less than 25% of GDP. As for the trade openness, although Luxembourg is again the leader, the countries may be split in two: those with ratios above 100% of GDP (15 countries) and those under 100% (12 countries).
The econometric analysis was based on panel data estimation. For both models, we decided to estimate a fixed effects model, with robust standard coefficients. When the employment rate is considered the dependent variable, the greatest positive influence is that of the GDP, confirming the economic theory on the direct link between the macroeconomic output and the level of employment. The FDI flows have also a positive influence on employment. Regarding the negative influence upon employment, the labour taxation stands out, illustrating a normal demand curve, but also a disruptive effect of labour taxation on the demand and supply equilibrium. The trade openness has also a negative influence, showing the high level of competition on the single market of the E.U. The negative impact of inflation on employment signals that even a moderate inflation can negatively affect the macroeconomic situation and hence the employment of the workforce.
For the second model, when the earnings are considered the dependent variable, the most important factor that supports its growth is the tertiary education, confirming the high price of high-skilled labour. The influence of the CPI signals inflationary pressures generated by wages and considering that the CPI impact exceeds that of the GDP, it may be possible to exist an asymmetry in the distribution of the macroeconomic outcome. The influence of the implicit labour taxation rate is normal, so the more these taxes and contributions are increased, the more the net income is reduced.
This study brings an insight upon the influence of labour taxation in Europe. Although it can be extended by considering other macroeconomic indicators, and also by building what-if scenarios, we consider this paper to be of great value for the research in the field.
Acknowledgements
This work was supported by the European Social Fund through Sectorial Operational Programme Human Resources Development 2007—2013, project number POSDRU/159/1.5/S/134197, project title “Performance and Excellence in Postdoctoral Research in Romanian Economics Science Domain”.
Notes
1Tax reforms in EU Member States 2014 – Tax policy challenges for economic growth and fiscal sustainability http://ec.europa.eu/economy_finance/publications/european_economy/2014/ee6_en.htm
References
1. Alexandru (Davidescu), A. A. (2014), “Estimating the size of Romanian shadow economy a labour approach”, Journal of Social and Economic Statistics, vol.3, no.3, pg.25-37, ISSN 2285-388X.
2. Andreica, ME., Aparaschivei, L., Cristescu, A. and Cătăniciu,N. (2010), „Models of the Minimum Wage Impact upon Employment, Wages and Prices: The Romanian Case”, Recent Advances in Mathematics and Computers in Business, Economics, Biology and Chemestry, 104-109.
3. Andreica, ME., Cristescu A. and Pirciog, S. (2011), “Simulation scenarios of employment on the Romanian labor market”, Proceedings of the 2nd International conference on Applied Informatics and Computing Theory, Prague, Czech Republic, 260-264.
4. Baum, CF. (2001), “Residual diagnostics for cross-section time series regression models”, The Stata Journal, 1 (1), 101—104.
5. Behar, A. (2009), “Tax Wedges, Unemployment Benefits and Labour Market Outcomes in the New EU Members”, AUCO Czech Economic Review 3 (1), 69—92.
6. Boltho, A and Glyn, A. (1995), “Can Macroeconomic Policies Raise Employment?”, International Labour Review, 134 (4-5), 451-470.
7. Cameron, AC and Trivedi, PK. (2009), Microeconometrics Using Stata, Stata Press
8. Dimian, GC., Ileanu, B., Jablonský, J. and Fábry, J. (2013), “Analysis of European Labour Market in the Crisis Context,” Prague Economic Papers, University of Economics, Prague, 2013(1), 50-71.
Publisher – Google Scholar
9. Driffield, N and Girma,S. (2003), “Regional Foreign Direct Investment and Wage Spillovers: Plant Level Evidence”, Oxford Bulletin of Economics and Statistics, 65 (4), 453-474.
Publisher – Google Scholar
10. Drukker, DM. (2003), “Testing for serial correlation in linear panel-data models”, The Stata Journal, 3 (2), 168—177.
11. European Commission (2010), “Communication from the Commission. Europe 2020. A strategy for smart, sustainable and inclusive growth”, Brussels. [Online], [Retrieved August 15, 2014], http://eur-lex.europa.eu/LexUriServ/LexUriServ.do?uri=COM:2010:2020:FIN:EN:PDF.
12. European Commission (2010), “Trade as a driver of prosperity”, Brussels. [Online], [Retrieved August 10, 2014], http://trade.ec.europa.eu/doclib/docs/2010/november/tradoc_146940.pdf.
13. Hoechle, D. (2007), „Robust Standard Errors for Panel Regressions with Cross-Sectional Dependence”, The Stata Journal, 7 (3), 281-312.
14. Jayanthakumaran, K. (2006), “An empirical assessment of the effects of trade on employment in Australia: 1989/1990-2000/2001”. Economic Papers, 25 (1), 68-82.
Publisher
15. Jenkins, R. (2006), “Globalization, FDI and employment in Viet Nam”, Transnational Corporations, 15, 115-142.
16. Koskela, E. (2001), “Labour taxation and employment in trade union models: A partial survey”, Bank of Finland Discussion Papers, no. 19.
17. Lazăr, M.I., (2014) “Tax Reform and Fiscal Sustainability in Central and Eastern European Countries”, Acta Universitatis Danubius. Administratio, Vol. 6, Issue 1, pp. 104-110, 2014;
18. Onaran, Ö., Bösch, V. and Leibrecht, M. (2010), “How does globalization affect the tax burden on labour income, capital income and consumption in different welfare regimes? The case of Western and Eastern EU Member States”, Middlesex University Business School, Discussion Paper, no. 141.
19. Padalino, S and Vivarelli, M. (1997), “The employment intensity of economic growth in the G-7 countries”, International Labour Review, 136 (2), 191-213.
20. Seyfried, W. (2011), “Examining the Relationship between Employment and Economic Growth in the Ten Largest States”, Southwestern Economic Review, 32 (1), 13-24.
21. Sen, K. (2008), “International Trade and Manufacturing Employment Outcomes in India: A Comparative Study”, World Institute for Development Economic Research (UNU-WIDER), Working Papers RP2008/87.
22. Vasilescu, D., Aparaschivei, L. and Pîrciog, S. (2011), “Factors influencing employment in the EU”, Recent Researches in Applied Informatics, 237-241.
23. Wooldridge, JM. (2002), Introductory econometrics — A modern approach, South-Western College Pub, Second Edition.
24. Zhao, L. (1998), “The Impact of Foreign Direct Investment on Wages and Employment”, Oxford Economic Papers, 50 (2), 284-301
Publisher