Introduction
Economic activity is far from accidental in space. On the contrary it tends to concentrate spatially because of scale and proximity effects. Based on this, Krugman (1991) argued that technology is an important and motivating factor for this concentration. In addition, agglomeration economies induce economic as well as innovation activities to concentrate geographically. Research in this field reveals that innovation is more concentrated than production as a first step, and production is more concentrated than population, both at national and regional levels. At the same time, the most innovative regions are the same regions, in which most of the production is generated. However, innovation and production patterns differ across sectors at country and regional level, while there are differences in the degree of spatial concentration of economic and innovative activity both across regions and branches of industry. This result suggests that industry and country specific conditions determine the spatial pattern of both innovation and production. The above differences can be persistent rather than transitory, a phenomenon that could be explained by Myrdal’s argument on “circular and cumulative causation” (Myrdal 1957) or by Arthur’s argument on “path dependency” (Arthur 1990).
Empirical research confirms the spatial concentration of innovation activity. Malecki (1980), for example, studying the location of R&D activities within USA, concluded that industrial R&D activities are concentrated in large urban regions. In another study on Austria, Fischer, Frohlich and Gassler (1993), found that most patents come from small and medium size urban centres (49.4%). The region of Vienna was classified second gathering the 31.9% of national patents, while other and more peripheral- isolated regions (outside and far from large cities) as well as the old industrial regions represented the 13.3% and 5.4% of patents respectively. Caniels (1997) also argued that innovative activity is spatially concentrated in few regions, and for Spain, as Guerrero and Sero mention, two are the regions that concentrate the majority of patents: Madrid and Barcelona. At the same time almost the 75% of national patents are connected to the 10% of Spanish land and in particular to large urban centres and metropolitan regions (Guerrero and Sero 1997). Breschi (2000) also examining patent data found evidence that there are large differences across regions in the degree of spatial dispersion and many asymmetries. He noted that chemical- pharmaceutical and electrical- electronic sectors are characterized by high concentrations. In another research, where a sample of 400 German and Israeli firms has been examined, it was found that innovation- technology activity is not only confined to the metropolitan or central regions (Frenkel, Sherer, Koschatzky and Walter 2001). More recently, a group of scientists, through various studies, ended up that product innovations as well as manufacturing production are spatially concentrated (Audretsch and Feldman 2004).
This paper examines the geography of innovation in Greece, trying to first locate regions and cities of concentration, second identify spatial differences and third highlight regions of better and worse performance, using Greek patent data. The rest of this paper is structured as follows: Section two deals with methodology issues and data collection and analysis, also referring to some arguments for and against the use of patent data in this study of economic analysis. Section three presents the main results on the geography of innovation for Greece. Section four further discusses and synthesizes the results. Finally section five refers to some concluding remarks.
Methodology and Data
In this paper patent data has been used in order to study the geography of innovation in Greece. Generally, a patent is evaluated under three criteria: its novelty to the world, its technical reproduction and industrial exploitation and, finally, its non-obviousness. Patents have been used extensively as innovation indicators (Grupp 1990; Archibugi & Pianta 1992). There are many reasons for that: First, patents cover almost every field of technology with the only exception of software which, however, is not linked directly to technical process and products. Second, they can be used extensively, at different levels of aggregation and comparison (from the level of technological field, to firm, industry, region, nation) because of the amount and detail of information they cover (Mogee 1991; Archibugi 1992). Third, they capture those R&D activities that are not conducted by firms, but carried out by individuals, universities and research institutions. Fourth, they include a lot of useful information (year of invention, assignee and inventor names and addresses, and citations) which is available for many years, hence can be used for numerous and different analysis, such as the sources of invention, the geography of innovation etc.
However, as every tool of analysis, patent data exhibits its own disadvantages and limitations. First patents are not the only way to exploit firm – specific technology and hinder imitation (Pavitt 1984, 1988). Second, firms, industries and countries differ in their propensity to patent and this variance in patenting has to do, among other things, with different institutional procedures and legislation. Third, patent protection is one possible way to face possible competition. Others are the so-called “industrial secrecy” or the “fast product promotion in the market”. Moreover, firms have different attitudes in patenting, which depend on the degree of commercial exploitation of patents and on firms’ technology and marketing strategies (Mansfiled, Schwartz & Wagner 1981). Fourth, the technological classification of patents can also be a problem. The high degree of detail and specialization, the relative difficulty in linking technology with production and the fact that a patent can by applied in many products, makes hard the study of patents at every level of analysis (OECD 2009).
Overall and whatever the strengths and weaknesses, patent data is considered to be the most common and available indicator of R&D product and innovation in technology, firm, sectoral and national level. This paper uses patent data to study the geography of innovation in Greece, exploiting their main advantages, namely the detail information they provide, while taking into consideration their limitations.
The analysis is based on the elaboration of a patent database which was constructed for this purpose. In Greece, responsible for patents and relevant data is the Greek Organization of Industrial Property (OBI in Greek). The 12 per year special printed bulletins of industrial property have been collected, where the national (foreign and Greek) protection titles- patents appear, and a patent database has been created with data from 1988 (date of first data sets by OBI) until 2010. This database contains 13 fields, such as the date of submission of patent application, the summary of the patent contents, etc. Based on the names and postal addresses of both inventors and beneficiaries the database has been elaborated through taxonomies of (1) national origin (foreign- external, Greek- internal patents, foreign- Greek), (2) institutional status (firms, individuals, research institutions, academic departments, state agency patents) and (3) geographical origin (region, regional entities- prefectures and municipalities- OTA in Greek). Obviously the main focus is the geographical parameter, but only for Greek patents.
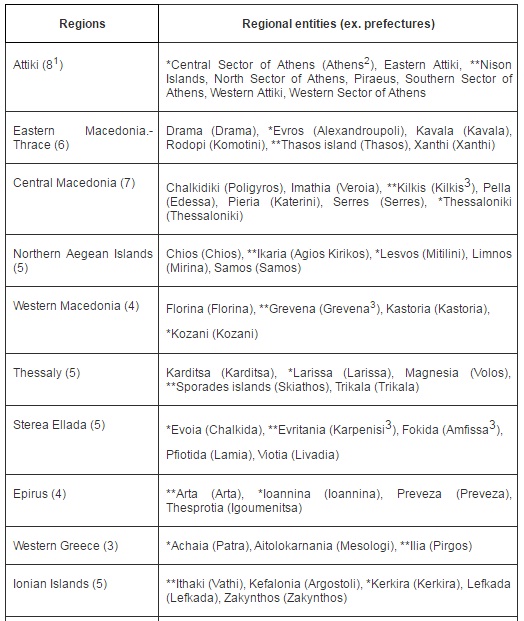
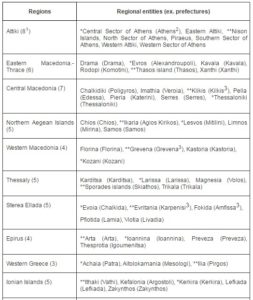
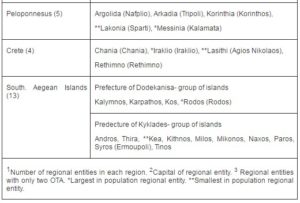
One further clarification has to be made regarding the geographical structure and regional- administrative division of Greece: Greece is divided into seven broader regions, 13 regions based on the NUTS2 classification system, 74 regional entities (ex. prefectures) and 325 organizations of local government (ex. municipalities), which are called ‘OTA’ in Greek. For better results indices of geographical concentration at different levels of scale have been calculated. The measurement of geographical concentration is based on the Herfindhal Index and has been calculated for the parameters of patents, population, GDP, value added, employment and R&D data. In order to give more detail and more quality to the results, indices of geographical concentration have also been calculated for regional entities, regions and country in relation to population and patents based on their municipalities, regional entities and regions respectively. Table 1 presents the geographical structure and regional- administrative division of Greece into regions (NUTS II) and regional entities (ex. prefectures). The names of the capital cities of every regional entity (prefecture) are also put in brackets, as well as both the largest and the smallest in population regional entity. For example the region of ‘Central Macedonia’ is in Northern Greece and is composed of seven (7) regional entities (ex. prefectures). The seat of the region is the regional entity of ‘Thessalloniki’ and its capital city is ‘Thessalloniki’. In addition ‘Thessalloniki’ is the largest regional entity while ‘Kilkis’ is the smallest.
Table 1: The Geographical Structure of Greece– Regions and Regional Entities
(Ex. Prefectures)
Results: The Geography of Innovation in Greece
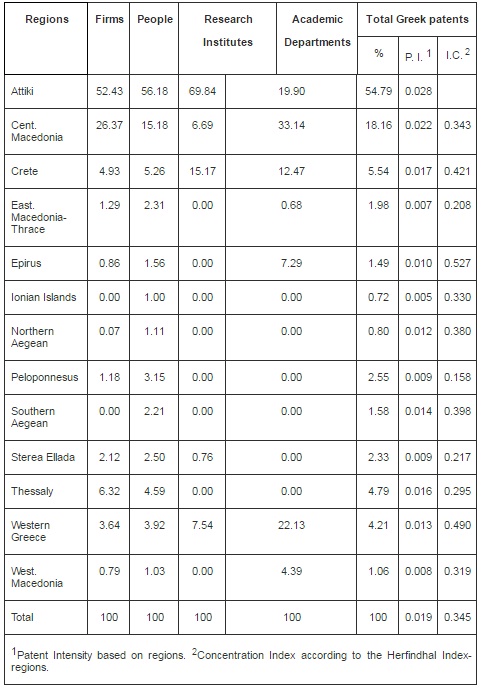
The geography of innovation in Greece, based on the distribution of patents across Greek regions, shows that the54.79% of Greek patents originate from the region of ‘Attiki’, the 18.16% from the region of ‘Central Macedonia’ and the 5.54% from ‘Crete’. ‘Thessaloniki’ dominates in ‘Central Macedonia’, while ‘Heracleion’ is the most important city- OTA for ‘Crete’ (tables 2 and 3). From the rest of the regions, ‘Thessaly’, with a share of 4.79% and ‘Western Greece’ with a share of 3.74% follow. The percentages of these two latter regions are due to the regional entities (ex. prefectures) of ‘Larissa’ and ‘Magnesia’ for the case of ‘Thessaly’ and ‘Achaia’ for the case of ‘Western Greece’. In the case of the sample of Greek firms’ patents and comparing columns 2 and 6 (table 2), it can be shown that the shares of ‘Central Macedonia’ and ‘Thessaly’ are higher than the respective of total Greek patents. In the case of Greek individuals (people), the parameter of regional dispersion of patents is obviously greater. Comparing again columns 3 and 6 (table 2), the shares of ‘people’ for most regions are higher than the respective of total Greek patents. Regarding the patents granted to research and academic institutions, although their patents amount to very small numbers their geographic distribution is clear. In research institutions, ‘Attiki’ is leading, followed by ‘Crete’, while in academic institutions ‘Central Macedonia’ ranks first and ‘Western Greece’ second. For the latter, the above shares are owned to the presence of many academic departments in the capitals of the referring regional entities (ex. prefectures). For example ‘Patra’, the capital of ‘Achaia’, has a Technical University. ‘Athens’ the capital of Greece and the seat of ‘Attiki’ has many universities, among which the Technical University of Athens. Finally ‘Thessaloniki’, the capital of ‘Central Macedonia’ has two large Universities, namely the Aristotle University of Thessaloniki and the University of Macedonia.
Table 2: The Geography of Innovation in Greece- % Distribution of Greek Patents across Regions
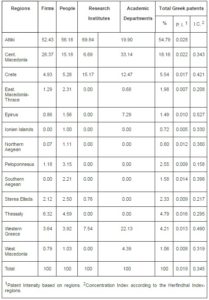
Source: Own elaboration of patent data.
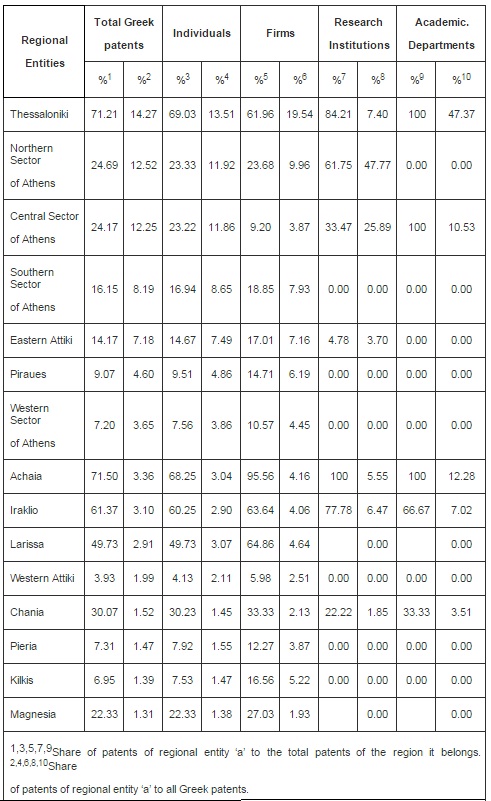
Table 3: The Geography of Innovation in Greece- % Distribution of Greek Patents across Regional Entities
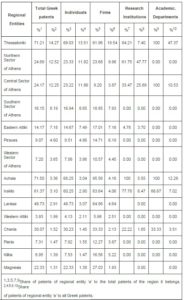
Source: Own elaboration of patent data.
Deepening the analysis and focusing on the level of regional entity (table 3), it can be shown that inside regions there are regional entities (ex. prefectures) and OTA (ex. municipalities) that are more dynamic and perform better. For instance the first position of ‘Attiki’ is due to the performance of six in total regional entities and their related OTA which are also included in the list of top 15 OTA. These regional entities are: central (‘Athens’), northern (‘Agia Paraskevi’, ‘Amarousio’, ‘Kifisia’, ‘Papagos- Cholargos’), southern (‘Kallithea’ and ‘Nea Smirni’) sectors of ‘Athens’, eastern ‘Attiki’ (‘Acharnes’) and Piraues (‘Nikea’ and ‘Piraues’). In the case of ‘Central Madedonia’, three regional entities account for almost the 90% of patents (‘Kilkis’, Pieria and ‘Thessaloniki’). However, based on the regional entity ‘Thessaloniki’, three OTA are included in the top 15 list and more specifically those of ‘Delta Axiou’, ‘Pilea-Chortiatis’ and ‘Thessaloniki’. On the contrary the situation of ‘Achaia’, ‘Crete’ and ‘Thessaly’ is clearer: In the first, ‘Patra’ is dominating. In the second, ‘Iraklio’ and ‘Chania’ account for more than the 90% of the total patents of the respective regional entity. In the third, two regional entities concentrate the majority of patents, namely ‘Larissa’ and ‘Magnesia’.
Summarising, results confirm first the phenomenon of geographical concentration and second the fact that concentration depends on the nature of the patent owner. Indeed, the concentration indices for ‘total Greek patents’ is 0.308, for individuals’ patents is 0.310, for firms’ patents is 0.289, for research institutions’ patents is 0.616 and for academic departments’ patents is 0.280. Therefore the most concentrated pattern is that of research institutions’ patents. The highest value of concentration for research institutions’ patents is due to the fact that most of these patents originate from the research institution ‘Democritus’, which is located in the OTA ‘Agia Paraskevi’ in ‘Attiki’. However, the metropolitan area of Athens dominates generally, since it concentrates most of innovation production and development.
Discussion- Synthesis of Results
Results confirm that the element of concentration is present. The analysis highlights both the dominance of ‘Attiki’ and its capital ‘Athens’ and the importance of few large cities, their regional entities and finally their respective regions. In this section the analysis is further deepened, aiming at comparing Greece to other countries regarding the element of concentration, second, exceeding the study of concentration beyond the parameter of innovation, with implications to demography, economy- production and technology (indices of concentration for population, GDP, employment and value added and R&D were calculated) and third presenting the position of Greek regions in Europe, in terms of performance and classification. Tables 4 and 5 present the results.
The comparison between Greece and other countries shows that concentration is a common feature. The OECD report (OECD 2003) shows that patents tend to concentrate geographically in a small number of regions in almost all countries. On average, the 54% of patents come from the 10% of regions. Belgium and Norway are classified below the OECD average, Poland has the lowest indicator of geographical concentration, while both Australia and Japan the highest. Greece moves on the OECD average and its geographical concentration accounts for 0.59. Relatively low concentrations are recorded in small (e.g. Belgium), large (e.g. Canada), in economically-technologically developed (e.g. Germany), as well as in more developing countries (e.g. Poland). At the same time, relatively high concentrations are recorded in small (e.g. Portugal), large (e.g. Australia), in economically-technologically developed (e.g. Sweden) and also in more developing countries like Portugal. Most patent owners come from urban regions (81% the OECD average). This pattern is more intense in Holland, Japan and Belgium.
The more peripheral regions are very important in Poland, Norway and Austria. On the contrary, in Canada, Island and Luxemburg the majority of patent owners live out of urban centres, in rural regions. In addition, innovation, seem to be more concentrated than production, measured by the distribution of value added in industry or GDP, and production tends to be more concentrated than population. The extent of concentration differs across countries,regions and branches. The lowest dispersions in concentration between innovation, production and population are recorded in Australia, U.S.A., Canada and Korea, while the highest are found in Japan, Spain and Poland (OECD 2005).
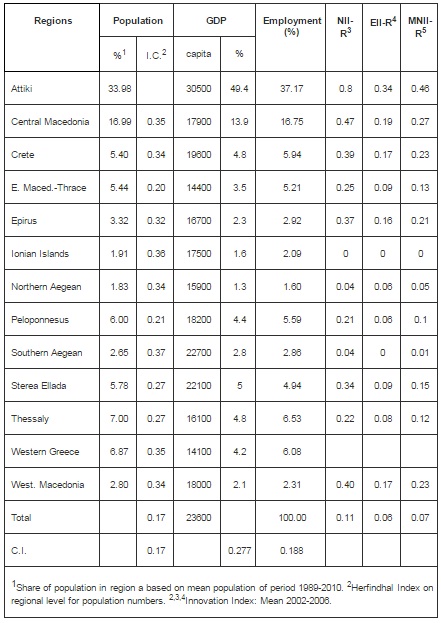
Table 4: Population, GDP, Employment, European and National Innovation Indices across Regions
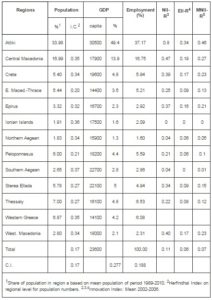
Source: Own elaboration of Greek statistics data.
Table 5: Value Added and Expenditures for R&D per Sector across Regions
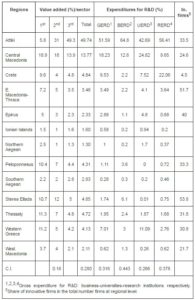
Source: Own elaboration of Greek statistics data.
The comparison between innovation, population, economy- production indices on concentration confirm empirical research, which argues that innovation is more concentrated than production and production is more concentrated that population (0.345, 0.172, 0.277 respectively), but this difference is more obvious at national rather than at regional level (table 4). However, the above argument is better confirmed when we move to the regional entity level (comparison of columns 5-7 of table 5). The further analysis shows that most patent owners live at the capitals of the above regional entities, which are at the same time large in terms of population and characterized by a certain-specific urban structure and industrial- commercial tradition (e.g. ‘Iraklio’ in ‘Crete’, ‘Piraues’ in ‘Attiki’, ‘Volos’ in ‘Magnesia’). Particularly for the parameters of income and production, as measured by GDP and total value added, we can see that the regional shares of GDP and total value added are quite similar. The same happens with their concentration indices (0.277 and 0.280 respectively). Comparing the shares of these two parameters with those of patents, we can see that only in ‘Attiki’ and ‘Central Macedonia’ the shares of patents are larger than those of both GDP and total value added.
Table 5 also presents data on expenditures of R&D (columns 6-7-8-9 respectively). The concentration indices for firm patents and firm R&D expenditures are 0.289 and 0.443 respectively. This means that the pattern of firm patents is more geographically dispersed, implying that firms choose to be located in more and perhaps different regional entities and OTA. This result is more obvious in the case of ‘Central Macedonia’ and is due to the importance of alternative firm locations, other than ‘Thessaloniki’ (e.g. regional entities of ‘Kilkis’ and ‘Pieria’ and the OTA of ‘Delta Axiou’ and ‘Pilea-Chortiatis’, which are very close to ‘Thessaloniki’). The ‘hidden’ reality behind this fact is the existence of industrial districts, where firms prefer to be located, as they enjoy specific economic or other privileges. Moving to the geographical concentration of both research institutions and academic departments, concentration for the former is 0.378 and 0.266 for the latter, both lower than patent concentration which accounts for 0.616 and 0.280 respectively. The regional shares of patents are smaller than those of R&D expenditures in research institutions, except for the cases of ‘Attiki’ and ‘Western Greece’. In academic departments the general picture is mixed. In some regions, patent shares are larger (e.g. ‘Central Macedonia’, ‘Crete’ and ‘Western Greece’) and in some other are smaller than the respective of R&D expenditures (e.g. ‘Attiki’).
Finally, the position of Greek regions in Europe based on the European and National Regional Summary Innovation Index, shows that Greek regions exhibit a very low comparative performance (European Commission 2007) (table 4). Greek regions are placed at the bottom of almost every European classification and scoreboard. ‘Attiki’ is the only region with a better placement in the total of 208 European regions. The placement of six Greek regions deteriorates over time, while the respective of other five regions remains stable but very low. According to the national- regional innovation index, the first five regions in terms of performance are the following: ‘Attiki’, ‘Central Macedonia’, ‘Crete’, ‘Western Greece’ and ‘Sterea Ellada’. This taxonomy doesn’t change if the European regional innovation index is being considered, with the exemption of the region ‘Epirus’, which enters. Both taxonomies are also similar with the results of this paper. Regarding patents, the performance of Greek regions is generally very low, which explains their classification-taxonomy at the bottom of the European list. ‘Attiki’, ‘Central Macedonia’, ‘Southern Aegean’ and ‘Eastern Macedonia- Thrace’ present the best relative performance. ‘Crete’ is placed lower than expected, while its placement deteriorates over time, loosing positions according to the total European classification. Based on the results of this paper, ‘Southern Aegean’ and ‘Eastern Macedonia-Thrace’ are placed much lower (e.g. 10th and 8thpositions respectively).
Conclusions
This paper examined the geography of innovation in Greece, presenting the spatial distribution of patents across regions and regional entities (ex. prefectures). Based on the theoretical and empirical argument that economic and innovative activity are geographically concentrated and that technology and innovation are crucial factors for this concentration, the paper examined the Greek case. Patents express one way of measuring innovation and patent data has been used extensively in the study of geography of innovation.
Greek innovation is concentrated in few regions, in most of cases mainly in their capitals, where in fact most of production is made and most of population live. Concentration is higher in research and academic institutions, obviously due to their special nature of activities. Focusing on the firm sample, there are few exemptible cases, which are related to a number of isolated firms and their innovation activities. Their location close or away from the capital seats is explained by a Greek special feature, namely that of industrial districts, where firms choose to locate because they enjoy different kinds of privileges. In fact these firms are also persistent innovators, namely firms with very high innovation activity in quantitative terms. Thus, innovation, economic production and population move in parallel and are concentrated in large urban and economic centers in Greece, such as ‘Athens’ (‘Attiki’), ‘Thessaloniki’ (‘Central Macedonia’), ‘Patra’ (‘Western Greece’), ‘Heracleion’ (‘Crete’) and ‘Larissa’ and ‘Volos’ (‘Thessaly’) are examples of the Greek case. All these regions and cities have their own urban, industrial- commercial tradition in Greece, which historically has been both developed and evolved, while determining both production and innovation.
(adsbygoogle = window.adsbygoogle || []).push({});
References
Archibugi, D. (1992). “Patenting as an Indicator of Technological Innovation: A Review,” Science and Public Policy 19(6), 357-368.
Publisher – Google Scholar – British Library Direct
Archibugi, D. & Pianta, M. (1992). The Technological Specialization of Advanced Countries: A Report to the EEC on International Science and Technology Activities, Kluwer Academic Publishers, Dordrecht.
Publisher – Google Scholar
Arthur, W. B. (1990). ‘Urban Systems and Historical Path Dependence, Cities and Their Vital Systems,’ Ausubel, J. Et Al (Eds), National Academy Press, Washington D.C., USA.
Audretsch, D. B. & Feldman, M. P. (2004). “Knowledge Spillovers and the Geography of Innovation,” Handbook of Regional and Urban Economics 4, 2713-2739.
Publisher – Google Scholar
Breschi, S. (2000). “The Geography of Innovation: A Cross Sector Analysis,” Regional Studies 34(3), 213-229.
Publisher – Google Scholar – British Library Direct
Caniels, M. (1997). The Geographic Distribution of Patents and Value Added Across European Regions, MERIT, Maastricht.
Publisher – Google Scholar
Coronado Guerrero, D. & Acosta Sero, M. (1997). “Spatial Distribution of Patents in Spain: Determining Dactors and Consequences on Regional Development,” Regional Studies 31(4), 381-390.
Publisher – Google Scholar – British Library Direct
European Commission. (2007). 2006 European Regional Innovation Scoreboard (2006- RIS), European Trend Chart on Innovation, EC, Brussels.
Publisher – Google Scholar
Fischer, M. M., Fröhlich, J. & Gassler, H. (1993). “An Exploration Into the Determinants of Patent Activities: Some Empirical Evidence for Austria,” Regional Studies 28(1), 1-12.
Publisher – Google Scholar – British Library Direct
Grupp, H. (1990). ‘Technometrics as a Missing Link in Science and Technology Indicators,’ Measuring the Dynamics of Technological Change, Sigurdson, J. (Ed), Pinter, London.
Google Scholar
Krugman, P. (1991). ‘Economic Geography and Trade,’ The MIT Press, MA and London.
Google Scholar
Malecki, E. J. (1980). “Dimensions of R&D Location in the United States,” Research Policy 9, 2-22.
Publisher – Google Scholar
Mansfield, E., Schwartz, M. & Wagner, S. (1981). “Imitation Costs and Patents: En Empirical Study,” The Economic Journal 91, 907-918.
Publisher – Google Scholar
Mogee, M. E. (1991). ‘Using Patent Data for Technology Analysis and Planning,’ Research Technology Management 34(4), 43-49.
Google Scholar
Myrdal, G. (1957). Economic Theory and Under-Developed Regions, Gerald Duckworth & Co. LTD, London.
Publisher – Google Scholar
OBI. (1988-2010). ‘Industrial Property Bulletins,’ Greek Industrial Property Organization, Athens (In Greek).
OECD. (2003). ‘Geographic Concentration and Territorial Disparity in OECD Countries,’ OECD, Paris.
OECD. (2009). ‘Using Patent Data as Science and Technology Indicators,’ Patent Manual, OECD, Paris.
Pavitt, K. (1985). “Patent Statistics as Indicators of Innovative Activities: Possibilities and Problems,” Scientometrics 7, 77-99.
Publisher – Google Scholar
Pavitt, K. (1988). ‘Uses and Abuses of Patent Statistics,’ Handbook of Quantitative Studies of Science and Technology, Van Raan. A. G. J. (Ed), North Holland, Amsterdam.
Google Scholar