Introduction
The diffusion of the open innovation (OI) paradigm has been changing the ways in which firms acquire, manage and exploit their intangible assets. Therefore, after an open perspective, the firm has become an active participant in the innovation market, acquiring knowledge assets from outside and selling or licensing the intangibles which are internally unexploited.
The purpose of this paper is to examine how and to what extent R&D intense companies are embracing the OI paradigm, by investigating new investments and divestments of intangibles occurring either in separate transactions or within business combinations, mergers and acquisitions (BCMAs).
Our research question is: what is the relevance of intangibles investments and divestments for companies in the context of OI?
In order to answer to such question, we developed a methodology for measuring OI and analysing the nature of intangibles transactions drawing on secondary data from consolidated annual reports of companies. The devised framework has been applied to a sample of 271 top R&D spending companies in the bio-pharmaceutical and technology hardware & equipment industries, for the three-year period 2010-2012, for a total of 813 annual reports analysed.
The paper is structured as follows: after a brief literature review on the role of intangibles in innovative activities, our methodological framework is delineated and then applied to the sample in order to define both the intensity and the frequency of intangibles transactions in the selected industries. Results are outlined and conclusions will close the work.
Literature Review
In this section an overview of the relevance of intangible assets for innovation as a whole and for OI is provided in order to lay the foundations for our analysis.
It is widely acknowledged that intangibles play a prominent role in driving firm’s innovative activities. Typically, in the various accounting standards, three categories of intangibles are referred to: R&D costs, goodwill, and other intangibles, including patents, licenses, and brands, among others (Stolowy and Jeny-Cazavan, 2001). Thus, not only R&D is a crucial innovation input, but also other non-R&D intangibles provide the firm with knowledge that facilitates the different phases through which innovation occurs as well as its different dimensions.
Intangible assets are of central value for innovation (Kaplan and Norton, 2004), since much of tangible capital is accumulated via intangible capital (Veblen, 1908). Innovation occurs where intangibles abound (Moenaert et al., 2000); they provide shelter for innovators, being difficult to imitate, and may bring competitive advantage and lead to innovativeness (Cho and Pucik, 2005; Cohen and Levinthal, 1990; Nonaka, 1991). Several scholars have employed intangible assets as proxies for innovative activities (Lev, 2001; Milbergs and Vonortas, 2004), and treat expenditures on intangibles as investments in innovation capacity (Arundel, 2007; Corrado et al., 2006; Nakamura, 2001): the variation in intangible assets between two periods can be considered as a measure for current innovation effort (Rogers, 1998).
Intellectual capital (IC) can be considered as the system composed of all of the firm’s intangibles; thus, it has a strong relation with the intangible assets of a company. In financial accounting, intangible assets act as a proxy for IC (Brännström et al., 2009). Qualifying IC through intangibles allows to underline both its static and dynamic nature, by using resources and activities: the former representing the stock or value of a given intangible at a point in time, the latter implying an allocation of resources aimed at i) internally developing or acquiring new intangibles, ii) increasing the value of an existing intangible or iii) evaluating and monitoring the results of the former two activities (Meritum Report, 2002).
OI breaks down company boundaries, enabling both inflows and outflows of knowledge which affect the IC stock of a company. As of inbound OI, interacting with external sources of knowledge allows organizational learning, by impacting on a firm’s knowledge stock. As to outbound OI, the strategies for external utilization of knowledge, such as licensing the firm’s intellectual property (IP) and creating spin-offs, may affect the firm’s knowledge stocks (Laine and Laine, 2012). Hence, IC is closely related to OI since it can be generated and exploited through interactions with third parties.
From all the previous considerations, it emerges that firm’s intangibles stock is crucial in driving its innovative activities, but also, after an open approach, OI transactions affect the IC of companies, since they enable knowledge to flow in and out of them.
With this assumption, this work aims at analysing the relevance of intangibles transactions for companies in the context of OI.
Framework Description
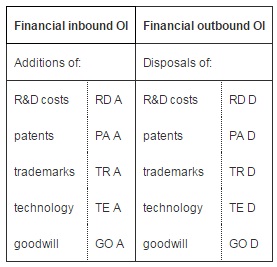
Financial statement data are employed to define the inbound vs. outbound nature of OI processes and the economic vs. financial nature of the transactions, where the terms economic and financial refer to accounting items in the income statement and the balance sheet, respectively. Hence, costs reflect economic inbound activities, revenues are related to economic outbound processes, additions (i.e. new investments in intangibles) concern financial inbound activities and disposals (i.e. divestments of intangibles) pertain to financial outbound processes.
A comprehensive description of our OI measurement framework can be found in Michelino et al., (2014a), where the openness of a company is summarized by the openness ratio, which incorporates open costs and revenues as well as additions and disposals of intangibles.
In particular, OI economic transactions comprise: 1) collaborative R&D costs and revenues deriving from joint development projects; 2) R&D outsourcing costs and revenues for the development of R&D services on behalf of third parties; and 3) in-licensing costs and out-licensing revenues and royalty fees paid or received. Conversely, as to the financial measures of OI, we can define additions and disposals of innovation-related intangibles. Consistently with the intangibles tri-partition proposed in literature by Stolowy and Jeny-Cazavan (2001), we considered three broad classes of innovation-related intangibles: 1) R&D: in-process R&D and development costs; 2) IP: licenses and patents, trademarks and product rights, and technology; and 3) goodwill, related to research spin-ins and spin-offs.
In this paper the focus is on the role of intangibles in OI. While the first two categories have a clear connotation within innovation, the innovative nature of goodwill can be questionable. Given the definition itself of goodwill as “future economic benefits arising from assets that are not capable of being individually identified and separately recognized”(IFRS 3) we think that it can be identified with the skill, the know-how, the technical and organizational expertise of the workforce. This is consistent with most of the definitions of goodwill found in the annual reports of companies, as well as with Brännström et al., (2009), claiming that goodwill, arising from a business combination, can be considered as a black box containing a bundle of intangible assets, and that a significant part of goodwill contains IC (Boekestein, 2009).
Since we aim at investigating the relevance of intangibles transactions, we will focus on investments and divestments of R&D, IP and goodwill (Table 1). Note that intangibles investments enclose both the value acquired in separate transactions and within BCMAs.
Table 1: New Investments and Divestments of Innovation-Related Intangibles
Actually, not all the increases and decreases of intangibles can be considered as open, since we have capitalization of development costs or internally developed IP rights, amortization, impairment charges, reclassifications and currency translations, which are all linked to internal accounting operations and adjustments, rather than to exchanges with third parties. Further, in order to have a likely value of the returns from what is divested, disposals are considered net of amortization, but we were not able to include the gains and losses because they were reported as a unique value comprising all intangibles divested and not only the one we were interested in or even both intangible and tangible assets. Conversely, additions are considered at their gross value, since we are interested in defining the total value of the effort sustained by the company for acquiring new intangibles.
For each component in Table 1, intensity can be defined as its degree of importance for each company if compared to the total volume of business, i.e. total intangibles for additions and disposals. All the components are calculated starting from consolidated annual reports, thus, referring to one fiscal year; yet, if the phenomenon is observed over a longer period of time, we can also analyse whether the components are continuously present in the financial statements of companies or not. Hence, for each component, we define also the variable time as the number of years in which it is reported in the annual report of a company.
The intensity-time evaluation leads to the distinction among four categories of transactions for every company. In particular, a component can be considered as:
1. Characteristic, if it is both intense and continuous over time, strongly featuring the business of the company all over a long period of time;
2. Ancillary, if it is continuous over time but not intense, i.e. the company constantly performs the activity, even if it is not very relevant if compared to its total business;
3. Exceptional, if it is intense but not continuous over time, strongly but discontinuously typifying the business of the company;
4. Negligible, if it is neither intense nor continuous over time.
A third variable is introduced to assess the pervasiveness of the transaction within a given set of companies, e.g. an industry or a segment: frequency. Given a sample of N companies with n≤N of them registering a specific item, we can calculate its frequency as:
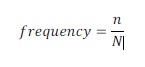
Therefore, for a set of companies, we can examine the average values of intensity and time and compare them to the frequency, thus, for each of the four aforementioned categories we can separate the common intangibles transactions from the uncommon ones. For instance, if the mean values of intensity and time are high and frequency is high, the specific transaction is characteristic for the whole sample, whereas, if the frequency is low it is characteristic only for a niche of firms.
Finally, the product of the three variables gives a synthetic measure of the relevance of each transaction; in particular, if we are analysing additions and disposals of intangibles over a period of X years, a percentage indicator can be obtained as:
relevance=intensity . . frequency
Framework Application
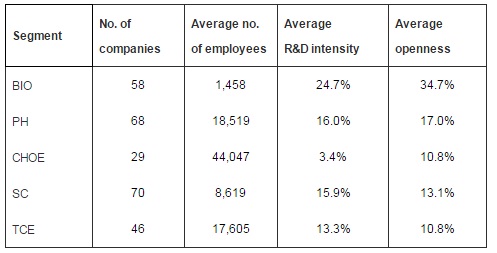
The devised methodology was applied to a sample of 271 world top R&D spending companies, according to The EU Industrial R&D Investment Scoreboard, for which 2010-2012 consolidated financial statement data were gathered and analyzed. The bio-pharmaceutical and technology hardware & equipment industries were selected, the former including biotechnology (BIO) and pharmaceutical (PH) segments, the latter computer hardware & office equipment (CHOE), semiconductors (SC) and telecommunications equipment (TCE) segments.
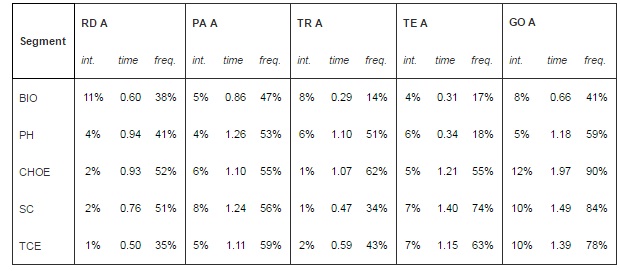
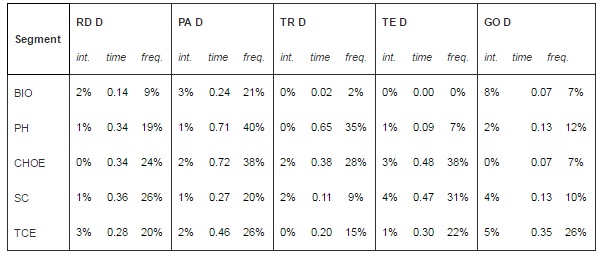
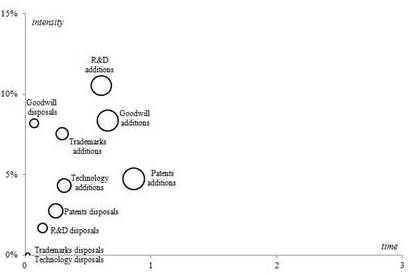
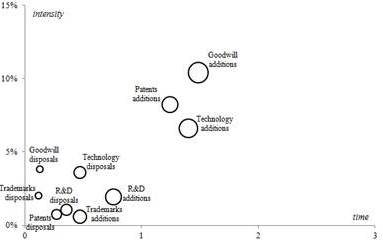
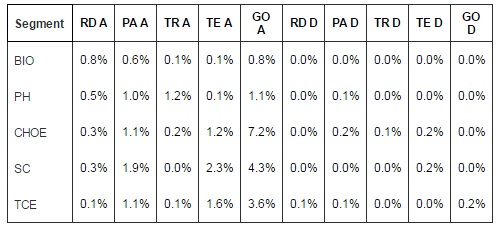
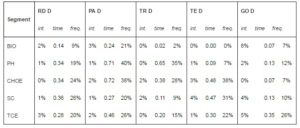
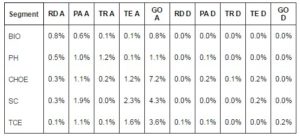
Table 2 exhibits the descriptive statistics by segment, whilst in Tables 3 and 4 the average values of intensity, time and frequency for each segment are presented (mean values for intensity and time were calculated only for those companies with a non-zero value). Figures 1 to 5 show a positioning map for each segment: x and y axes respectively represent time and intensity, while the dimension of the bubble indicates the frequency.
Table 2: Descriptive Statistics by Segment
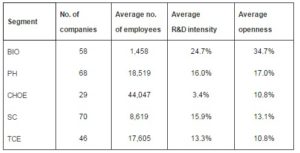
Table 3: Intensity, Time and Frequency of Additions by Segment
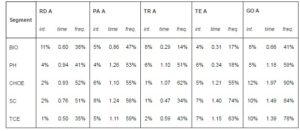
Table 4: Intensity, Time and Frequency of Disposals by Segment
The smallest and most R&D intense companies of the sample are BIO ones; they also exhibit the highest degree of openness in their innovation processes. Further, the bio-pharmaceutical industry as a whole is more open than the technology hardware & equipment one.
In the BIO segment, all intangibles transactions are not continuous over time. In particular, R&D additions can be considered as exceptional since, even if acquisitions of R&D are seldom performed by BIO companies, they increase the total value of intangibles in a significant way. All the other transactions are negligible because they do not increase or decrease the total value of intangibles in a relevant manner. Additions are more widespread than disposals all over the segment, with 14% to 47% companies performing the former and 0% to 21% the latter. Specifically, the highest values of frequency regard patents: this means that most BIO companies are dynamic in IP management, by renewing their IP portfolio through acquisition and sale of patents.
OI is much less typifying the PH segment, if compared to the BIO one. Once again, almost all intangibles transactions are discontinuous over time with the exception of additions of patents, goodwill and trademarks which are detected for more than 1.1 years over 3, and their relevance is always limited when compared to the total business of companies. However, such a result may be influenced by their larger dimension if compared to that of BIO firms. As a matter of fact, even if the intangibles transactions in the segment can be relevant, their intensity, when compared to the total value of intangibles, is typically low, given their dimension.
Just like BIO firms, additions are more widespread than disposals. The most frequent transactions in the segment regard goodwill in inbound, with more than half of firms engaged in incorporation of other companies, and patents and trademarks both in inbound and outbound. Thus, in comparison to BIO companies, PH ones are also focalized on branding strategies, showing a dynamic management of their brand portfolio, by acquiring and selling trademarks.
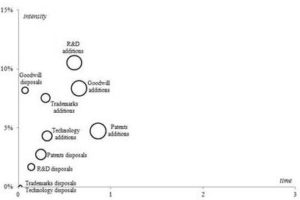
Fig. 1: Intangibles Additions and Disposals for BIO Companies
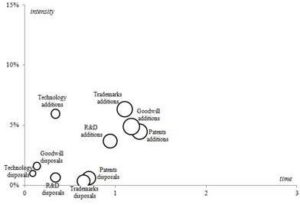
Fig. 2: Intangibles Additions and Disposals for PH Companies
As of the technology hardware & equipment companies, most intangibles transactions are negligible, i.e. neither intense nor continuous over time. The only exception is given by goodwill additions which can be considered as characteristic since they can be detected in more than 75% of the companies for more than 1.3 years over 3 and with an average intensity of 11%. Further, technology and patents additions can be regarded as ancillary since they can be detected in more than 50% of the companies for more than 1.1 years over 3 but with a lower intensity. All in all investments are more widespread than divestments.
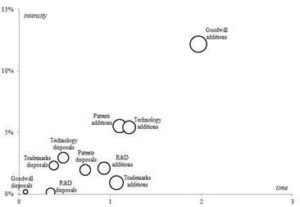
Fig. 3: Intangibles Additions and Disposals for CHOE Companies
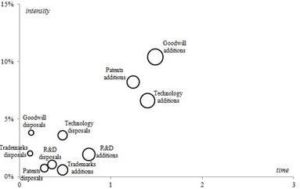
Fig 4. Intangibles Additions and Disposals for SC Companies
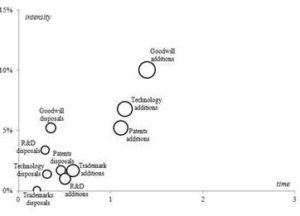
Fig. 5: Intangibles Additions and Disposals for TCE Companies
The findings presented since now can be synthesized through the calculation of the relevance of each component by segment (Table 5):
• All intangibles transactions have little relevance for bio-pharmaceutical companies;
• In the technology hardware & equipment industry, the addition of goodwill is the primary and most relevant transaction, followed by investments in technology and patents.
Table 5: Relevance of Intangibles Transactions by Segment
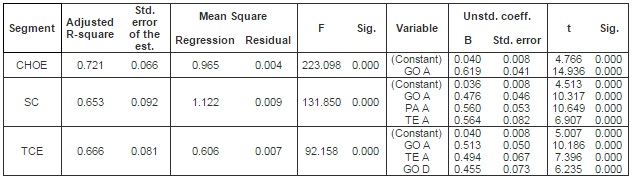
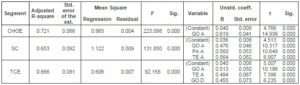
Such results were also confirmed through the regression analyses performed using the intensity values of the different components as explicating variables for openness: employing the stepwise method we can delineate the components which better explain openness for each segment, by examining their entry order. In particular, we considered the regression models where the adjusted R-square reached a value equal or greater than 0.6 (Table 6). As we could expect, we obtained a good regression only for the technology hardware & equipment industry, since OI financial transactions are not relevant for bio-pharmaceutical companies. For the three segments first goodwill addition enters. Yet, for CHOE companies ever since the first model a good regression is obtained, meaning that if only goodwill additions are calculated the value of the whole openness ratio can be well approximated by the linear equation:
openness (CHOE)=0.040 + 0.619 GO A +εCHOE
where εi is the error of the regression model.
Differently, in the SC and TCE segments, in order to obtain a good regression, in addition to goodwill, both patents and technology investments have to be considered in the former, and technology additions and goodwill disposals in the latter:
openness (SC)=0.036 + 0.476 GO A+ 0.560 PA A+ 0.564 TE A+ εSC
openness (TCE)=0.040 + 0.513 GO A + 0.494 TE A+ 0.455 GO D+ εTCE
where εi is the error of the regression model.
Table 6: Synthesis of Regression Models – Dependent Variable: Openness
Some observations can be pointed out as to the analysis of the OI financial transactions in the different segments.
Firstly, bio-pharmaceutical companies have not registered relevant intangibles transactions. Actually, such firms are mainly represented by economic transactions in both inbound and outbound processes (e.g., collaboration, outsourcing, and licensing costs and revenues), denoting the operating nature of OI. Consistently, the transactions featuring these companies can be detected in the income statement, as components of the EBIT. Typically, bio-pharmaceutical firms enter into several kinds of agreements with universities, medical and research centres and other bio-pharmaceutical companies, and work with many providers in pre-clinical and clinical development, thus resulting in external development costs related to clinical trials; in particular, small and young BIO companies provide R&D services to larger and longer established PH firms, the former more oriented to outbound practices, the latter to inbound ones (Michelino et al., 2014b). Such findings are consistent with literature, signalling the creation of a tight inter-firm network of R&D collaboration as an unavoidable strategy for innovative bio-pharmaceutical companies (Roijakkers and Hagedoorn, 2006; Salman and Saives, 2005). This justifies the emergence of a strong dual market structure, which is developed by large established PH companies and small research-intensive BIO firms (Powell et al., 2005; Saviotti, 1998): the capabilities and resources of these two groups of firms are complementary, resulting in numerous inter-firm partnerships in the R&D network.
On the contrary, the most relevant financial transaction for technology hardware & equipment companies is no doubt goodwill addition which is performed by more than 75% companies in the industry, relying on incorporation of other firms as a mean for absorbing know-how and IC from outside. This is consistent with literature, which reports the desire to obtain valuable resources, enclosing know-how, technologies, and capabilities possessed by target firms, as a relevant driver of BCMAs activities (Ahuja and Katila, 2001; Chaudhuri and Tabrizi, 1999).Such a behaviour can be explained in terms of both product development pace and life cycle: while the development of a new drug can take more than ten years, the life cycle of hardware is often less than one year. Therefore, the focus is on ready-made solutions, acquirable within BCMAs, rather than on collaborating for developing them. Incorporation is a viable solution because of the modularity of IT design: many computer and chip designs are based on compatible components, and this makes it simpler to buy technology that can be readily integrated, whereas the organic nature of products and technologies in the bio-pharmaceutical industry makes integration far more difficult (Bower, 2001).
Conclusion
This paper aims at investigating in deep the financial transactions of companies under the form of new investments and divestments of intangibles occurring in the context of OI.
The framework was tested on a sample of 271 bio-pharmaceutical and technology hardware & equipment companies over a three-year period from 2010 to 2012, for a total of 813 consolidated annual reports analysed. For bio-pharmaceutical companies, the OI strategy is far more oriented to revenues and costs, thus, OI financial transactions are not relevant.In the technology hardware & equipment industry, OI transactions are mainly financial and well represented by goodwill; thus, companies mostly rely on incorporation as a mean for absorbing know-how and IC from outside. The difference in the relevance of intangibles transactions is industry-specific, linked to the main features of the innovation pipeline. Further research will be devoted to the evaluation of how such different behaviors have an impact on the performances of companies.
This work improves the understanding of the relevance of intangible assets in open activities, by examining which transactions of intangibles mostly feature R&D intense companies.
(adsbygoogle = window.adsbygoogle || []).push({});
References
1.Ahuja, G. & Katila, R. (2001). “Technological Acquisitions and the Innovation Performance of Acquiring Firms: A Longitudinal Study,” Strategic Management Journal, 22 (3), 197-220.
Publisher – Google Scholar
2.Arundel, A. (2007). “Innovation Survey Indicators: What Impact on Innovation Policy?,” Science, Technology, and Innovation Indicators in a Changing World: Responding to Policy Needs. OECD.
Publisher – Google Scholar
3.Boekestein, B. (2009). “Acquisitions Reveal the Hidden Intellectual Capital of Pharmaceutical Companies,” Journal of Intellectual Capital, 10 (3), 389-400.
Publisher – Google Scholar
4.Bower, J. L. (2001). “Not All M&As are Alike – and that Matters,” Harvard Business Review, 79 (3), 93-101.
Publisher – Google Scholar
5.Brännström, D., Catasús, B., Giuliani, M. & Gröjer, J.-E. (2009). “Construction of Intellectual Capital – The Case of Purchase Analysis,” Journal of Human Resource Costing & Accounting, 13 (1), 61-76.
Publisher – Google Scholar
6.Chaudhuri, S. & Tabrizi, B. (1999). “Capturing the Real Value in High-Tech Acquisitions,” Harvard Business Review, 77 (5), 123-30.
Publisher – Google Scholar
7.Cho, H.-J. & Pucik, V. (2005). “Relationship between Innovativeness, Quality, Growth, Profitability and Market Value,” Strategic Management Journal, 26 (6), 555-75.
Publisher – Google Scholar
8.Cohen, W. M. & Levinthal, D. A. (1990). “Absorptive Capacity: A New Perspective on Learning and Innovation,” Administrative Science Quarterly, 35 (1), 128-52.
Publisher – Google Scholar
9.Corrado, C., Hulten, C. & Sichel, D. (2006). “Intangible Capital and Economic Growth,” Cambridge, Massachusetts: National Bureau of Economic Research.
Publisher – Google Scholar
10.Kaplan, R. S. & Norton, D. P. (2004). “Measuring the Strategic Readiness of Intangible Assets,” Harvard Business Review, 82 (2), 52-63.
Publisher – Google Scholar
11.Laine, M. O. J. & Laine, A. V. O. (2012). “Open Innovation, Intellectual Capital and Different Knowledge Sources,” Proceedings of the 4th European Conference on Intellectual Capital. 23-24 April 2012. Helsinki, Finland.
Publisher – Google Scholar
12.Lev, B. (2001). ‘Intangibles: Management, Measurement and Reporting,’ Brookings Institution Press, Washington.
Google Scholar
13.Meritum Report (2002). “Guidelines for Managing and Reporting on Intangibles,” (Intellectual Capital Report).
Google Scholar
14.Michelino, F., Caputo, M., Cammarano, A. & Lamberti, E. (2014b). “Inbound and Outbound Open Innovation: Organization and Performances,” Journal of Technology Management & Innovation, 9 (3), 65-82.
Publisher – Google Scholar
15.Michelino, F., Lamberti, E., Cammarano, A. & Caputo, M. (2014a). “Measuring Open Innovation in the Bio-Pharmaceutical Industry,” Creativity and Innovation Management (Article in press, first published online: 15 August 2014).
Publisher – Google Scholar
16.Milbergs, E. & Vonortas, N. (2004). ‘Innovation Metrics: Measurement To Insight,’ Center for Accelerating Innovation and George Washington University. National Innovation Initiative 21st Century Working Group, September.
Google Scholar
17.Moenaert, R. K., Caeldries, F., Lievens, A. & Wauters, E. (2000). “Communication Flows in International Product Innovation Teams,” Journal of Product Innovation Management, 17 (5), 360-77.
Publisher – Google Scholar
18.Nakumura, L. (2001). What is the U.S. Gross Investment in Intangibles? (At Least) One Trillion Dollars a Year!, Working paper No. 01-15, Federal Reserve Bank of Philadelphia, October.
Publisher – Google Scholar
19.Nonaka, I. (1991). “The Knowledge-Creating Company,” Harvard Business Review, 69 (6), 96-104.
Publisher – Google Scholar
20.Powell, W. W., White, D. R., Koput, K. W. & Owen-Smith, J. (2005). “Network Dynamics and Field Evolution: The Growth of Inter-Organizational Collaboration in the Life Sciences,” American Journal of Sociology, 110 (4), 1132-1205.
Publisher – Google Scholar
21.Rogers, M. (1998). ‘The Definition and Measurement of Innovation,’ Working paper No. 10/98, Melbourne Institute of Applied Economic and Social Research, University of Melbourne, Melbourne, May.
Google Scholar
22.Roijakkers, N. & Hagedoorn, J. (2006). “Inter-Firm R&D Partnering in Pharmaceutical Biotechnology since 1975: Trends, Patterns, and Networks,” Research Policy, 35 (3), 431-46.
Publisher – Google Scholar
23.Salman, N. & Saives, A. L. (2005). “Indirect Networks: An Intangible Resource for Biotechnology Innovation,” R&D Management, 35 (2), 203-15.
Publisher – Google Scholar
24.Saviotti, P. (1998). ‘Industrial Structure and the Dynamics of Knowledge Generation in Biotechnology,’ In Senker, J. (Eds.), Biotechnology and Competitive Advantage: Europe’s Firms and the US Challenge. Edward Elgar, Cheltenham, pp. 9-43.
Google Scholar
25.Stolowy, H. & Jeny-Cazavan, A. (2001). “International Accounting Disharmony: The Case of Intangibles,” Accounting, Auditing and Accountability Journal, 14 (4), 477-97.
Publisher – Google Scholar
26.Veblen, T. B. (1908). “On the Nature of Capital: Investment, Intangible Assets, and the Pecuniary Magnate,” Quarterly Journal of Economics, 23 (1), 104-36.
Publisher – Google Scholar