Introduction
When investors buy stocks in a publicly traded firm, the only cash received directly from the investment are the expected dividends. Therefore, the distribution of cash to the stock holders is one of the major decisions undertaken by a firm. Finance managers always endeavour to establish policies that assist in the distribution of earnings to the shareholders. A fundamental observation made for dividend policy is that there is a widespread tendency of corporations to pursue a relatively stable dividend policy. The constant dividend model assumes that investors prefer current certain dividends. According to this model, the current price per share (P0) is the present value of expected dividends discounted at the required rate of return. Investors, thus, expect firms to pay out a gradually growing dividend stream since in my cases firms will not increase their dividends in the short-run for fear of not being able to maintain the new level of payouts into the future. In this case, it is not unreasonable to argue that dividends will be expected to grow at some rate into the indefinite future (Van Horne, 2002).
A firm determines the amount of dividends to pay to the shareholders while incorporating the expectations of future dividends growth. Dividends are expected to grow at a constant rate according to the constant dividend model. The existence of uncertainty about the future is sufficient to make the price of a share dependent upon the dividend policy which is followed: and in particular, the more generous the dividend policy, the higher the price of the share. Bitok (2004), found that there was a weak relationship between the dividend policy and the value of firms quoted at the Nairobi stock exchange. However, share prices are usually volatile if growth expectations are high and small changes in such expectations will cause wild fluctuations in the share price. A perfect dividend policy is the one that strikes a balance between current dividends and future growth and maximizes the firm’s stock price. It is important that a firm decides how much is to be retained and how much is to be re-invested. If a firm is faced with investing in activities with higher internal rates of return compared to cost of equity, earnings should be used to finance such investments. Whatever is left can then be paid out as dividends. Both dividends and growth are desirable and are always in conflict. The dividend constant model assumes that the investors are rational and risk averse. They prefer certain returns to uncertain returns and, therefore, put a premium to the certain returns and discount the uncertain returns. Thus, the investors would prefer current dividends and avoid risk. Retained earnings involve risk and so the investor discounts the future dividends. This risk will also affect the stock value of the firm, (Pandey, 2005).
The general economic growth in Kenya has been on an upward trend from 2002 when an opposition political party took over the Government before slowing at the current economic recession. The liberalized business environment enabled many firms to expand their businesses and diversify their products to capture and serve the emerging business opportunities and changing marketing conditions. Year after year, the earnings and dividends of most companies listed at the Nairobi stock exchange have been improving as the Gross National Product grew. Kioko (2006) established that there was a relationship between dividend changes and a firm’s future profitability while Wandeto (2005) found a positive relationship between dividend changes and earnings. The finance managers tended to exercise prudence in the payment of dividends by not immediately increasing the payout ratio in the fear of reducing the dividends in future due to fluctuations in earnings. The firms could instead opt to gradually grow the dividends payable to the shareholders during this period of expected improved earnings. However with inflation, the growth of the Gross National Product of the country was also affected and earnings of companies grew at an average rate.
The dividend discount model is a widely accepted financial tool used to evaluate stocks values based on the net present value of the future dividends. In this study, the applicability of the model will be tested for companies quoted at the Nairobi Stock Exchange. The number of investors at the Nairobi stock exchange has significantly increased over the years. The Investors’ expectation is to buy a stock that is undervalued and be able to determine the amount of future cash flows to be generated. Using the model, it is very easy to identify growth or income stocks that can prove to be profitable if the investment is made in the present. However, most growth stocks firms would not pay out dividends rather they re-invest earnings into the company with the hopes of providing shareholders with returns by means of a higher share price. This study tested whether the factors as incorporated by the constant dividend model are adopted in the determination of dividend payout to shareholders for companies listed at the NSE.
Statement of the Problem
The constant growth model can be used to project share prices, earnings, dividends and annual returns into the future. Gordon (1959) explained the preference for the current income with the bird in hand argument. Since a bird in hand is better than two in the bush, the investors would prefer current income to future income which may or may not be available. The determination of the amount of dividends payable is an important decision that companies undertake. Finance managers consider several factors such as legal guidelines, liquidity, restrictions in debt contracts, the stage of company growth, availability of investment opportunities and business cycles to determine the dividends payable. The constant dividend model could be adopted and the extent of application by companies listed at the NSE could be moderate in an attempt to supplement other models when determining the dividends payable.
Assets can be valued by discounting expected future dividends and since most distant dividends present greater uncertainty, share prices tend to be lower for firms that pay smaller dividends in the near future, because the discount rate reflects a larger risk and consequently, a smaller present value. Lintner (1956) emphasize relevance of current and past earnings while Miller et al. (1961) suggest that dividend changes also depend on the management’s expectations of future earnings. Grullon, et al. (2002) concluded that firms that increase dividends had a significant decrease in systematic risk while firms that reduced dividends incurred a significant increase in risk. Graham, et al. (1962) argue that firms should present a high payout ratio because the present value of short term dividends is superior to the long-term dividends, and because the shares prices of a firm that pays dividends should be superior to a similar firm that does not pay dividends.
Traditional approach to dividend policy concludes that companies distribute as much of net income as possible in the form of cash dividends, since investors prefer dividends to future capital gains. Pruitt and Gitman (1991) from their survey of finance managers, suggest that factors such as current and past years’ profits, the year-to-year variability of earnings, the growth rate of earnings, and prior years’ dividends are important influences on the amount of dividends paid. These finding are consistent with Lintner’s (1956) behavioral model. The survey of corporate managers’ studies by Baker, et al. (1985) and Farrelly, et al. (1986) concluded that the major determinants of dividend payments are the anticipated level of future earnings and the pattern of past dividends.
The empirical studies show that there is a relationship between the dividend payments and stock prices. Current dividend payments reduce investor’s uncertainty, causing investors to discount the firm’s earnings at lower rate of return while dividend reduction increase investors uncertainty raising the required rate of return .This study tried to establish whether the constant dividend model as applied in developed countries was relevant in a developing country using local data in dividend payout by companies listed on the Nairobi stock exchange. The study further tried to establish the relevance of constant dividend model to establish the dividends payout.
The study differs from the reviewed studies in that it seeks to establish whether the dividend constant model can be used to explain the various dividend policies by the companies at the Nairobi Stock Exchange. The model has been widely employed in valuations of firms and also to determine the market price shares. However, this study attempts to find out whether given the market price of shares, a firm would use the model to determine the amount of dividends payable to shareholders. Hence, the aim of this study is to test the applicability of constant dividend model by companies listed at the Nairobi stock exchange.
Objective of the Study
The objective of this study was to test the applicability of constant dividend model among companies listed at the Nairobi stock exchange.
Literature Review
The Constant Dividend Model
The constant growth model is a variant of the discounted cash flow model, a method for valuing a stock or business. It is used to resolve valuation issues for litigation, tax planning, and business transactions that are currently off market. It is named after Myron J. Gordon, who originally published it in 1959. It assumes that the company issues a dividend that has a current value of D that grows at a constant rate g. It also assumes that the required rate of return for the stock remains constant at k which is equal to the cost of equity for that company. It involves summing the infinite series which gives the value of the current price, P. Thus, the investors would prefer to pay a higher price for the stocks which earn them current dividend income and would discount those stocks which either postpone/reduce the current income. The discounting will differ depending on the retention rate (percentage of retained earnings) and the time, (Aswath Damodaran, 2006).
The model works best for a mature company that pays a hefty portion of its earnings as dividends, such as a utility company. An increased uncertainty over quality of accounting information could lead to a larger required return on investment Ke. Doubts regarding optimistic forecasts of a firm’s earnings and dividend growth could lead to a lower expected dividend growth rate g. The dividend discount model makes an assumption that dividends are steady, or grow at a constant rate indefinitely. But even for steady, reliable, utility-type stocks, it may not be possible to forecast exactly what the dividend payment will be next year or several years later. It forces investors to evaluate different assumptions about growth and future prospects. The challenge is to make the model as applicable to reality as possible, which means using the most reliable assumptions possible, (Aswath Damodaran, 2006).
Dividend payout is summarized by the following key elements; the fraction of a firm’s earnings that should be paid out over time on average and the amount the firm should pay out as current dividends. Firms are generally free to select the level of dividends they wish to pay to holders of ordinary shares, although factors such as legal requirements, debt covenants and the availability of cash resources impose some limitations on this decision. Most firms tend to maintain a target dividend per share. The profits of firms fluctuate considerably with changes in the business environment. Dividends are increased only after earnings appear clearly sustainable. Empirical literature has recorded systematic variations in dividend behaviour across firms, countries, time and type of dividend ((Mathur, 1979).
Lintner (1956) found that the primary factor influencing a change in dividend policy was a firm’s earnings. Brittain (1964, 1966) and Fama et al. (1968) reevaluated Lintner’s model. Their results supported Lintner’s view that managers prefer paying a stable dividend and are reluctant to increase dividend to a level that the firm cannot sustain. Fama et al. (1968) found that changes in a firm’s dividend per share are largely a function of the firm’s target dividend payout ratio, current or lagged earnings, and the last period’s dividends.
Variations amongst firms are noted, for example, in Fama, et al. (2001).They bring evidence to show that US dividend paying firms tend to be large and profitable, while non-payers are typically small, less profitable but with high investment opportunities. Variations across countries include La Porta, et al. (2000) who studied the dividend policies of over 4,000 firms from 33 countries around the world. They found out that dividend policies vary across legal regimes in a way that is consistent with the idea that dividend payment is the outcome of effective pressure by minority shareholders to limit agency behaviour. Thus firms in common law countries with good legal protection of investors tend to have higher payout ratios compared with firms in countries with weaker legal protection. This is consistent with Allen et al. (1995), who note that firms in the USA, had payout ratios of around 60 percent during the 1980s and early 1990s. However during the same period, Glen, et al (1995) observed a payout ratio of only about 40 percent, for a composite of emerging markets’ firms.
Time trends in dividend behaviour was investigated by Fama et al. (2001), who found that the percentage of US firms that pay dividends fell from 66.5 in 1978 to 20.8 percent in 1999. The study also describes a declining trend in the propensity to pay dividends by US corporations in the time period from the late 1970s to the late 1990s. Likewise DeAngelo, et al. (2000) looked at time trends in the type of dividends paid by US firms. They found that special dividends have gradually disappeared in the period from the 1940s to the 1990s, although incidences of very large special dividends have increased. In light of the freedom over dividend policy and the observed variations across firms, countries, time and type of dividends, the question of how dividend policy is determined has been the subject of many studies. This question is often referred to as the “Dividend Puzzle”, and the debate is generally believed to have been initiated by Miller’s et al. (1961) irrelevancy theory. Miller et al. (1961) show that in a perfect capital market with rational behaviour, perfect certainty with investment and borrowing decisions given, dividend policy has no effect on the value of the firm.
Theories of Dividend Policy
Disposition Theory: Shefrin et al. (1985) predicted that because investors dislike incurring losses much more than they enjoy making gains, they will gamble in the domain of losses. Investors are thus reluctant to sell their shares because they will experience regret if the stock subsequently rises in price. They hold onto stocks that have lost value (relative to the reference point of their purchase) and will be eager to sell stocks that have risen in value A second argument was that although many investors are willing to consume out of dividend income, they are unwilling to “dip into capital” to do so. Dividend and sales of stock are not perfect substitutes for these investors. For behavioral reasons, then, certain investors prefer dividends to retention of earnings.
Clientele Effect: Petit (1972) used quarterly dividend announcements to test their accuracy in predicting firm’s future earnings. He sampled 625 NYSE firms and found clear support for the hypothesis that dividends announcement provide investors with information. Thus, there is a tendency of a firm to attract the type of investor who likes its dividend policy. For instance, stockholders such as retired individuals prefer current dividends to future capital gains, so they require a firm to pay out a higher percentage of its earnings. Other stockholders (especially young investors) have no need for current income, and hence, prefer a low payout ratio since they prefer to receive their earnings in future. If investors could not invest in companies with different dividend policies, it might be very expensive for them to achieve their investment goals. Investors who prefer capital gains could reinvest any dividends they receive, but first they would have to pay taxes on the income. In essence, then, a clientele effect might exist if stockholders are attracted to companies because they have particular dividend policies. Consequently, we would expect the stock price of a firm to change if the firm changes its dividend policy because investors will adjust their portfolios to include firms with the desired dividend policy. In response to this, MM argued that one client is as good as any other and the existence of clientele effect does not suggest that one dividend policy is better than any other policy. In absence of market imperfections, the switching is quite healthy as a firm would attract some and loose other investors.
Tax Differential Theory: Investors would prefer not to receive dividends now to avoid paying immediate taxes. They would prefer reinvesting them in the corporation which would result in a future capital gain on the stock price as the value of the stock increases. Litzenberger et al. (1979) argue that investors have to pay taxes on dividends received and capital gains realized. Capital gains tax rate is lower than ordinary income tax rate and capital gains tax is payable when the gain is realized. Hence, from the taxation viewpoint, investors should prefer capital gains to dividends. The value of a firm with a low payout ratio should, therefore, be higher than the one with a higher payout ratio. Due to this, Litzenberger (1979) argued that MM’s assumption that taxes do not exist is far from reality. In this theory, it is assumed that taxes on cash dividends are higher than those on capital gains. The stock price will be more attractive if less cash dividends are paid.
Bird in Hand Theory: Gordon and Lintner (1963) concluded that investors prefer current dividends to capital gains. They argue that current dividends are certain and resolve uncertainty in the investors mind about the future. Because investors are risk averse preferring current to future dividends, near dividends are, therefore, discounted at a lower rate in comparison to future dividends. Because of this, equity costs reduce with high payout ratios. The stock price increases as shareholders get more dividends in cash as they view the stock as attractive, thus, lowering the cost of capital while increasing the value of common stock.
Information Content or Signaling Theory: Stephen Ross, (1977) observed that there is a strong association between dividend payment and share prices. The theory states that investors regard dividends as signals of managements forecast of earnings. If, for instance, investors expect a company’s dividend to increase by 5%, then the stock price generally will not change significantly on the day the dividend increase is announced. If however, investors expect an increase of 10% but the company actually increases the dividend by 20%, this generally would be accompanied by an increase in stock price. Conversely, a less than expected dividend increase, or a reduction, generally would result in a price decline. It is well known that firms are usually reluctant to reduce dividends and, therefore, managers do not raise dividends unless they anticipate higher or at least stable earnings in the future to sustain higher dividends. This, therefore, means that a larger than expected dividend increase is taken by investors as a signal that the firm’s management forecast improved earnings in the future, whereas a dividend reduction signals a forecast of poor earnings. Thus, it can be argued that investors’ reaction to changes in dividend payments do not show that investors prefer dividends to retained earnings; rather, the stock price changes simply indicate that important information is contained in the dividend announcements. In effect dividend announcements provide investors with information previously only known to management. MM argued that investors’ reaction to a change in dividend policy does not necessarily show that investors prefer dividends to capital gains, rather the fact that a price change follows a dividend action, simply indicates that there is important information or signaling content in the dividend announcement.
Dividend Irrelevance Theory: Miller et al. (1961) argued that dividend policy has no effect on either the value of a firm or its cost of capital. MM stated that dividend policy is irrelevant and that the value of the firm is determined by its basic earnings power (cash flows) and its risk class (cost of capital).The manner in which the earnings and dividend is split does not affect its value. MM showed that under perfect market conditions, a firm’s value is decided by its investments and not on dividends and they demonstrated that under a particular set of assumptions, if a firm pays high dividends then it might have to issue new stocks to new investors and the share of the value the company gives up to the new investors is exactly equal to the dividends payable. MM argued further that investors are able to replicate any dividend stream that a firm is able to pay. If dividends are lower than desired an investor can simply sell some of the shares of stock and obtain the desired cash distribution. However if the dividend are higher, an investor can use the excess dividends to purchase additional shares in the company. Investors are able to manufacture homemade dividends which are perfect substitutes for corporate dividends. For a corporate decision to have value, the firm must be able to do something for the shareholders that they are unable to do for themselves. Since investors can manufacture homemade dividends which are perfect substitutes of corporate dividends, then dividend policy is irrelevant.
Dividend Policies in Practice
A dividend policy is the plan of action adopted by the firm’s directors whenever there is a decision to be made. It determines the divisions of earnings between dividend payment to shareholders and reinvestment of cash to be done. Firms design policies that enable them achieve their various goals. The main approaches include: residual, stable predictable, constant payout or low regular plus extra policy. Dividend policies assist to resolve a firm’s attempt to maintain a steady, stable dividend growth pattern or vary dividend payment from period to period and from year to year depending on the cash flows and the financing requirements (Pandey, 2005)
Residual Policy: This is a policy in which the dividend payment is set equal to the actual earnings available less the amount of retained earnings necessary to finance the firm’s optimal capital budget. Companies using the residual dividend policy choose to rely on internally generated equity to finance any new projects. Myers (1984) argued that firms will only pay dividends from residual earnings. The policy is particularly suited to growth companies with enormous profitable investments. The policy states that dividends should only be paid out of free cash flows. The justification of the policy is that investors would prefer to have the firm retain and re-invest earnings rather than pay them out as dividend so long as the return earned on the re-invested earnings exceed their required rate of return. As a result, dividend payments can come out of the residual or leftover equity only after all project capital requirements are met. These companies usually attempt to maintain balance in their debt/equity ratios before making any dividend distributions, which demonstrates that such a company decides upon dividends only if there is enough money leftover after all operating and expansion expenses are met. According to this policy, dividend would thus fluctuate from period to period. This would create uncertainty to investors and as a result the cost of capital may increase.
Constant Pay-out Policy: This policy involves payment of a certain constant percentage of earnings to the shareholders in each dividend period. Earnings fluctuate from period to period and, thus, this policy imply that dividend per share will also fluctuate. The problem with the policy is that if the firm’s earnings drop or if a loss occurs in a given period, the dividends may be low or even nonexistent and would cause uncertainty to the investors.
Stable or Predictable Policy: This policy involves payment of a specific amount of dividend per share each year or periodically increasing the dividends at a constant rate. This makes dividends predictable by investors and reduces uncertainty on the future dividends. Most firms prefer reasonably stable dividends policies. If management is convinced that the new level of earnings is permanent, then, an increase in the amount of dividends can be made.
Low Regular Plus Extra Policy: Low regular plus extra policy involves payment of low regular dividends plus year end extras in good years. It is a policy based on paying a low regular dividend, supplemented by an additional dividend, when earnings are higher than normal in a given period. The policy gives a firm flexibility as it can set the low regular dividends at levels which can be sustained even in loss making years. By establishing a low regular dividend that is paid each period, the firm gives investors the stable income necessary to build confidence in the firm while the extra dividend permits them to share in the earnings from an especially good period. Investors are however assured of receiving at least minimal dividends, hence, reduced uncertainty. This policy is common among companies that experience cyclical shifts in earnings and whose cash flows are quite volatile (Mathur, 1979).
Empirical Studies
Gordon (1959) stated that investors believe that future capital gains are more uncertain than dividends, thus having lower present value than dividends. However, there were limitations of such dividend policy: investors do not like reductions in dividend payments, companies need enough cash to pay out dividends and good investment opportunities reduce possibilities to pay out dividends. Lintner (1956), based on findings from field investigations, set up a theoretical model of corporate dividend behaviour and tested its adequacy and reliability. He found that managers give serious consideration to perceptions of shareholders and only change dividend rate after they were convinced that such a change was positively desirable by shareholders. Questions of dividend payment were only addressed together with analysis of the existing dividend rate. Lintner (1956) concluded that most managers believed that shareholders prefer a reasonably stable rate, which is reflected in the stock price premium on stability or gradual growth in dividend rate.
Fernandez, et.al (1999) concluded that dividends are relevant in explaining share market value, implying that investors consider dividends to be a signal about a firm’s future economic prospects. This work was based on a sample of non-financial firms listed on the London Stock Exchange in the period between 1991 and 1996, resulting in a total of 4,752 observations. The authors reached the following conclusions. First, the lower the earnings level, the more sensitive firms are to dividends. Second, dividend policy is sensitive to firms’ size, because the smaller the firm, the higher the expectations regarding future earnings. Third, dividends are more important when their increase is followed by a decrease in operational income, and they are less relevant when their decrease is followed by earnings increases, since the expectations regarding future prospects are partially advanced by positive earnings changes and lastly dividends have higher relevance when their absolute increase is followed by an increase in the payout ratio, because in this way investors believe investment opportunities would not be diminished. The results are consistent with dividend information content hypothesis, since in accordance with this hypothesis, an announcement of a dividend decrease may be a pessimist message transmitted by firms’ managers regarding the expectations of future prospects.
Baker, et.al (1985) and Farrelly et.al (1986) surveyed chief financial officers (CFOs) of NYSE firms from three industry groups (utilities, manufacturing, and wholesale/retail) to identify the major determinants of corporate dividend policy. Their evidence shows that the most important factors are the anticipated level of future earnings, the pattern of past dividends, the availability of cash, and the desire to maintain or increase the stock price. Similar to the findings of Lintner (1956), they report that firms try to avoid changing dividend rates that might soon need to be reversed, maintain an uninterrupted record of dividend payments, have a target payout ratio, and periodically adjust the payout toward the target. Respondents showed strong agreement that dividends provide a signaling device and the market uses dividend announcements to help value firm’s stocks.
Robbins et.al (1972) found that the age and size of a business has a bearing on affiliates’ dividend practices. Older affiliates provide a greater share of their earnings to the parent company presumably because as the affiliate matures, it has less investment opportunities while at the same marginal rates elsewhere in the world in newer locations are greater. Brealey et al. (1991) concluded that managers focus more on dividend changes than on absolute levels, prefer smooth dividends and are reluctant to increase dividends that might have to be reversed later. Glen et al. (1995) study the dividend policy of firms in emerging markets and found substantial differences in dividend policies of companies in developed and emerging markets. They show that dividend payments are much lower in emerging markets and companies follow less stable dividend policies, although they do have target payout ratios.
Lee, et al. (1999) investigated whether there is long-term relationship between various definitions of earnings and dividends. The study utilized a bivariate time-series model of earnings and dividends obtained from annual observations on the Standard & Poor’s Index for the period 1871 to 1992. The results indicate that dividend behaviour is determined primarily by changes in permanent earnings and that the Lintner model performs better when the target payout ratio is a function of permanent rather than current earnings. This is supportive of the signalling hypothesis in the sense that current earnings are not a good indicator of the long-term financial position; hence, managers utilize dividends to signal this position.
Marsh, et al. (1987) studied an aggregate stock market dividend process using 55 years of aggregate data and economic earnings. They found that market prices adequately reflect permanent earnings. Managers systematically change the dividend payout following unexpected changes in permanent earnings by partially adjusting dividend levels. Bhat, et.al (1994), on the basis of a survey of managers’ perspective about dividend payment and retention, argue that dividends depend on current and expected earnings as well as the patterns of past dividends. They also argue that dividends help in signaling the future prospects of the firm and dividends are paid even if the firm has profitable investment opportunity.
Lintner (1956) carried out a series of interviews with the managers of 28 US Industrial firms about their firms’ dividend policies during the 7-year period from 1947 to 1953. From the survey, it emerged that firms tend to establish dividend policies with target payout ratios that are applied to current earnings. He also reported that although the target payout ratios and speed of adjustments vary across firms, in most cases they stay reasonably stable over time. He further noted that companies moved to a target dividend level (based on a percentage of earnings) over a period of three years. He explained this caution in terms of managers’ unwillingness to reduce dividends paid to investors. The dependent variable in the decision making process according to the study was the change in existing rate and not the amount of the newly established rate. Based on his findings, Lintner (1956) developed the partial adjustment model of the change in the dividend level from the previous to the current period. The rationale of the model is that dividends depend on current net income and are constrained by past dividends because of reluctance to reduce dividends or to raise them to a higher level which may not be maintained. The model reflect management’s belief that investors dislike erratic patterns in dividend levels and hence the emphasis is on the changes from the previous actual level.
Grullon, et.al (2002) analyzed the reaction between dividend policy changes and a firm’s dividend risk and growth. Their main goal was to relate dividend policy changes with a firm’s lifecycle. They found evidence that dividend increases suggest that firms are in a transition between the growth and the maturity phase, since in the latter, investments opportunities start to reduce as well as the level of required resources, thus allowing higher cash flow, which could be used for dividend payments. Supporting their work on the capital asset pricing model, they concluded that firms that increase dividends had a significant decrease in systematic risk while firms in which dividends decreased, incurred a significant increase in risk. Black [1976] posed the question, “Why do corporations pay dividends?” In addition, he posed a second question, “Why do investors pay attention to dividends?” Although, the answers to these questions may appear obvious, he concluded that they are not. The harder we try to explain the phenomenon, the more it seems like a puzzle, with pieces that just do not fit together. After over two decades since Black’s paper, the dividend puzzle persists.
Bernstein (1998) expresses concern over the decline in dividend payouts over a period of time in the US market. He observes that given the earnings estimates provided by firms, the low dividend payout induces reinvestment risk and earning risks for investors. He asserts by trying to calculate the historical correlation between payout ratios in the year t and earnings growth over t+5, the correlation is positive and statistically significant. Patsouratis (1989) provided empirical results that show that earnings are a more influential factor than prior year dividend in determining current period changes in dividends. The decision to pay dividends starts with profits. Therefore, it is logical to consider profitability as a threshold factor, and the level of profitability as one of the most important factors that may influence firms’ dividend decisions. Mahapatra, et.al (1993) do not find any evidence in support Lintner’s model who found that both earning and lagged dividends positively influence current divided. De Angelo, et.al (1992) analyses the relationship between dividends and losses and the information conveyed by dividends about the earnings performance. They examined the dividend behaviour of 167 NYSE firms with at least one annual loss during 1980-1985 and those with no losses during the same period, where all the firms had a consistent track record of 10 or more years of positive earnings and dividends. They found out that 59% of the 107 firms with at least one loss during 1980- 95 reduced dividends compared to 1% of the 440 firms without losses. Their finding support signaling hypothesis in that dividends change would improve the ability to predict future year’s performance. Pruitt and Gitman (1991) find that risk (year to year variability of earnings) also determines the firms’ dividend policy. A firm that has relatively stable earnings is often able to predict approximately what its future earnings will be and such a firm is more likely to pay a higher percentage of income as dividends.
Bernartzi, et al. (1997) analyzed the issue of whether dividend signals the future or the past and found that changes in dividend across stocks are not strong forecasters of cross-sectional differences in future earnings growth. Benartzi, et al. (1997) takes an empirical approach of comparing the unexpected earnings of firms that changed their dividends with those that did not. The sample contained 7,186 firm-year observations of 1,025 US firms that trade on the NYSE or the AMEX for at least two years during the period 1979 to 1991 and which met various other requirements. The hypothesis is that firms that increase their dividends in a given year should enjoy positive unexpected earnings in the following years. Similarly, firms that decrease their dividends in a given year should experience negative unexpected earnings in the following years. Benartzi, et al. (1997) also investigates variation in the unexpected earnings across dividend increasing firms. The hypothesis is that if signaling is costly, then the larger the dividend-increase, the greater the unexpected earnings in the following year. Results in Benartzi, et al. (1997) show a strong contemporaneous correlation between dividend changes and earnings changes. Firms that increase their dividends in year 0, experience earnings increases in that year, which are significantly higher than the mean earnings change of the group of firms that did not change their dividends. Similarly, firms decreasing their dividends, experience significantly more severe earnings decreases in the same year compared with the group of firms that did not change their dividends. However contrary to the signaling hypothesis, no correlation was found between the sign and size of dividend increases in a given year and earnings changes in future years. Furthermore firms that cut dividends in a given year, experience significant earnings increases in the following year.
Karanja (1987) studied dividend practices of publicly quoted companies in Kenya by collecting data through a questionnaire and obtained information about the kind of dividend policies managers of the quoted companies pursued. He found three factors to be the most important determinants of dividend policy i.e. cash, liquidity and the amount of earnings. He found that dividend policy is also influenced by the attitude of the board of directors though he concluded that many companies followed a stable dividend payout ratio. Abdul (1993) conducted a study to identify the parameters which are important in the determination of dividends by publicly quoted Companies in Kenya and concluded that liquidity is the most important factor in determining dividends. Njoroge (2001) conducted a study on the relationship between dividend policies and growth in assets, return on assets and return on equity at the Nairobi Stock Exchange and found that both Return on Equity and return on assets are positively related to the payout ratio and that growth in assets is not significant in determining the level of dividends. Bitok (2004) studied the effect of dividend policy on the value of the firms quoted at the NSE. According to the study, dividend policy is relevant thus implying that an optimal dividend policy exists. However, the relationship between dividend policy and the value for the firms quoted at the NSE is weak implying there are other factors (investment and financing) other than dividend policy that affect the value for the firm. Tiriongo (2004), in the study on dividend policy practices in the companies listed at the NSE, argued that there was a general declining trend of dividend payment pattern attributed to numbers of factors, such as, dwindling company profits and economic performance that were associated with Financial liberalization. Wandeto (2005) conducted an empirical investigation of the relationship between dividend changes and earnings and found, using a simple regression model, that there was a strong positive relationship between dividends per share and earnings per share with a correlation coefficient of 25.3% and concluded that dividend change is most sensitive to earnings.
Muindi (2006) studied the relationship between earning per share and dividend per share of equities for companies listed at the NSE. The findings of the study reveal that there is a significant relationship between earnings per share and dividend per share. Muchiri (2006) studied the determinants of dividend payout among the listed companies in Kenya and concluded that the most important factor in dividend policy was the company’s current and future profitability. Other factors considered important were the cash flow position of the company, the immediate financial needs and the availability of profitable investments. Kioko (2006) analysed the relationship between dividend changes and future profitability of companies quoted at the NSE and established that at least in the year of dividend change, there existed a relationship between dividend changes & future profitability. However, for the first and second after dividend change, an insignificant relationship was observed.
Research Methodology
A survey design was applied in this study. This design involves collecting data for all members of the population. The design was also used by Muchiri (2006) who carried out a survey for all companies listed at the Nairobi stock exchange on the determinants of dividend payout.
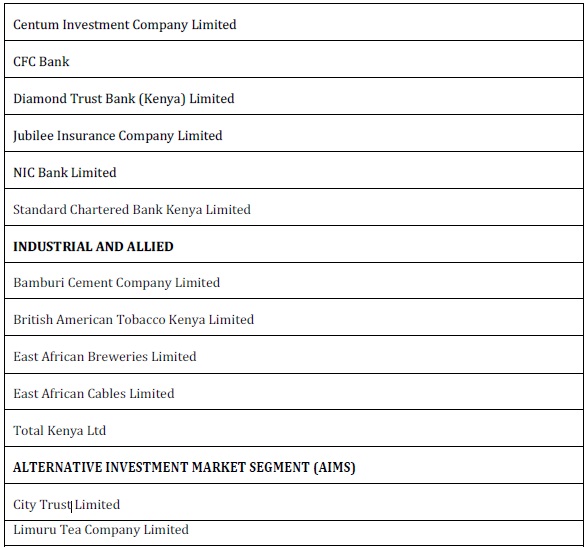
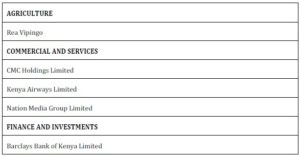
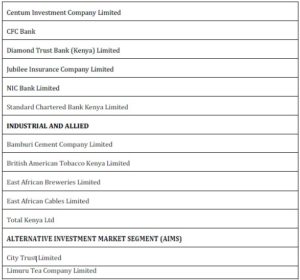
The population of the study consisted of all companies quoted at the Nairobi Stock Exchange. The sample consisted of the 18 companies that paid dividends consistently from December 2002 to 2008. The Nairobi Stock Exchange was preferred since information was readily available for all listed firms. In addition, the 7-year period was deemed adequate to enable sufficient analysis and conclusions to be drawn of the firms and was also guided by the time period when Lintner (1956) conducted his research.
The study employed secondary data mainly from financial statements of all the 18 firms that paid dividends consistency from December 2002 to 2008 and the Nairobi Stock Exchange yearly guide manuals. Share prices were obtained from the daily pricelist schedules circulated by the Nairobi stock exchange hand books.
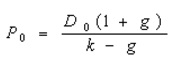
The data was analyzed using the constant Dividend model. According to Gordon (1959) expected share price is expressed as a function of the dividend in year one hence (D1), shareholders’ expected rate of return (k), and the long-term growth rate of dividends (g). The model assumes that dividends, earnings, and stock values grow at the same constant rate.
The analysis was done by re-computing dividends for all the companies for the seven year period that consistently paid dividends between December 2002 and 2008.
The equation used for data analysis was;
D1 = P0 * (Ke – g)
Where:
- D1: represents the dividend paid in the following year
- P0: represents the current share price
- G: represents the dividend growth rate
- Ke: represents the required rate of return on a stock
The required rate of return was obtained using the equation:
Ke = Profit after tax
Equity
g was estimated using the equation: (1 – payout ratio) * Return on equity
The complete analysis of the data was done using Microsoft excel. Paired sample t-test statistic was used to determine whether there is a significant difference between the dividend paid and the figures observed from the computations.
Data Analysis, Findings and Discussions
Dividends were recomputed for each of the 18 companies to obtain the dividends that ought to have been paid if the constant dividend model was applied. The re-computed dividends and the dividend per share were plotted on a graph against the years of the study. The trend of the dividends was then established.
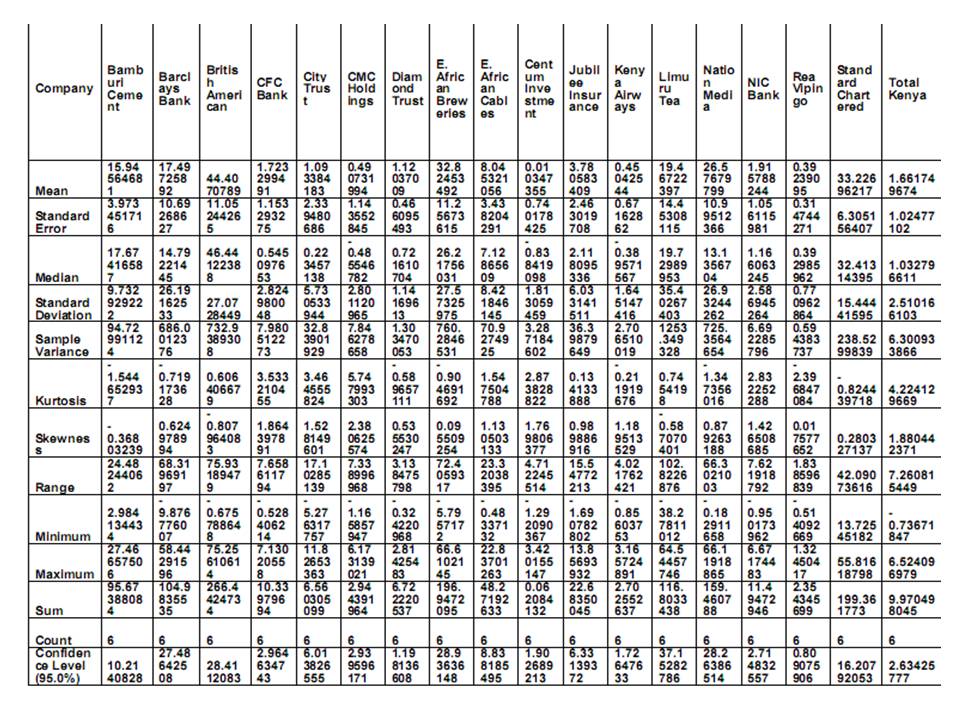
The results of Statistical analysis for the 18 companies for the seven year period are presented in the following sections.
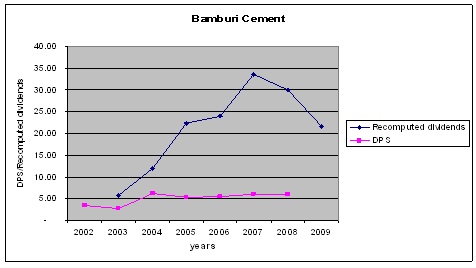
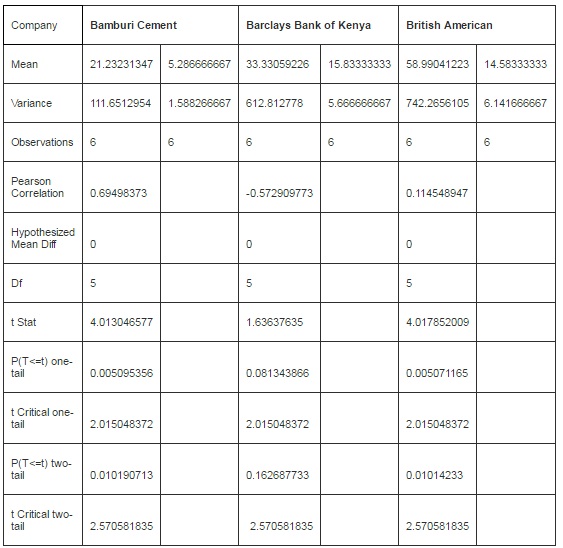
Table1: Bamburi Cement Company Limited
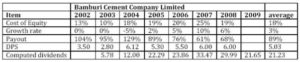
The average dividend growth rate for Bamburi Cement Company during the period of study was 3% while the payout rate was 89%. The recomputed dividends showed an increase of amounts paid for year 2002 to 2007. The dividend model forecasts the dividend payable for 2009 at Kes. 21.65 which is fairly high compared to the dividend paid in 2008. The calculated t-value of 4.03 (Appendix II) lies at the extreme of t critical 2.57 indicating that the difference between the dividends as per payout and recomputed figures are significantly different. However, the Pearson correlation is positively correlated indicating that the dividends comparisons move in the same direction.
A graph of the trend of dividend per share and recomputed dividend for Bamburi Company is shown below:
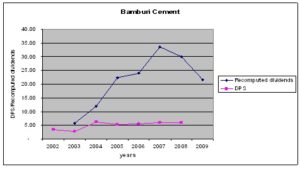
Appendix III: shows Paired sample t-test statistic for Bamburi company for the difference between the dividend per share and recomputed figures. With a standard deviation of 9.73, the distribution is negatively skewed showing investors have a greater chance of extremely negative outcomes. At 95% confidence level mean dividend range is 5.7 to 26.1. However, the dividend per share lies outside this range.
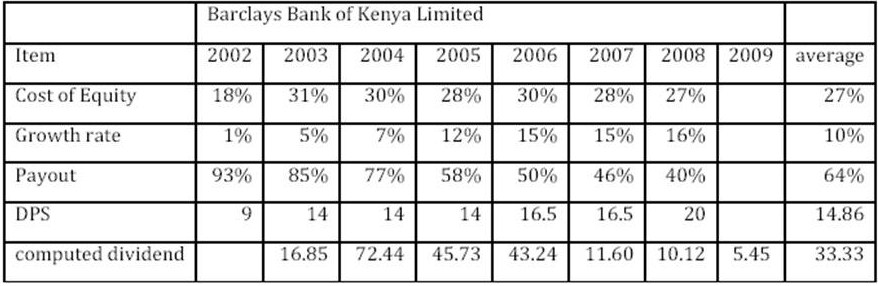
Table2: Barclays Bank of Kenya Limited
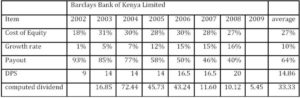
Barclays Bank of Kenya Limited had an average growth rate of 10% and the dividend per share was also fairly stable from Kes 9 in 2002 to Kes. 20 in 2008. However, the recomputed dividend forecast for 2009 shows a sharp decline to Kes 5.45 and this is not in line with the upward dividend growth rate trend.
Appendix II Pearson correlation is -0.57 showing that the as the dividend per share increases the recomputed dividend figure decreases. Appendix III shows that the distribution for Barclays Company is positively skewed and the degree of peak in the distribution for the kurtosis is 0.6 indicating that the tails are flatter with greater risk of extreme outcomes.
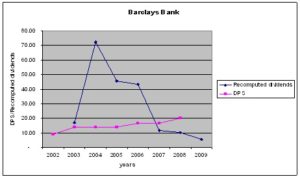
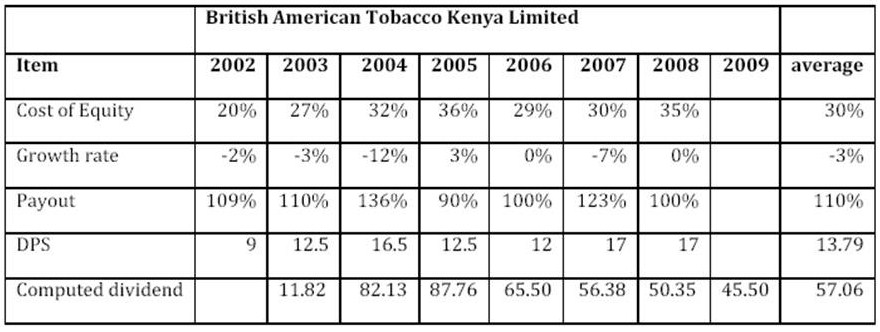
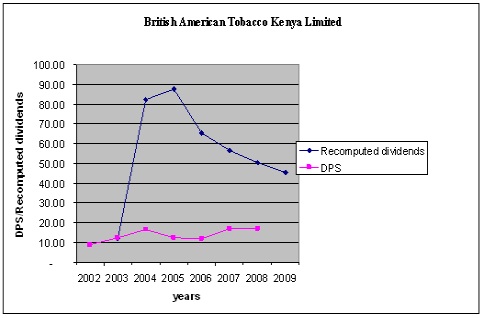
Table3: British American Tobacco Kenya Limited.

The payout percentage for British American tobacco Kenya limited for the period of the study averaged 110% indicating that no earnings were sufficiently retained. This is also supported by the negative dividend growth rate. The dividend per share remains constant at least within two years but is adjusted in the following year. The recomputed dividend mean is Kes. 57.06 indicating the dividend payable in 2009 will be Kes. 57.06 which is greater than the Kes 17 paid in 2008 by the company. The calculated t-value of 4.01 in Appendix II is higher than the t critical 2.57 indicating that there is a significant difference between dividend per share and the recomputed dividend. In Appendix III, the Pearson correlation coefficient is positively weak by 0.1 indicating that there is a slight increase in dividend per share as the recomputed dividend increases.
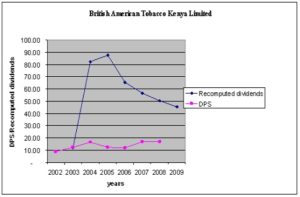
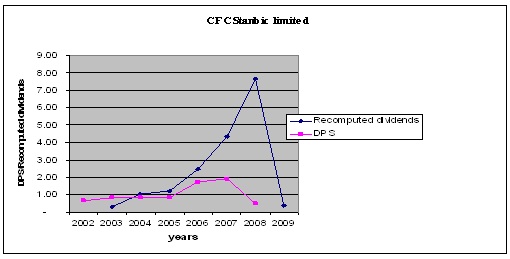
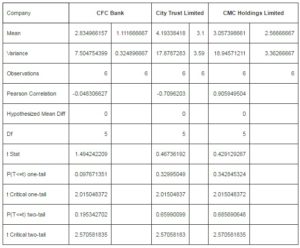
Table 4: CFC Stanbic Bank Limited
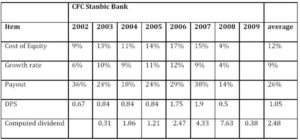
The average cost of equity is 12% while the dividend growth rate is 9%. This growth rate is reasonably stable as it is less than the cost of equity. The average dividend per share was Kes 1.05 while the recomputed figure for dividends stood at Kes 2.48. The kurtosis for CFC Stanbic Bank is above 3 indicating it is a leptokurtic distribution, hence, could yield higher dividends at increased risk. The two dividends distributions are strongly positively skewed at 1.86 hence indicating a strong association.
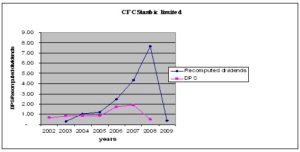
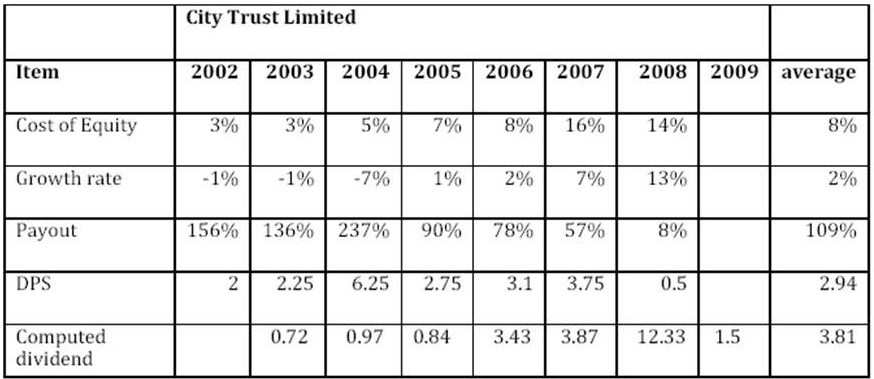
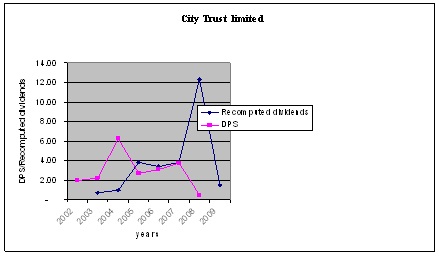
Table 5: City Trust Limited

City Trust Limited had a low dividend growth rate due to a payout ratio that is greater than the earnings up to the year 2004. This rate was however reduced from 2005 and a positive dividend growth rate was achieved. The dividend per share also had a swing in 2004 before stabilizing from 2005. The computed dividend trend was affected by the high payout ratio in the early years of study. The dividend forecast by the constant model is Kes. 1.5. In Appendix II the calculated t-value of 0.46 is lower than the t-critical of 2.57 indicating there is no significant difference between the dividend per share and the recomputed dividends.

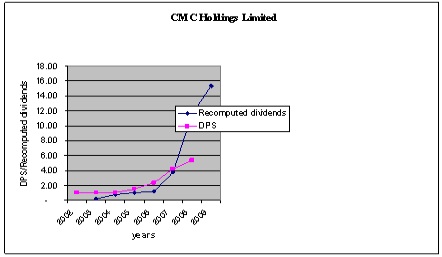
Table 6: CMC Holdings Limited
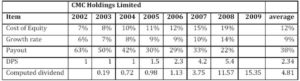
CMC Holdings Limited maintained an average of 38% payout over the period of the study. The dividend growth rate averaged at 9%, a rate lower than the required rate of return on equity. Both the dividend per share and the re-computed dividends have steadily been growing in line with the growth rate. In Appendix II the paired t-test indicates that CMC Holdings had a strong positive Pearson correlation of 0.9 implying the strong association of the two dividend data distribution.
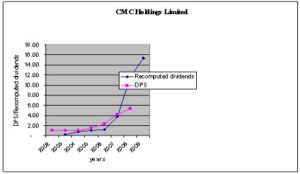
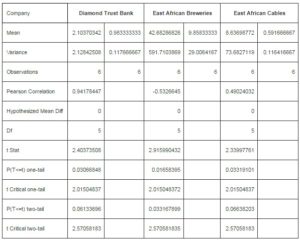
Table 7: Diamond Trust Bank (Kenya) Limited
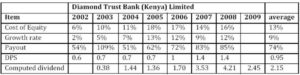
The company has a mean growth rate of 9% and the dividend per share has grown to an average of Kes 0.95 for the period of study. This is in line with the dividend model assumption that a firm pays out a gradually growing dividend stream and for this case almost three quarter of earnings for every year has been paid out. In Appendix II, the standard deviation for 6 year observation was significantly greater than zero, T stat of 2.4 , two tail p = 0.06, providing evidence that there is no significant difference between the dividend data for the two distributions.
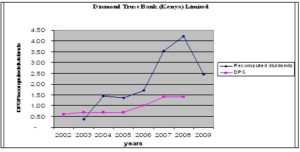
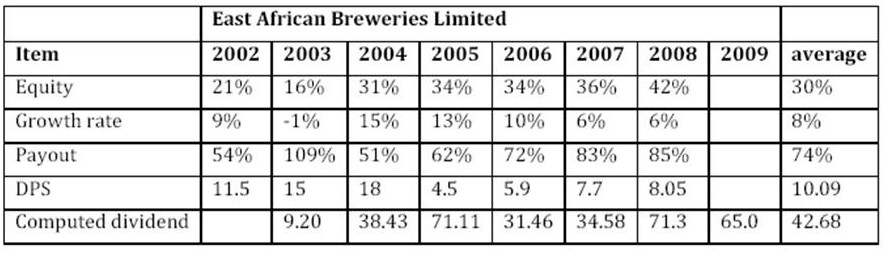
Table 8: East African Breweries Limited
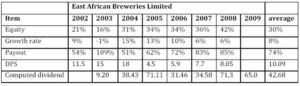
East Africa Breweries Limited had a very high payout ratio of 74% while maintaining a dividend growth rate 8 %. The dividend distributions of the two data sets are positively skewed at 0.9 as per appendix III implying that it is unlikely extreme reduction of dividends would be encountered by investors. At a standard error of 11.3, the dividend interval spreads from 3.9 to 61.7 implying that most of the figures for re-computed dividends fall within this range. The dividend payable for the year 2009 is estimated by the dividend model to be Kes 65.02. This can be explained by the general decline in price trend affected by the low price for the share in the market due to the current economic crisis.
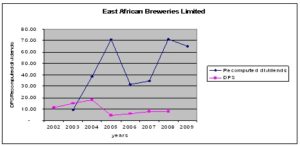
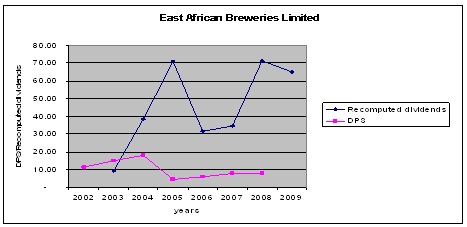
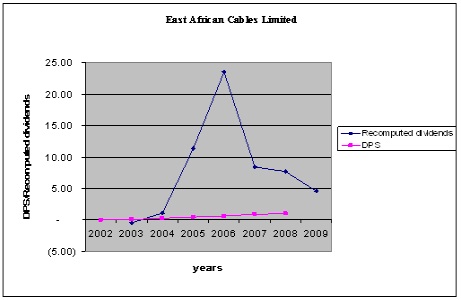
Table 9: East African Cables Limited
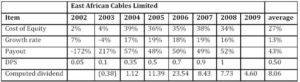
The company has a mean of 27% cost of equity and the dividend has been growing at an average rate of 13% for a 43% pay out. The dividend payable in 2009, as per the model, is Kes 4.60 though the dividends that ought to have been paid as per recomputed figures are quite different from the dividend per share. The company has maintained a fairly growing dividend per share.
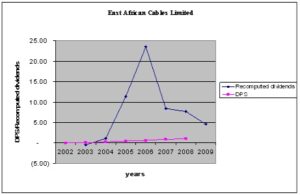
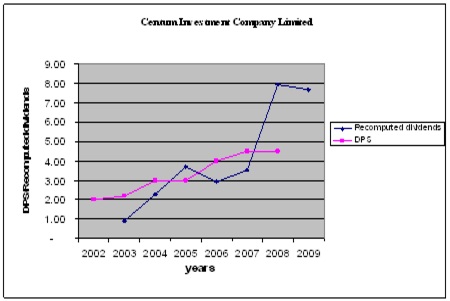
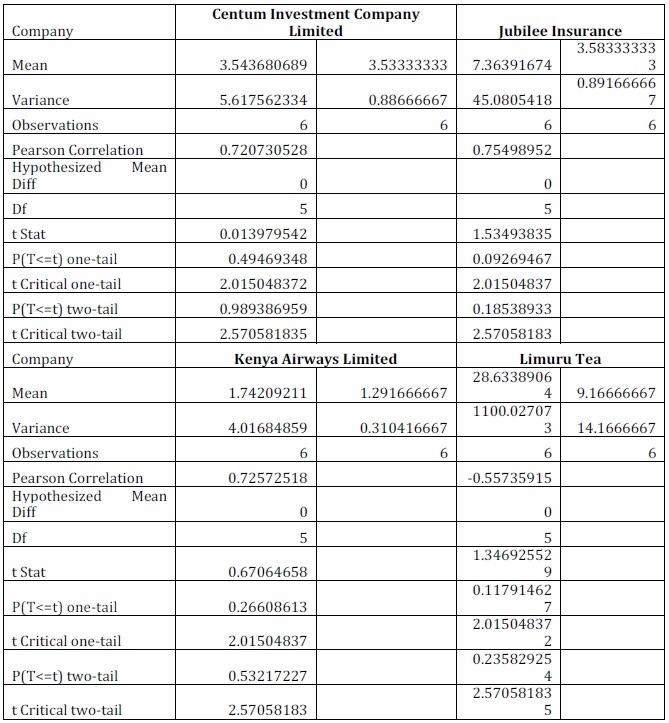
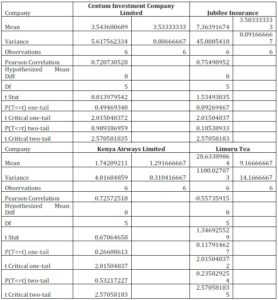
Table 10: Centum Investment Company Limited
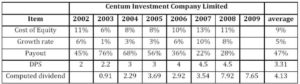
The company had a practice of paying on average half of its earning to the shareholders as dividends. Though the earnings fluctuate, the company maintained an average dividend growth rate of 5%. The shareholders’ average required return was 9 %. Dividend per share has been growing as indicated by the annual mean growth rate of 5%.
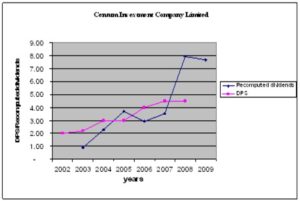
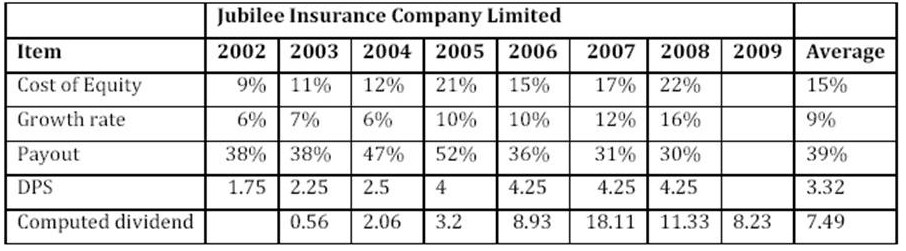
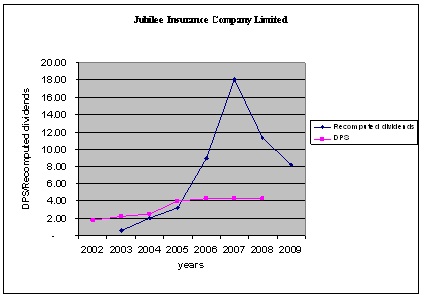
Table 11: Jubilee Insurance Company
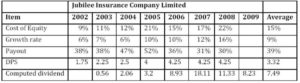
The dividend per share has been growing at an average of 9%. This is below the mean of 15% required rate of return by equity holders. This is in line with the assumption by the constant dividend model that the cost of equity should be greater than the growth rate for the model to apply. The company has maintained a payout of 39% but as the stock exchange moved from a bull run to the bear market the recomputed dividends figures have also been affected by that trend. This is shown by the rise of recomputed dividends figures in 2007 and the drop in 2008 and the forecast of a lower dividend payable in 2009.
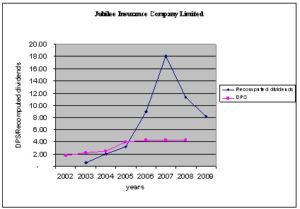
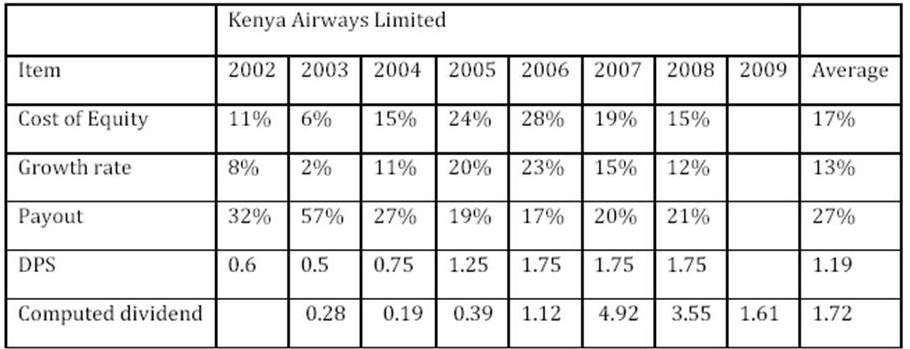
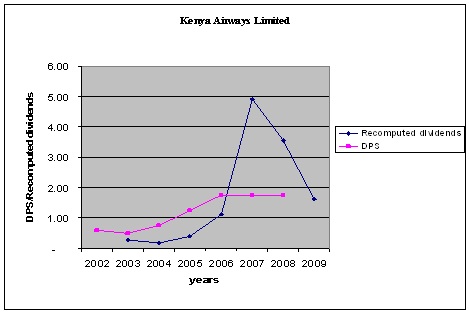
Table 12: Kenya Airways Limited
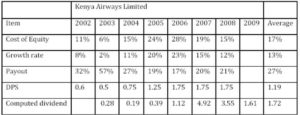
To achieve an average growth rate of 13%, the Company had a practice of retaining two thirds of yearly earnings for the period for the study. Though the firm has year-to-year swings in growth rates, the constant dividend model can be used to forecast the dividend payable without loss of generality. The dividends were smoothed even when earnings were volatile.
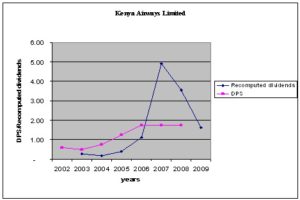
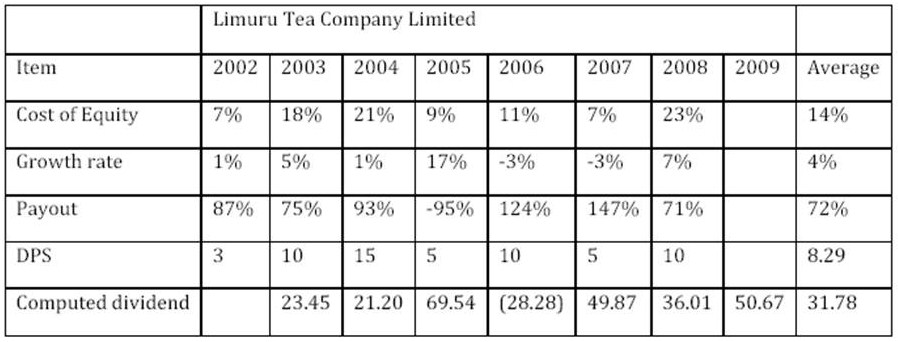
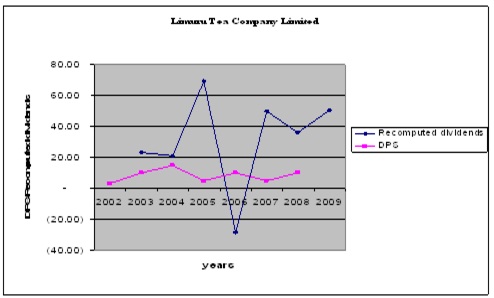
Table 13: Limuru Tea Company Limited
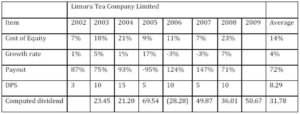
The dividend per share has a person coefficient of -0.56 as per appendix II implying that the association with the recomputed dividends is uneven from one year to another. The company has a high dividend payout ratio. The company has a policy to pay a high dividend in one year and adjust it lower the following year. The T calculated value is 1.34 which is lower than the T critical of 2.57 showing a significant difference between the divided per share and the recomputed dividend figures.

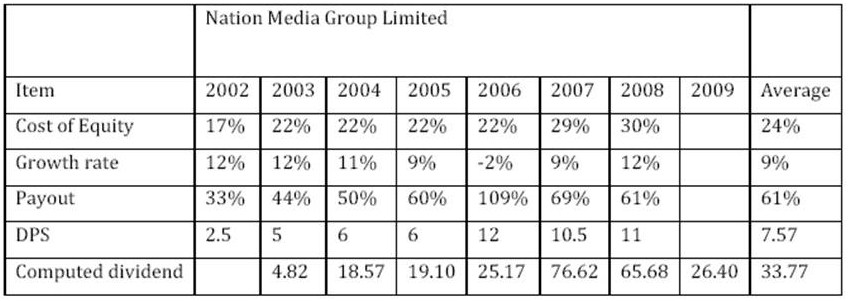
Table 14: Nation Media Group Limited

The company had an average of 61% payout ratio and a 9% dividend growth rate that resulted in dividend per share rising from Kes. 2.5 to Kes. 11 in 2008. The model predicts that a dividend of Kes .26.40 will be payable in 2009 if the current growth rate is maintained in the current year.
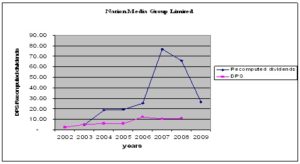
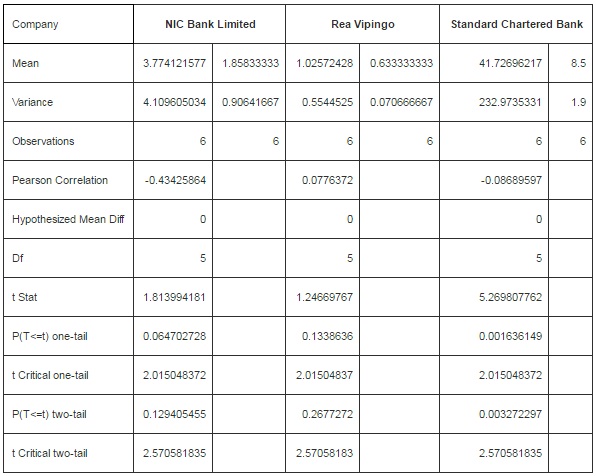
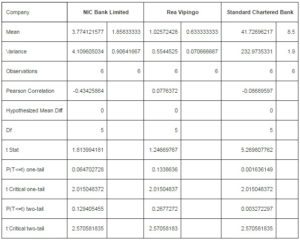
Table 15: NIC Bank Limited
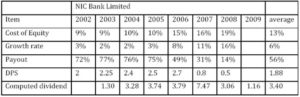
The average cost of equity was 13% as the company maintained a payout of 56% of the earnings. The dividend per share had the same trend as the recomputed dividend and forecasted dividend of Kes 1.16 for year 2009 is lower than the dividend for year 2008.
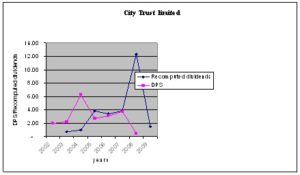
Table 16: Rea Vipingo
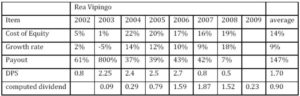
The average dividend per share stood at Kes. 1.70 which was higher than the dividend as per the model of Kes. 0.90. The company had a very high payout in 2003 that impacted high in smoothing the payout ratio for the period of the study. However, the average growth rate of the dividends was 9 percent. The kurtosis of the two dividend data distribution was – 2.3 indicating that it was normally distributed. 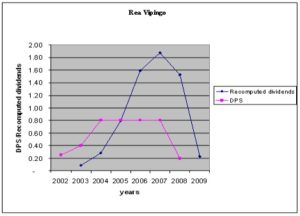
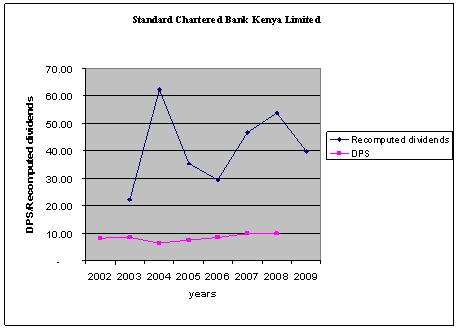
Table 17: Standard Chartered Bank Kenya Limited
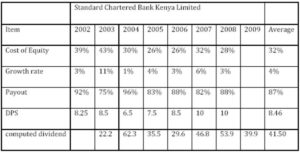
The dividend model indicates that a dividend of Kes 46.5 will be payable in 2009 as the company maintain the average of 4 percent dividend growth and a payout ratio of 87 percent. However, the re-computed dividend figures show a rapidly rising trend up to the year 2004 before a sharp decline in 2005 and 2006 while the dividend per share is fairly stable throughout the period of study
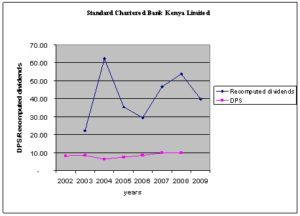
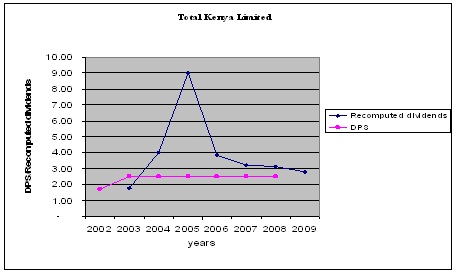
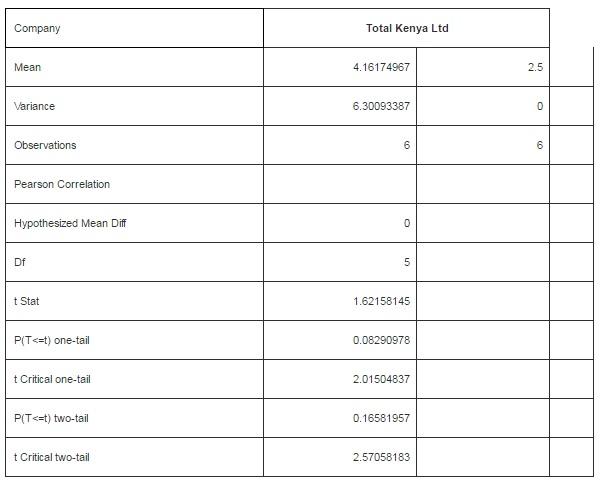
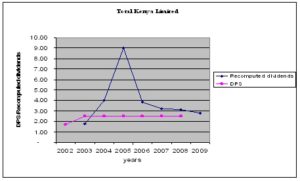
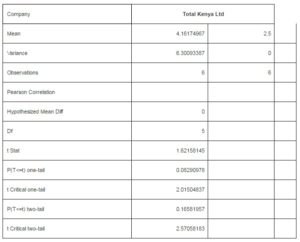
Table 18: Total Kenya Ltd
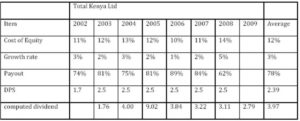
The recomputed dividend distribution is leptokurtic showing that there is a greater chance of extreme outcomes to the expectations of the investors. The dividend growth rate is low at an average of 3 percent and the dividend per share is maintained at the level of Kes 2.5 for six of the seven years of study. This is in line with the low dividend growth rate of 3 percent and a high payout ratio of 78 percent of the earnings for each year.
Summary, Conclusions and Recommendations
Summary and Conclusions
The objective of the study was to test the applicability of constant dividend model by companies listed at the Nairobi stock exchange. The main findings are presented in this section. The analysis involved re-computing dividends using the constant dividend model for each of the sampled 18 companies to derive the amounts that would have been paid out if the model was employed to determine dividends payout. The re-computed dividend figures were then compared to the dividend per share that was paid by each company.
The empirical results of the study show the dividend model was not applied by companies at the Nairobi stock exchange. Most of the companies maintained the dividend per share at the same level at least for 2 consecutive years. Barclays bank paid Kes.14 for year 2002 to 2005 while British American tobacco, Standard chartered bank, Bamburi Cement and Jubilee Insurance paid Kes 17, 10, 6 and 4.25 respectively for 2007 and 2008. Thus it can be concluded that the companies adopted the stable and predictable policy where a specific amount of dividend per share each year was paid periodically. This is consistent with Lintner (1956) argument that companies maintain stable dividend policies and adjust the level of dividends only after a rise in earnings appear sustainable. The study also established that some of the parameters of the dividend constant model i.e. the dividend growth rate, the market prices of the shares and the earnings from year to year influence the level of dividend paid. The dividend growth rate which ranged from 2% for City trust limited to 13% for East Africa Cables influenced the level of payout. This is consistent with the study by Pruitt and Gitman (1991) which suggests that factors such as current and past years’ profits, the year-to-year variability of earnings, the growth rate of earnings, and prior years’ dividends are important influences on the amount of dividends paid.
The study also established that there were other factors that influence the dividend policy of the companies listed at the Nairobi stock exchange. The empirical results indicate that there was a significant difference between the dividend per share as paid out and the re-computed dividends using the constant dividend model. The paired t tests performed for the companies indicate that the t calculated value of most of the companies lie extreme of the t Critical of 2.57. The dividend per share and the re-computed dividend amounts, using the constant dividend model, were uneven from one year to another and where there was a relationship it was insignificant. Thus, factors excluded in the dividend model could be related to Karanja (1987) findings that the most important determinants of dividend policy were cash, liquidity and the company’s earnings.
The study also found out that an increase in dividends was not necessarily followed by a decrease in risk. The cost of equity of most of the companies rose when dividends were adjusted upwards. This is inconsistent with Grullon, et al. (2002) conclusion that firms that increase dividends had a significant decrease in systematic risk while firms which reduced dividends incurred a significant increase in risk
Recommendations for Further Research
This study focused on the constant dividend model by companies listed at the Nairobi stock Exchange. A different study can be done to test the applicability of the two stage-growth model. A similar study can be carried out with a large population and a longer time period. This would assist to establish if with large population and a wider time span, the trend of application of the model could be existent. Also, the study focused mainly on the effect on the model on dividends. A further study can be done to find the role of the model in share pricing and business valuation.
(adsbygoogle = window.adsbygoogle || []).push({});
References
Abdul, F. (1993). ‘An Empirical Study to Identify Parameters Which are Important in the Determination of Dividends by Publicly Quoted Companies,’ Unpublished MBA Project, University of Nairobi
Allen, F. & Michaely, R. (1995). ‘Dividend Policy,’ R.A. Jarrow, V. Maksimovic and W.T. Ziemba (eds.). Handbooks in Operations Research and Management science: Finance 9, Amsterdam: Elsevier
Damodaran, A. (2006). ‘Valuation Approaches and Metrics: A Survey of the Theory and Evidence,’ Stern School of Business.
Google Scholar
Baker, H. K., Farrelly, G. E. & Edelman, R. B. (1986). ‘Corporate Dividends: Views of the Policy Makers,’ Akron Business and Economic Review, 17, 62 – 74.
Google Scholar
Barsky, R. B.& De Long, J. B. (1993). “Why Does the Stock Market Fluctuate?,” The Quarterly Journal of Economics, vol. CVIII, pp. 291–311
Publisher – Google Scholar – British Library Direct
Benartzi, S., Michaely, R. & Thaler, R. (1997). “Do Changes in Dividends Signal the Future or the Past?,” The Journal of Finance 52, 1007-1034
Publisher – Google Scholar
Bernstein, P. L. (1998). “The Hidden Risks in Low Payouts,” The Journal of Portfolio Management, Vol. 25, No.1, Fall, p. 1.
Publisher – Google Scholar
Bitok, J. (2004). ‘The Effect of Dividend Policy on the Value of the Firms Quoted at the Nairobi Stock Exchange,’ Unpublished MBA project, University of Nairobi.
Brealey, R. A. & Myers, S. C. (1991). Principles of Corporate Finance, 5th edition, Irwin-McGraw-Hill
Google Scholar
Brennan, M. (1971). “A Note on Dividend Irrelevance and the Gordon Valuation Model,” The Journal of Finance 26 1115 -1122
Publisher – Google Scholar
DeAngelo, H., De Angelo, L. & Skinner, D. J. (2000). ‘Special Dividends and the Evolution of Dividend Signalling,’ Journal of Financial Economics 57 (3). 309-354
Google Scholar
Fama, E .F. & Babiak, H. (1968). “Dividend Policy: An Empirical Analysis,” Journal of American Statistical Association.
Publisher – Google Scholar
Fama, E. F. & French, K. R. (2001). “Disappearing Dividends: Changing Firm Characteristics or Lower Propensity to Pay?,” Journal of Financial Economics 60 (1) 3- 43
Publisher – Google Scholar – British Library Direct
Gitman, Lawrence, J. (2006). Principles of Managerial Finance, 11th edition ed. Addison-Wesley
Gordon, M. J. (1959). “Dividends, Earnings and Stock Prices,” The Review of Economics and Statistics, Vol. 41 No.2, pp.99-105.
Publisher – Google Scholar
Graham, B., Dodd, D. & Cottle, S. (1962). Security Analysis, 1st Edition, McGraw-Hill, New York.
Grullon, G., Michaely, R. & Swaminathan, B. (2002). “Are Dividend Changes a Sign of Firm Maturity?,” The Journal of Business 75 (3). 387 – 424.
Publisher – Google Scholar – British Library Direct
Karanja, (1987). ‘Dividend Practices of Publicly Quoted Companies in Kenya,’ Unpublished MBA Project, University of Nairobi.
Kioko, M. (2006). ‘An Analysis of the Relationship between Dividend Changes & Future Profitability of Companies Quoted at the Nairobi Stock Exchange,’ Unpublished MBA project, University of Nairobi.
La Porta, R., Lopez-de-Silanes, F., Shleifer, A. & Vishny, R. W. (2000). “Agency Problems and Dividend Policies around the World“. The Journal of Finance 55, 1-33.
Publisher – Google Scholar – British Library Direct
Lee, C. M. C., Myers, J. & Swaminathan, B. (1999). “What is the Intrinsic Value of the Dow?,” The Journal of Finance 54, 1693–1741.
Publisher – Google Scholar – British Library Direct
Lintner, J. (1956). “Distribution of Incomes of Corporations among Dividends, Retained Earnings and Taxes,” The American Economic Review, May, pp 97 –113.
Publisher – Google Scholar
Litzenberger, R. H. & Ramaswamy, K. (1979).”The Effects of Personal Taxes and Dividends on Capital Asset Prices: Theory and Empirical Evidence,” Journal of Financial Economics, 7, 163-195.
Publisher
Marsh, T. A. & Merton, R. C. (1987). “Dividend Behavior for the Aggregate Stock Market,” The Journal of Business 60: 1-40
Publisher – Google Scholar
Mathur, I. (1979). Introduction to Financial Management, McMillan publishing company Inc. New York.
Publisher – Google Scholar
Miller, M. H. & Modigliani, F. (1961). “Dividend Policy, Growth and the Valuation of Shares,” The Journal of Business, vol. 34, pp. 411-433.
Publisher – Google Scholar
Muchiri, (2006). ‘Determinants of Dividend Payout; The Case of Listed Companies in Kenya,’ Unpublished MBA project, University of Nairobi.
Mundi, H. (2006). ‘The relationship between Earning Per Share and Dividend Per Share of Equities for Companies Listed at the Nairobi Stock Exchange,’ Unpublished MBA Project, University of Nairobi.
Njoroge, (2001). ‘A Study of Dividend Policies, Growth in Assets, Return on Assets and Return on Equity at the Nairobi Stock Exchange,’ Unpublished MBA project, University of Nairobi.
Pandey, I. M. (2005). Financial Management, 9th Edition, Vikas Publishing House, India
Pettit, R. R. (1972). “Dividend Announcements, Security Performance, and Capital Market Efficiency,” The Journal of Finance, 27 (5). 993-1007
Publisher – Google Scholar
Pruitt, S. W. & Gitman, L. J. (1991). “The Interactions Between the Investment, Financing, and Dividend Decisions of Major U.S. Firms,” The Financial Review 26 (3). 409-430.
Publisher – Google Scholar
Ross, Stephen, A. (1977). ‘The Determination of Financial Structure: The Incentive Signaling Approach,’ Bell Journal of Economics 8 (1). 23- 40
Google Scholar
Rozeff, M. S. (1982). “Growth, Beta and Agency Costs as Determinants of Dividend Payout Ratios,” Journal of Financial Research, 5 (3). 249-259.
Publisher – Google Scholar
Shefrin, H. M. & Statman, M. (1984). “Explaining Investor Preference for Cash Dividends,” Journal of Financial Economics, 13 (2). 253-282.
Publisher – Google Scholar
Tiriongo T. K. (2004). ‘Dividend Policy Practices of the Companies Listed at the Nairobi Stock Exchange,’ Unpublished MBA Project, University of Nairobi.
Van H. J. C. (2002). Financial Management and Policy, 12th ed. Pearson Education
Google Scholar
Wandeto, P. (2005). ‘An Empirical Investigation of the Relationship between Dividend Changes and Earnings,’ Unpublished MBA project, UON
Appendices
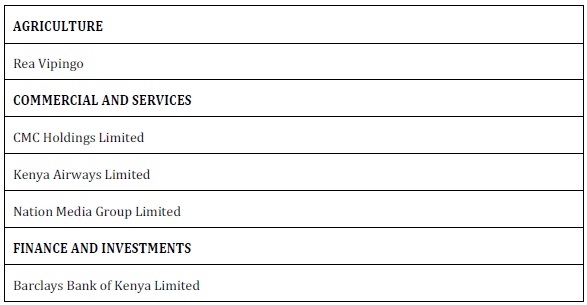
Appendix 1: Population
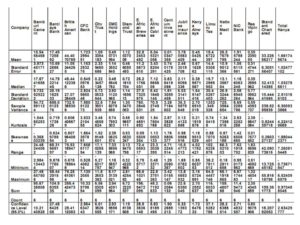
Appendix II: T-Test: Paired Two Sample for Means

Appendix III: Summary of Paired T-Test Difference Between Dividends Declared And Recomputed Figures
click on image for full scale table