Introduction
The data which provide the financial status for any business units are the most valuable information for the shareholders, investors and creditors (Kun Chang Lee and Jinsung Kim,1994; Abdelwahed and Amir, 2005; Nogueira and Sousa, 2005). In addition, the financial status aids in making a decision which varies to the different parties that have a specific propose from their nature (Kun Chang Lee and Jinsung Kim, 1994). Exactly, any single business unit cannot stand alone for running its’ duty. There are huge connections around its bend. So, it is true that a good financial status becomes from balancing the benefits between insiders and outsiders. The financial ratio is the best way which is generally accepted to measure the financial status of the firm (Altman, 1968; Abdelwahed and Amir, 2005; Nogueira and Sousa, 2005). It’s calculated by the financial technique, but the advantage of the financial ratio use is only limited to the financial specialists who are familiar with the financial analysis (Nogueira and Sousa, 2005). However, the financial analysis technique is a classic method for everyone who is familiar with it. Some cases found that the advice of the financial specialist abused the opportunity of the end-users. The factor which effects this situation the most is the specialist’s point of view. According to this, some hidden agendas of financial ratio analysis blind the specialist to the wrong choice and lead to a financial distress problem at last.
To eliminate the human’s error, this study tries to seek out the failure forecasting model which employs the financial ratio as the input data for the data mining technique. In addition, this study hopes that the created failure forecasting model should help the end-users to avoid the mistake of decision making which occurs in the different advisor’s opinions. This study selects the ANFIS technique which is the one of Neuro Fuzzy technique as the core technique for setting up the data mining process. Actually, it was built up from the combination of advantages between Fuzzy Logic and Neural Network (Tong Srikhacha, 2007). Moreover, the Neuro Fuzzy makes a better signal to predict the financial distress problem than the use of stand-alone Neural Network especially, the error level during the process of model construction (Huang Fu-yuan, 2008).
The forecasting model in this study uses a plenty of financial ratios to set up the symmetry procedure. To protect the error from the selection process, this study provides a GA technique as an attribute selection technique for reducing the error from this process. According to the previous researches, the attribute selection technique has an ability to decrease the error from the forecasting model (Abdelwahed and Amir, 2005; Huang Fu-yuan, 2008). In addition, the attribute selection technique also helps to downsize the input data (Borges and Nievola, 2005). Finally, the rate of accuracy of algorithm’s performance and learning ability are increased by this selection technique (Hall and Holmes, 2003; Borges and Nievola, 2005; Sukontip Wongpun and Anongnart Srivihok, 2008). Based on the best result of the previous study (Huang Fu-yuan, 2008), this study sets the acceptable range of the accuracy of the result from the forecasting model below 3.33 percent of type 1 error.
Related Theories
Attribute Selection
The attribute selection is one of the selecting procedures which select M attributes from data set which has N attributes. In addition, the attribute selection helps to reduce and ensure that the selected attributes have the sufficient quality and relevant information for processing (Borges and Nievola, 2005; Sukontip Wongpun, 2008). There are 2 essential stages of selecting attributes which are the attribute searching stage and evaluating set of attributes stage. The first stage, attribute searching, is used to find out the relevant attribute for preparing the next stage selecting. In this study, Generic Algorithm is employed to use as a selecting tool. The principle of Genetic Algorithm works by chromosome encoding, initial population, fitness function and genetic operator. The heart of the Genetic Algorithm is the genetic operator. With the genetic operator function, the attribute selection is constructed by cross over and mutation of data chromosome (Stein and Hus, 2005; Sukontip Wongpun and Anongnart Srivihok, 2008). According to the above, genetic operator is applied by GA in selecting processes as follow (Stein and Hus, 2005).
- Coding the dichotomous keys for population which are 0 for miss-use attribute and 1 for useful attribute.
- Setting the individual set for chosen attribute and recoding from the first stage again for all selected population.
- Evaluating the individual set and selecting the evaluated set which matches the condition of this study.
- Setting the new generation of individual set from the result of chromosome crossover and mutation within the attributed individual set. And
- Repeating the process for all individual set or attribute set to match all conditions of the study until every unit of data set is completely selected.
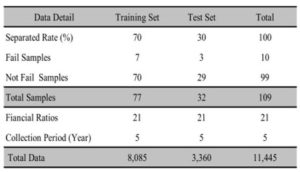
Another stage of attribute selection is the evaluating set of attribute which is used to evaluate the result from the first stage for setting the most appropriate set of attributes. Actually, in this stage, the system will not stop processing until the system finds the most suitable result from the selected attributes. This study introduces the CFS method to evaluate the set of attributes. The process of CFS is an evaluation technique which uses the relationship between selected set of attributes and level of inter relationship of the set of attributes. The higher relation with data classification and reversed internal relation of the set of attributes, the higher the merit score obtained from CFS. The evaluating score in the equation is firstly set by Fayyad and Irani (Hall and Holmes, 2003; Sukontip Wongpun and Anongnart Srivihok, 2008). The Merit score is calculated by the following equation:
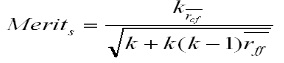
(1)
According to the above formula, Merits is the set of attributes S which includes selected k attributes. is the average of the selected set of attributes which are based on the type of data relation.
 is the average of the selected set of attributes which are based on the internal relation.
ANFIS
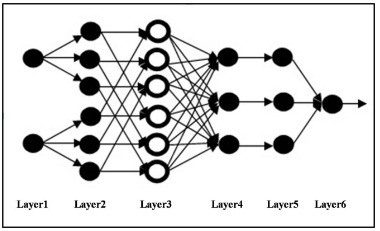
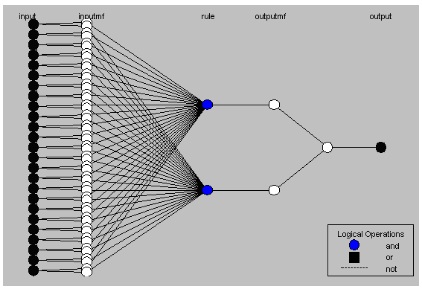
ANFIS is one of the applied techniques of Neuro Fuzzy, which is used to integrate the Artificial Neuron Network and Fuzzy Logic. In addition, ANFIS can balance the advantage and disadvantage of these techniques to raise the evaluating power for the system. To extend the capacity of ANFIS, it can learn and evolve from the data characteristic like Artificial Neuron Network. Furthermore, ANFIS can apply the if-then rule from the Crisp Logic decision as Fuzzy logic. The combination of these procedures makes the ANFIS close to human intelligence. To illustrate the benefit of the combination, the Artificial Neuron Network can remember and adapt the output from the data characteristic, but the Artificial Neuron Network cannot learn in-depth dimension. With this limitation of Artificial Neuron Network ability, ANFIS brings Fuzzy logic to compensate the inability of Artificial Neuron Network. Fuzzy logic can learn in-depth dimension, because it is developed from the dichotomous key critical path decision making (Tong Srikhacha, 2007). From the core concept of ANFIS, this technique has enormous layers components to evaluate the logic functions (Jang, 1993; Jang and Mizutani, 1997; Tong Srikhacha, 2007). The figure of layers components is as follows:
 Fig 1. ANFIS Model
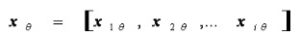
There are six layers of logic in the ANFIS model diagram. The first layer is the input layer. X stands for the data input which has n dimension. According to the equation, n is the number of dimension which is 1 ≤ I ≤ n. And θ is used for the ordinary number of testing data. The equation for the first layer is as follows:
 (2)
(2)
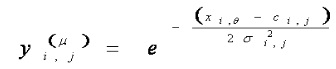
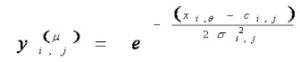
The second layer is the Fuzzification layer. This layer is performed by the Fuzzy valuation under the Gaussian membership function. With this layer, µ is used for the second layer output. In addition, this layer has multi-dimensions of data input. This study uses n for the dimension of input components and R is the amount of Fuzzy rule which is 1≤i ≤ n, 1≤ j ≤R. Furthermore, c and δ are used for means and class interval of Gussian membership function, respectively. Fuzzification equation is shown as:
 (3)
(3)
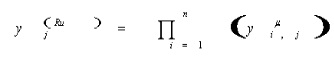
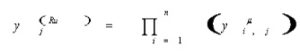
The third layer is the layer of Fuzzy rule. The processing of this layer is to combine the output of the second layer with the Fuzzy rule. The third layer equation is as follows:
 (4)
(4)
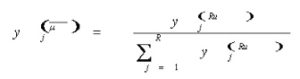
The next layer is the Normalization stage. This layer is occurred from the division between the third output and the summation of Fuzzy rules. The equation for this layer is as follows:
 (5)
(5)
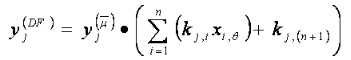
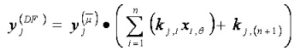
After Normalization stage, the Defuzzification layer is taking place for evaluating the result of sampling selection. With this layer, the result of the Normalization stage is multiplied with the parameter (k) from Moore-Penrose Pseudo Inverse Matrix as the multiplier factor. This matrix has the dimension equals R x (n+1). So, the formula of this layer is:
 (6)
(6)
The last layer is called the layer of Neuron Summarization or ANFIS output. This output is obviously revealed in the form of Fuzzy Sugeno function which is calculated by the input (Xθ) and the parameter ({k, c and δ}) from the function set. The form of ANFIS output can be presented as follows:
 (7)
(7)
Methodology
Data and Sample size
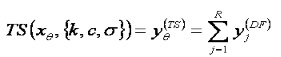
The sample of this study is listed companies in the Stock Exchange of Thailand. These companies are selected from two groups. The first group consists of a set of 10 fail companies, which has a Rehabilitation status: REHABCO under the Stock Exchange Commission’s declaration. And the other one consists of 99 normal companies, which are random samples from a list of companies that contain a rank of an average asset same as fail companies. Furthermore, this study uses the financial data of both groups during the year 2005 to 2007, and they are used to calculate 21 financial ratios for filling in the failure estimated equation (Gibson, 2007). Table 1 shows the lists of available ratios for this study.
Table 1: List of Available Ratios
Research Methodology
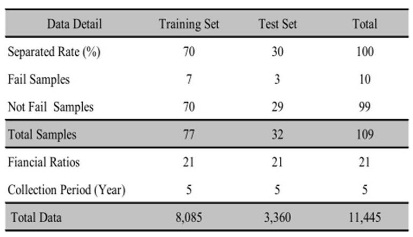
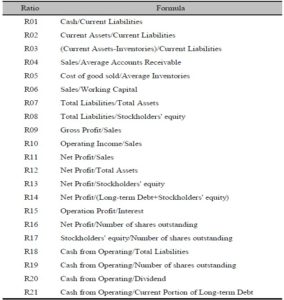
The data of this study is divided into 2 categories which are the Training Set and the Test Set under the proportion 70 percent and 30 percent,respectively.There are 7 REHABCO companies in the Training Set compared with 70 normal companies, but there are 3 REHABCO companies and 29 normal companies in the Testing Set. The classified data is shown in table 2.
Table 2: Training Set and Test Set Details
After identifying the sets of data, this study brings the Training Set to the Attribute Selection process by using the Genetic Algorithm method. When the selecting process is completed, the failure forecasting model is setting up from the ANFIS system by using Matlab 2009. Then, the forecasting models are evaluated by the Testing Set. During the evaluation process, the output of the process is strictly through 2 conditions which are the accuracy rate and the type 1 error. This type of error pulls the result of the testing into the missing fact. To illustrate, the result points out that this company still in the normal status, in fact, this firm encounters the failure status (Altman, 1968). In addition, this type of error directly affects decision making.
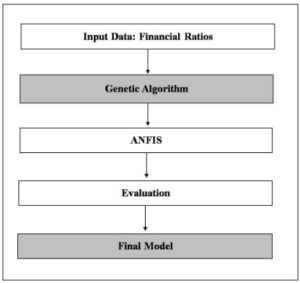 Fig 2. Framework of Study
Result
Actual Model
GA-ANFIS can truly construct the forecasting model for the failure operating of Thai enterprises. With the internal algorithm, ANFIS can learn and create the learning rules from input data and a target attribute for evaluating the forecasting model. Finally, the result of the target attribute possibly occurs for 2 values which are 0 for the financial distress and 1 for the normal situation.
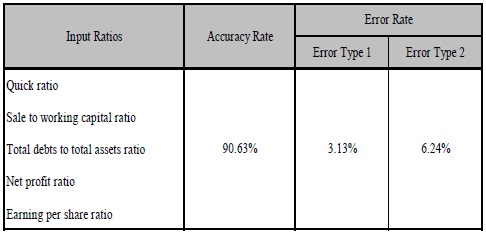
This study points out that the GA-ANFIS selects 5 financial ratios for the representative of financial distress indicator in the failure forecasting model. These 5 financial ratios are quick ratio (R03), Sale to working capital ratio (R06), Debt ratio (R07), Net profit margin ratio (R11), and E.P.S. ratio (R16). In addition, there are 2 learning rules of a final model that the GA-ANFIS can learn and adapt from this data characteristic. Furthermore, the system selects the attribute from all study attributes with total amount of 25 attributes from 5 ratios and 5 years of grouping data. Finally, there is only one target attribute which is selected by the GA-ANFIS selection. Figure 3 shows the final model’s rule for this study.
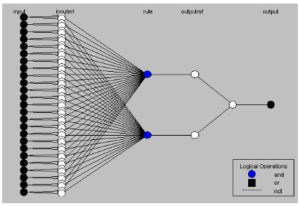 Fig 3. Learning Rule of GA-ANFIS
Result Analysis
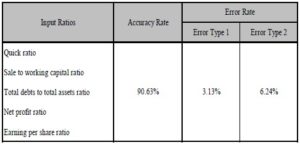
Table 3 summarizes the result of the GA-ANFIS model on Thai enterprises failure prediction. The Testing Set provides the accuracy rate of failure forecasting model from GA-ANFIS which is 90.63 percent, the type 1 error equals 3.13 percent and has 6.24 percent of type 2 error rate.
Table 3: GA-ANFIS Model Details
Moreover, actual data of all fail companies during the time after developing model, from year 2008 to the end of the year 2009, are used for testing finalized GA-ANFIS model. The result of estimation from this model shows the output that there are 6 companies from these samples encounter financial distress. Surprisingly, these 6 firms are 6 from 7 companies which face the failure operation in the real situation.
Conclusion
According to the objective and assumptions of the study, the result points out that the failure forecasting model from GA-ANFIS exactly works for the Thai enterprises with a high accuracy rate and lacks influencing type 1 error for the finalized model which significantly affects the decision making of the user. Finally, the forecasting model from GA-ANFIS can be used in the real situation with high confidence from the strong evidences in this paper.
(adsbygoogle = window.adsbygoogle || []).push({});
References
Abdelwahed, T. & Amir, E. M. (2005). “New Evolutionary Bankruptcy Forecasting Model Based on Genetic Algorithms & Neural Network,” Proceedings of the 17th IEEE International Conference on Tool with Artificial Intelligence, ISBN: 0-7695-2488-5, Hong Kong.
Publisher
Altman, E. I. (1968). “Financial Ratios, Discriminant Analysis and The Prediction of Corporate Bankruptcy,” The journal of Finance, 23(1). 589-609.
Publisher – Google Scholar
Borges, H. B. & Nievola, J. C. (2005). “Attribute Selection Methods Comparison for Classification of Diffuse Large B-Cell Lymphoma,” Proceedings of the Fourth International Conference on Machine Learning and Applications, ISBN: 0-7695-2495-8.
Publisher – Google Scholar
Gibson, Charles, H. (2007). Financial Reporting and Analysis, Thomson South-western, Ohio.
Publisher – Google Scholar
Hall, M. A. & Holmes, G. (2003). “Benchmarking Attribute Selection Techniques for Discrete Class Data Mining,” IEEE Transaction on Knowledge and Data Engineering, 15(6). 1437-1447.
Publisher – Google Scholar – British Library Direct
Huang F.-y. (2008). “A Genetic Fuzzy Neural Network for Bankruptcy Prediction in Chinese Corporations,” Proceeding of the 2008 International Conference on Risk Management & Engineering Management, ISBN: 978-0-7695-3402-2, Beijing, 542-546.
Publisher – Google Scholar
Jang, J. S. R., Sun, C. T. & Mizutani, E. (1997). Neuro-Fuzzy and Soft Computing: A Computational Approach to Learning and Machine Intelligence, Prentice-Hall.
Publisher – Google Scholar
Jang, S. R. (1993). “ANFIS: Adaptive-Network-Based Fuzzy Inference System,” IEEE Transaction on System, Man and Cybernetic, 23 (3). 665-685.
Publisher – Google Scholar – British Library Direct
Kun Chang Lee & Jinsung. Kim. (1994). “Hybrid Neural Network-Driven Reasoning Approach to Bankruptcy Prediction: Comparison with MDA, ACLS and Neural Network,” Proceeding of IEEE World Congress Computational Intelligence, ISBN: 0-7803-1901-x, Orlando, Florida, 1787-1792.
Publisher – Google Scholar
Nogueira, R., Viera, S. M. & Sousa, J. M. C. (2005). ‘The Prediction of Bankruptcy Using Fuzzy Classifier,’ Proceedings of Computational Intelligence Method and Application, ISBN: 1-4244-0020-1, Istanbul.
Srikhacha, T. (2007). ‘Short-Term Prediction in Stock Price Using Hybrid Optimized Recursive Slope Filtering, Adaptive Moving Approach and Neurofuzzy Adaptive Learning,’ PhD thesis, Department of Information Technology, King Mongkut”s Institute of Technology North Bangkok, Thailand.
Stein, G., Chen, A., Wu, A. S. & Hua, K. A. (2005). “Decision Tree Classifier for Network Intrusion Detection with GA-based Feature Selection,” Proceeding of the 43rd ACM Southeast Conference, ISBN: 1-59593-059-0, Kennesaw, Georgia, 136-141.
Publisher – Google Scholar
Wongpun, S. & Srivihok, A. (2008). “Comparison of Attribute Selection Techniques and Algorithms in Classifying Bad Behaviors of Vocational Education Students,” Proceedings of 2008 Second IEEE International Conference on Digital Ecosystems and Technologies, ISBN: 978-1-4244-1489-5, Phitsanulok, Thailand, 526-531.
Publisher – Google Scholar
Wongpun, S. (2008). ‘Comparison of Attribute Selection Techniques and Algorithms in Classifying Mistaken Behaviors of Vocational Education Students,’ Master of Science thesis, Department of Computer Science, Kasetsart University, Thailand.