Introduction
The first years of the 21st century have been marked by the globalization and liberalization of financial markets. The creation and development of multinational organizations has determined the need to ensure an informational balance between the stakeholders and shareholders, as well as to establish rules for the correct achievement and process of financial reporting. The production practices of financial-accounting information have evolved in time. The pressures of the financial market have lead to favoring communication in terms of financial value. The accent placed on the requirements of the financial market has determined opportunistic behaviors, oriented towards using the tricks of creative accounting or of fraudulent practices. These practices have caused conflicts of interests within the chain between the production and the usage of financial-accounting information by the investors. In order to restore the confidence in the well functioning of the financial markets and in financial-accounting information and in order to render the mechanisms of “corporate governance” more effective, as mentioned by Le Roy and Marchesnay (2005), financial market authorities have been created, having the role of strengthening the supervision of the quoted companies and the efficiency of the control of the information provided to the financial market, financial reporting standards have been suggested at an international level, the role of financial-accounting regulators has increased on both shores of the Atlantic, which rule over: the information duties of the managers of the quoted societies, punishment by criminal law of accounting manipulations, improving the prestige of the auditor function through the creation of new “control instances”, so that the investors can become confident in the independence, integrity, and ethics of financial auditors.
The theory of the agency meets these requirements, and Hayes (2005) suggests a series of solutions for reducing informational asymmetry. In Barker’s opinion (2010), managers are regarded as agents, guided by more or less formal contracts, for a responsible and effective management of the resources of the stakeholders (shareholders, commercial and financial creditors, employees, the State, and other commercial partners), with the purpose of creating added value.
One of the means that have enabled the negative influence of informational biais between the agents and the shareholders has been through the promotion and adoption of the concept of corporate governance. Zabihollah (2007) defines corporate governance starting from the suggestion of the Cadbury Committee, as a system through which companies are managed and controlled. The importance of this concept also comes from the perspective of the political, economic, and social effects generated by the great financial frauds and scandals, so that this topic is still present, and Hayes (2005) triggers discussions on the transparency, correctness, security, and ethics of the acts of corporate governance.
The role of financial audit, from the perspective of the theory of agency, is to ensure the quality of the reported financial information, according to the criteria formulated in the International financial reporting standards (IAS-IFRS) and in the International standards on auditing (ISA) (2009). In his book, Hayes (2005), argues that the Theory of Inspired Confidence, the Lending Credibility Theory and, last but not least, the Policeman Theory are the fundamental pillars in justifying the presence of financial audit as an informational regulator between the “actors” of the business environment, a certifier, and a vector for the prevention and detection of financial fraud.
For its mission, according to ISA 500 (2009), the financial auditors use techniques and procedures specific to their methodological approach, in order to obtain the audit evidence necessary for issuing the audit analysis. As analytical procedures, ISA 520 suggests ratio analysis (for liquidity, solvability, profitability, for financial balance) that may provide precious information to the auditor, through a comparison of customer data with branch data and with data determined by the customer or foreseen by the auditor.
Conceptual Approaches Regarding Financial Fraud
In their work, Walton and Kimball (1916) acknowledge fraud detection as one of the main objectives of the financial auditor. According to ISA 240 (2009), one of the main responsibilities of the auditor is performing their audit mission so as to obtain a reasonable insurance of the accuracy of financial statements and of the fact that they are not corrupted by omissions or frauds. According to Bragg (2010), fraud is an intentional act of significant distortion of financial statements subject to auditing, with the purpose of obtaining certain unworthy benefices or of hiding certain non-conformities (Statement on Auditing Standards 99 – SAS 99).
All along their mission, financial auditors will have to use professional skepticism, to identify the possible risks on which fraud may rely, to understand the business environment of the company, and to evaluate the control mechanisms that may eliminate the distortions of financial statements or assets misappropriation, according to ISA 240 (2009). Gallet (2010) presents the differences between accounting errors, which occur unintentionally, and financial fraud, which is a voluntary action through which one or several persons in charge with governance, employees, or third parties resort to a series of deceiving acts in order to obtain an illegal or unworthy advantage. Therefore, financial fraud will encompass three main elements: a voluntary action, dissimulation (a wish to hide the facts), and an operation method.
In their work, Singleton &Co. (2006) present the factors that determine financial fraud as a fraud triangle, a name given in a study made in the 1950s by Donald Cressey, a member of ACFE (The Association of Certified Fraud Examiner). Gallet (2010) distinguishes three types of fraud, according to ACFE: fraud on financial statements, misappropriation of assets, and corruption acts. From the point of view of financial auditing, ISA 240 only acknowledges two categories: fraudulent reporting and the illegal appropriation of assets, a classification that is also recognized in SAS 99.
Of the main normative acts that have come to counter-attack the great financial fraud at the international levels, we can mention The Sarbanes-Oxley Act 2002. Gallet (2010) mentions, among the measures imposed by this law, the following: the creation of an audit committee at the organizational level, the managers’ responsibilities to provide non-erroneous financial statements, and the existence of control. A series of reports regarding corporate fraud are also known, from which we can mention, according to Silverstone and Davia (2005), the report of the Treadway Commission, through which the control system of the COSO (Committee of Sponsoring Organizations) is adopted and implemented, a system meant to fight against financial fraud. Moreover, the fight against fraud initiated within organizations can be considered an effective means of elimination. To this end, organizations must adopt best practices codes, promote ethical values, and correctly inform every stakeholder.
The Usage of Diagnostic Analysis in Financial Audit
Financial-accounting information has the specificity of a public good, whose role goes beyond keeping track of past transactions and evaluating the patrimony of the organization. It plays an essential part in the design of business contracts, in the process of value creation for the shareholders, in the process of “social corporate governance”, contributing to the representation of the relationships that are formed between the company and its stakeholders.
In the production chain of financial-accounting information, numerous social “actors” intervene (managers, administrators, auditors, financial analysts, regulators, etc.) who, under the influence of ever stricter regulations, bear the responsibility of the pertinence of the information provided to the stakeholders. The diagnosis analysis creates the premises for the companies to act in a transparent manner in their relationship with the business partners, in order to ensure credibility in communicating information, with an accent on clearly stressing the connection between the three fundamental components of sustainable development: economic, social, and environmental (the Triple Bottom Line).
The diagnosis analysis is the approach that evaluates the functioning status (performances, financial position, risks, development potential, etc.) of an organization, in relation with the evolution of the environment in which it operates. It meets the increasing demands for information of the competing business environment. Through its cognitive nature, the diagnosis analysis directs the manager in the process of decision design, evaluation, and control and increases their knowledge regarding the main management variables. Practically, organizational diagnosis is included in the sequence: information – analysis – judgment – prognosis. The diagnosis analysis requested for information purposes creates advantages for those who are better informed, that is, it generates power effects on the users of the information derived from the diagnosis and on the diagnosed organization.
The diagnosis analysis is the preliminary stage in establishing the value of a business, through which the investor who buys the company can know in detail the potential of the company, its resilience and flexibility when confronted to changes, the emergency measures to be taken after the acquisition (reorganization, staff recruiting, solving lawsuits, etc.), and the real development prospects of the purchased company. The diagnosis analysis also meets the precise requirements of other direct or indirect participants in the activity of the organization (employees, creditors, customers, providers, financial analysts, auditors, legal bodies, etc.) that may require a detailed or selective diagnosis of the activity of an organization, based on the information needed to evaluate management performance and organizational value.
At the same time, the diagnosis analysis can be a mean through which auditors can prevent unpleasant surprises, because, through this approach: organizational dysfunctions are discovered based on symptoms; the factors and events that have caused the insufficiencies and risks that may affect the organization in the future are identified; the “key actors” directly or indirectly connected to the actions that have lead to these dysfunctions are tracked.
The techniques of the discriminant analysis are the main operational instruments used by the diagnosis analysis to predict the risk of financial fraud. These techniques transform the information obtained through economic-financial indicators into a “critical score”, used to evaluate the absence or existence of fraud within the organization.
The diagnosis of the quality of financial statements presupposes analyzing and detecting the possible errors made at the reporting level. In this approach, as Penman mentions (2007), the financial auditor can use a series of financial rates that will signal these errors, inconsistencies, or speculations made through accounting tricks such as manipulating sales, the exploitation expenses, the assets level, debts, and of the own capital.
Research Methodology
The great financial frauds have brought along not only negative effects at the social and economic level, but have also determined a series of legal measures, such as those mentioned above, and the creation of studies based on the means of eliminating them. Therefore, Glover and Aono (1995) suggest mathematical models for measuring the fraud detection risk, Karim (1998) presents the signal detection theory as a work methodology in the detection of managerial fraud by financial auditors, and Hemraj (2002) describes an entire approach, according to SAS, for tracking inconsistencies at the corporate level. Law (2004) deals with the problem of improving the usage of analytic procedures by the auditors in detecting errors and fraud at the level of all the transactions, as well as with the importance of computer simulations in their examination and analysis, and Kaminski, Wetzel, and Guan (2004) prove the relevance of using financial rates in detecting fraudulent financial reports.
In this article, we aim at studying the connections between the various financial rates and the presence or absence of fraud at the organizational level, as well as quantifying the dependency between these rates and the level of fraud. Therefore, we will try to obtain a score function for tracking fraud, as well as a mathematical model for determining the fraud level, according to a set of indicators.
Work Hypotheses
In order to be able to point out a significant connection between a series of financial rates and the presence or absence of organizational fraud, as well as the level of fraud, in this article we will test two work hypotheses:
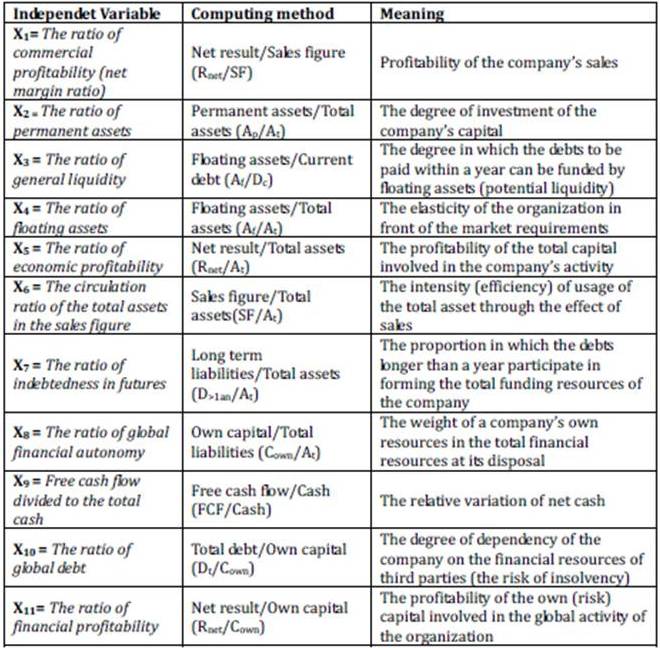
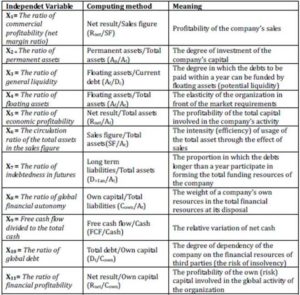
a) The existence of interdependencies between a series of rates (independent variables) and the financial fraud that can be achieved within an organization and determining the most significant rates in order to build a mathematical model called a score function, which provides the financial auditor with a set of information for the detection of financial fraud. The score function will have the form : Y = a1 × X1 + a2 × X2 + … + a11 × X11, where Y is the dependent variable of the suggested model and will take on the values 1 – Companies subject to fraud and 0 – Companies where no fraud has been committed and Xi (with i = 1:11) represent the independent variables, the rates used in the diagnosis analysis (Table no. 1.). The weighing coefficients of each ratio, ai (cu i = 1:11), are the unknowns of the suggested mathematical model.
Table 1: The Meaning of the Independent Variables
Starting from the classification of financial fraud, made by the international standards of financial auditing (ISA 240 and SAS 99), the rates used in this analysis will establish a direct connection between this taxonomy and the elements that will be tested in order to prove the existence of dependencies. Therefore, for fraud cased by the misappropriation of assets, we will mainly test the rates that include floating, permanent, or total assets, and for fraud cased by fraudulent reporting we will test both the rates based on elements related to the gross or net financial result and those based on the structure of the own capital, of debt, of the reported cash flows (knowing that these elements are often subject to financial manipulations in order to illustrate a statement favorable for the company).
b) Testing the existence of a connection between the rates in the previous model and the fraud value (computed as a relative level in relation with the sales figure and total assets). A function will be obtained, of the form:
Fraud value = b1 × X1 + b2 × X2 + … + b11 × X11+ Const,
where
Xi (with i = 1:11) represents the analyzed rates
bi (with i = 1:11) represent the coefficients of the model (unknown factors)
Const – constant.
The analysis has been applied to a sample made up of 65 companies quoted in the Stock Exchanges of the United States of America, UK, France, and Germany, as follows: 54% industrial organizations (manufacture, extraction, machine construction, pharmaceutics, foods), 29% service organizations, 14% sales organizations, and only 3% construction organizations.
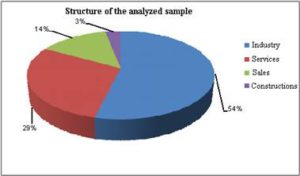
Fig 1. Structure of the Sample According to Activity Fields
From the perspective of the existence of fraud according to ISA 240, in the analyzed sample, we can notice that from the total number of analyzed organizations, in 54% of the cases no financial fraud has been signaled, in 26% of the cases fraud has been detected caused by fraudulent reporting, and in 20% of the cases, the fraud was caused by asset misappropriation.
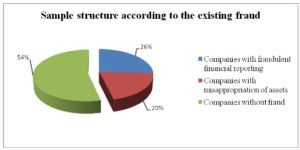
Fig 2. Structure of the Sample According to Fraud Existence and its Type,
According to ISA 240 and SAS 99
In order to prove the hypotheses, the work method will be the discriminant analysis, and the sample has to be made up of the data for two comparable sets of organizations: a group where no fraud has been detected and another group of companies in a difficult situation, that is, companies that have been subject to fraud. In what concerns the calculus of the variables, we have used information from the financial statements presented on the websites of the stock exchanges (London Stock Exchange, Paris Stock Exchange, New York Stock Exchange, NASDAQ) for the fiscal year 2008, for the companies where no fraud has occurred, and respectively for the fiscal year when the financial statements have been discovered and corrected for the companies subject to fraud. In order to obtain the coefficients of the score function and the regression equations, we will use the statistical tool SPSS 15.0.
Results Interpretation and Building the Models
After processing the sample data, the most important results are the ones referring to the coefficients of the score function. According to the study made by Jaba and Robu (2009), the number of discriminant functions has to be one unit smaller than the minimum between the number of groups and the number of independent variables: no. discriminant functions = [min (no. independent variables; no. of groups)-1] 1 = min(11;2)-1). Also, the value of Wilks’s Lambda statistics (WL = 0.25) of the obtained function points out a significant discrimination from a statistic perspective, where WL is the ratio between the variation within the group and the total variation at the sample level (within and outside the classigication groups).
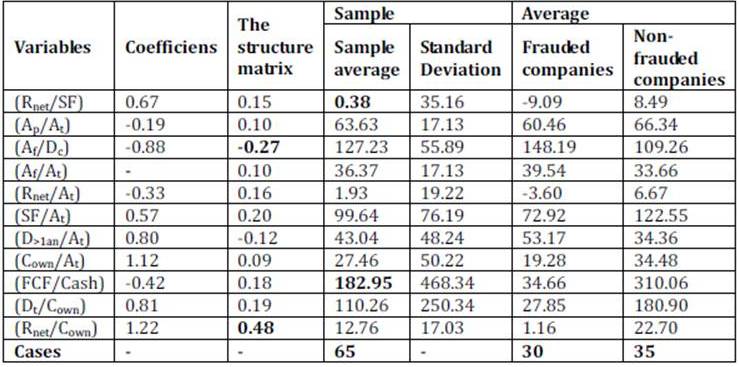
Table 2: Coefficients – The Structure Matrix, Descriptive Statistics and Group Statistics
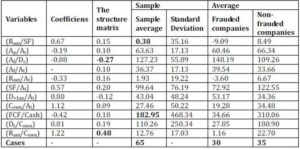
Table 2 presents the influence of each independent variable upon the suggested mathematical model. The meaning is given by the sign of each coefficient, and the impact is given by the module value of the coefficients. Therefore, after processing the data, we can notice a significant and positive influence of The ratio of financial profitability (Rnet/Cown) – with a coefficient of 1.22, as well as of The global financial autonomy ratio (Cown/Lt ) – the coefficient having the value 1.12 (the closer the values of these rates are to the maximum, the more they will determine the belonging of a company to a group where fraud has been committed), but in a negative way a significant influence is manifested by The ratio of general liquidity (Af /Dc ), with a coefficient of –0.88 (maximum values of this ratio indicate the inexistence of fraud within the organization).
Cannonic coefficients are at the basis of the mathematical model of the score function, which has the following form, according to the suggested work hypothesis:
Fraude Score = 0.67 x(Rnet/SF) –0.19 x(Ap/At ) –0.88 x(Af/Dc) –0.33 x(Rnet/At) +0.57 x(SF/At) +0.80 x(D>1an /At) +1.12 x(Cown/At) –0.42 x(FCF/Cash) +0.81 x(Dt /Cown) +1.22 x(Rnet/Cown).
Also, the correlations between each independent variable and the discriminant function are stressed using The structure matrix. These connections are stronger as the values of The structure matrix section are closer to +/- 1, and the respective variables significantly influence the score corresponding to the company. Therefore, based on the analyzed sample, we can notice that no variable significantly influences the score function, the values of The structure matrix being under +/- 0.5. However, the Af /Dc ratio may determine the inclusion of the companies in the category of those where fraud has been detected, while the Rnet /Cown ratio will determine the inclusion of the companies in the category of those with no fraud.
In order to test the existence of a dependency between the value of the fraud and the analyzed rates, it is necessary to present, according to Table 2, the average values corresponding to each economic rate, at the level of the entire sample, as well as the value dispersion in relation to the average. For instance, for the analyzed sample, the lowest average value is that of The commercial profitability rate, of 0.38, while the maximum value of 182.95 is reached by (FCF/Cash).
The subsection Group Statistics of Table 2 presents, for each independent variable analyzed, the average value corresponding to the two analyzed groups. We can notice significant differences between the two groups, especially at the level of the rates computed based on the net result, as one of the most common types of fraud is related to fraudulent financial reporting, often by the manipulation of the net result of the fiscal year. The table also shows the number of validated cases for each class. Therefore, while the class of Companies subject to fraud contains only 30 companies, the class of Companies not subject to fraud includes 35 companies.
Table 3: Coefficients of the Classification Functions
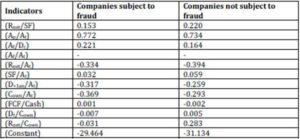
The discriminant analysis is also used for predictive purposes, in order to make a classification of the companies that do not belong to the analyzed sample, according to the two groups suggested in the work hypothesis. For this, according to the coefficients in Table 3, discriminant functions are obtained (linear equations) for each individual class. For the class of Companies subject to fraud, the score function is of the type:
Score of the Companies Subject to Fraud = 0.153 x(Rnet/SF) +0.772 x(Ap/At) +0.221 x(Af/Dc) – 0.334 x(Rnet/At) +0.032 x(SF/At) –0.317 x(D>1an/At) –0.369 x(Cown/At) +0.001 x(FCF/Cash) –0.007 x(Dt/Cown) –0.031 x(Rnet/Cown) –29.464, while for the class of Companies not subject to fraud, the score function has the following form:
Score of the Companies not Subject to Fraud = 0.220 x(Rnet/SF) +0.734 x(Ap/At) +0.164 x(Af/Dc) –0.394 x(Rnet/At) +0.059 x(SF/At) –0.259 x(D>1an/At) –0.293 x(Cown/At) -0.002 x(FCF/Cash) +0.005 x(Dt/Cown) +0.283 x(Rnet/Cown) –31.134.
Based on the mathematical models specific to the two groups, the score of each function obtained above is computed for the companies that are not part of the sample but wish to be included in one of the two groups. The higher value of the two obtained will determine the inclusion of the organization in the category with or without risk of fraud.
According to Table 1 from Appendix, between the fraud value and the analyzed rates there is a connection synthesized through equations, whose coefficients are presented in Table no. 5, according to the ratio between the fraud and the sales figure or the total assets.
Table 5: Coefficients of the Regression Functions
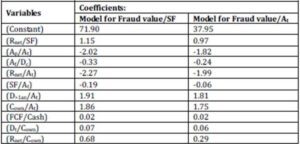
Therefore, when dividing the fraud value to the sales figure, the regression equation has the following form:
Fraud value/SF = 1.15 x(Rnet/SF) –2.02 x(Ap/At) –0.33 x(Af/Dc) –2.27 x(Rnet/At) –0.19 x(SF/At) +1.91 x(D>1an/At) +1.86 x(Cown/At) +0.02 x(FCF/Cash) +0.07 x(Dt/Cown) +0.68 x(Rnet/Cown) +71.90.
In the case of dividing the fraud to the total assets, the regression equation has the following form:
Fraud value/At = 0.97 x(Rnet/SF) –1.82 x(Ap/At) –0.24 x((Af/Dc) –1.99 x(Rnet/At) –0.06 x(SF/At) +1.81 x(D>1an/At) +1.75 x(Cown/At) +0.02 x(FCF/Cash) +0.06 x(Dt/Cown) +0.29 x(Rnet/Cown) +37.95.
Testing the Models
Starting from the representation of the mathematical model of the score function, through which we have aimed to classify the organizations into those that are subject or not to fraud, we have tested this model through simulations, using the Monte Carlo method. Based on the historical data in the analyzed sample (the distribution model, the mean and the standard average deviation) we have made 10,000 simulations to test the score function, ensuring a confidence level of 95%.
According to Sugiyama (2008), the Monte Carlo method consists in the artificial generation of the values of a probabilistic variable, using a generator of random numbers evenly distributed in the interval [0, 1], as well as a distribution function associated with the probabilistic dependent variable. In order to complete this process, we have used the Crystal Ball computer program, and for the independent variables in the models we have used the data and the score function in Table 2.
By replacing the score function variables with the data from the analyzed database, we have obtained a score interval for the organizations subject to fraud [-149.84; 52.83], and for the organizations not subject to fraud, [-1038.91;-245.68] U [56,01;390,75]. Therefore, we have tested the probability for an organization to be subject to fraud, according to the score inclusion in the interval corresponding to organizations subject to fraud [-149.84; 52.83].
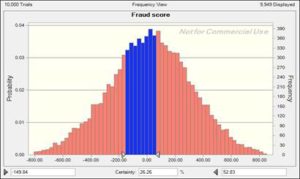
Fig 3. Score Distribution for the 10,000 Tests
According to the normal distribution of the fraud scores in Figure 3, after performing the 10,000 tests, we can state with a confidence of 95% that the probability for an organization to be included in the category of organizations subject to fraud, using the model of the score function suggested, is 25.67% (for 10,000 tests, there will be 2,576 frauds).
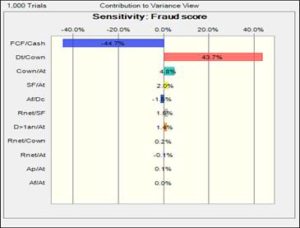
Fig 4. Score sensitivity
Figure 4 illustrates score sensitivity according to the independent variables in the model. Therefore, we can notice that a significant negative influence, by a degree of 44.7%, is applied by the ratio FCF/Cash (which means that a value higher than this ratio will point to a predisposition of the organizations towards fraud: much higher cash flows than the reported cash level). We can also notice that a significant positive influence is given by the ratio Dt/Cown, of 43.7%, which means that a significant debt of the organizations indicates their increased predisposition towards financial fraud. The two ratios significantly influence the inclusion of the companies in the category of fraud, within the limit of the interval of score inclusion: for [-149.84;0] an important influence will be given by the ratio (FCF/Cash), and for the interval [0;52.83], a major influence will be given by the ratio (Dt/Cown).
Conclusions
The financial crises that have shaken global economy have largely been the result of a discretionary influence abuse of managers and administrators, as well as a consequence of the lack of independence of the auditors, to the detriment of other subjects. This situation stresses the limits of the financial community in reducing the conflict of interests between managers, shareholders, banks, auditors, and financial analysts.
The declared bankruptcy of the “corporate governance” mechanisms based on strictly financial values and on the neglect of the conciliation of the interests of all stakeholders, has represented one of the causes of the trust crisis experienced by financial-accounting information. The dedication of organizations towards sustainable development requires an effort for presenting the economic information integrated with social and environmental information, in the reports of sustainable development, which, imperfect as they may be, comply with the basic principles of ethical and social audit that guarantee reporting quality for the stakeholders.
This paper contributes to completing the work methodology of the financial auditor, providing concerete quantitative solutions for tracking and quantifying the value of the fraud occurred in the company. Future research directions are directed at testing the model on a more representative sample, as well as at attempting to draw mathematical models specific to activity branches, thus guaranteeing the obtention of pertinent audit evidence useful for the auditor in issuing a realistic opinion.
(adsbygoogle = window.adsbygoogle || []).push({});
References
Barker, R. M. (2010). Corporate Governance, Competitions, and Political Parties. Explaining Corporate Governance Change in Europe, Oxford University Press, New York.
Publisher
Bragg, S. M. (2010). ‘Practitioner’s Guide ti GAAS 2010 Including all SASs, SSAEs, SSARSs, and Interpretations,’ John Wiley & Sons, New Jersey.
Gallet, O. (2005). Halte aux Fraudes, second edition, Dunod, Paris.
Publisher
Glover, H. D. & Aono, J. Y. (1995). “Changing the Model for Prevention and Detection of Fraud,” Managerial Auditing Journal, 10 (5). 3-9.
Publisher – Google Scholar – British Library Direct
Hayes, R. S., Dassen R., Schilder, A. & Wallage, P. (2005). Principles of Auditing. An Introduction to International Standards of Auditing, second edition, Pearson Education.
Publisher – Google Scholar
Hemraj, M. B. (2002). “The Detection of Financial Irregularieties in US Corporations,” Journal of Financial Crime, 10 (1). 85-90.
Publisher – Google Scholar – British Library Direct
International Federation of Accountants (2009). ‘International Standards on Auditing,’ IFAC, New York.
Jaba, E. & Robu, I.-B. (2009). “The Use of the Discriminant Analysis for Obtaining Audit Evidence,” Audit Financiar Magazine, no. 11 and 12, 20-24 and 19-26.
Kaminski, K. A., Wetzel T. S. & Guan, L. (2004). “Can Financial Ratios Detect Fraudulent Financial Reporting?,” Managerial Auditing Journal, 19 (1). 15-28.
Publisher – Google Scholar – British Library Direct
Karim, K., E. & Siegel, P. H.(1998). “A Signal Detectiom Theory Approach to Analyzing the Efficiency and Effectiveness of Auditing to Detect Management Fraud,” Managarial Auditing Journal, 13 (6). 367-375.
Publisher – Google Scholar – British Library Direct
Le Roy, F. & Marchesnay, M. (2005). La Responsabilité Sociale de l’Entreprise, EMS Publishing House, Paris.
Publisher – Google Scholar
Law, S. B. & Willett, R. (2004). “The Ability of Analytical Procedures to Signal Transactions Errors,” Managarial Auditing Journal, 19 (7). 869-888.
Publisher – Google Scholar – British Library Direct
Mironiuc, M. (2009). “Financial Analysis Versus Extra-Financial Analysis in Measuring the Performance of The Sustainable Organization,” Theoretical and Applied Economics, Supplement, ISSN 1841-8678, ASE Bucharest, no. 5/2009, 151-166.
Publisher – Google Scholar
Penman, S. H. (2007). ‘Financial Statement Analysis and Security Valuation,’ 3rd edition, McGraw Hill.
Google Scholar
Phillips, R. (2003). Stakeholder Theory and Organzational Ethics, Berrett-Koehler Publishers.
Publisher – Google Scholar
Silverstone, H. & Davia, H. (2005). FRAUD 101. Techniques and Strategies for Detection, second edition, John Wiley & Sons, New Jersey.
Publisher – Google Scholar
Singleton, T. W., Singleton, A. J., Bologna, G. J. & Lindquist, R. J. (2005). Fraud Auditing and Forensing Accounting, third edition, John Wiley & Sons, New Jersey.
Publisher – Google Scholar
Sugiyama, S. (2008). “Monte Carlo Simulation/Risk Analysis on a Spreadsheet: Review of Three Software Packages,” Foresight, Spring (9). 36-42.
Publisher – Google Scholar
Walton, S. & Kimball, D. (1916). ‘Auditing and Cost Finding,’ Alexander Hamilton Institute, New York.
Google Scholar
Zabihollah, R. (2007). Corporate Governance Post-Sarbanes-Oxley. Regulations, Requirements, and Integrated Processes, John Wiley & Sons, New Jersey.
Publisher – Google Scholar
Appendix
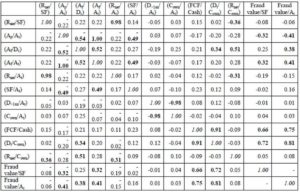
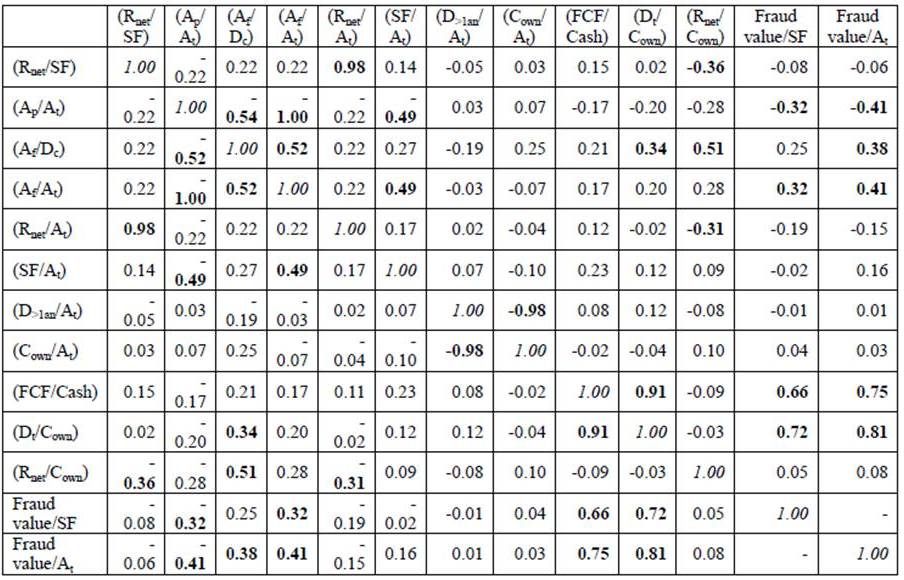
Table 4: Correlations between Variables