Introduction
Background Study
The study looks at the types of risk related to commercial banking services in Malaysia. Moreover, the different types of risk can affect the management practices differently at various levels in the commercial banks. In this study, there are nine commercial banks which are Malayan Banking Berhad (Maybank), EON Bank Berhad, Public Bank Berhad, CIMB Bank Berhad, Citibank Berhad, Standard Chartered Bank Malaysia Berhad, OCBC Bank (Malaysia) Berhad, Hong Leong Bank Berhad and Affin Bank Berhad. The banks mentioned were selected as sample for research purpose.
A few efficiency studies have been carried out in Malaysia and focused mainly on conventional banks (Katib, 1999; Abdul Majid et al., 2003; Mat Nor and Hisham, 2003). Katib (1999) examined the technical efficiency of Malaysian commercial banks from 1989 to 1995, and the results indicated that the banks had not efficiently combined their inputs. He suggested that over a period of time of observation, the technical efficiency ranged from 68% to 80%. He also found that banks with higher technical efficiency had lower cost in labor and were very cost-conscious than less efficient commercial banks. A recent paper done by Abdul Majid et al. (2003) and Mat Nor Hisham (2003) examined the cost efficiency of Malaysian commercial banks over the period 1993-2000 to compare the efficiency of Malaysian commercial banks before and after the crisis was not significantly different.
The paper is set out as follows. The problem statement is introduced, followed by the objectives and later, a brief literature review which discusses recent developments in the banking industry. This is succeeded by the methodology, followed by the discussion of the results and finally the conclusion
Problem Statement
A commercial bank has many different types of risks that must be administered cautiously, particularly when the bank deals with a large amount of leverage. Any financial crisis with no effective supervision on risk management of the commercial banks will lead to trouble in the banking system. Schroeck (2002) indicates that keeping up with well driven practices through prudent risk management will result in increased earnings. Although banks share the same financial risks, the major risks that affected banks were liquidity risk, interest rate risks, credit default risks and trading risks. In a study conducted by Schroeck (2002) and Nocco and Stulz (2006), they indicated that good risks management practices will improve the value of the firm. In a study conducted by, Nocco and Stulz (2006) suggested that banks in the long run should focus on enterprise risk management and this will give them a competitive advantage then to manage and monitor risks individually.
Based on the above discussion on the risk management, this paper is aimed to look at risk in two folds: to look at risk management in relation to efficiency among Malaysian banks and to examine the impact of risk on the efficiency of Malaysian commercial banks.
Literature Review
In line with these developments, an extensive literature has evolved examining financial bank efficiency issues. Hassan (2009), conducted a study on Risk Management Practices to assess Islamic banks in Brunei Darussalam and evaluated the implemented risk management practices and techniques to deal with different kinds of risks. Amran et al. (2009), explored the availability of risk disclosures in the annual reports of Malaysian companies. Studies conducted by David (1997) outlined that there are four major sources of risk. The researcher also defined ‘risk’ as the reduction in firm’s worth to adjust the business background, such as market risk which reflects the adjustment in net asset value outstanding, affecting the changes in fiscal factors such as interest rates, exchange rates, and equity and commodity prices. Other researchers, such as:, Noulas and Katker (1996), Battacharya et al. (1997), Anthony (1997),Das (2000), Satan and Ravisankar (2000), Shanmugam et al. (2001), Mukherjee et al. (2002), Kumar and Verma (2002-03), Satheye (2003), Tapan and Sinha (2004) and Mohan and Ray (2004), pointed out that the risks associated with the provision of banking services differed by the various services transacted by the banking institutions.
Conventionally, banks used several methods such as credit scoring, ratings and credit committees to access the creditworthiness of their customers and other intermediaries. In the beginning, these tactics did not emerge to be compatible with the market risk methods. However, some banks needed help and wanted to remedy the situation or to address the situation. The concurrence of financial risk is normal for the business of commercial bank to take on the role of financial intermediation. Normally, risk management does not mean minimizing risk, but swapping risk for reward.
Value at Risk
While Value at Risk can be used by any entity, Jackson et al. (1997) noted that the measure of risk exposure is often carried out by commercial and investment banks to capture the potential loss. Hendricks, (1996) mentioned that losses can be covered without putting the firms at risk when comparing the commercial bank s’ available capital and cash reserves.
Volatility
Volatility risk is the risk when there is a change of price of a portfolio due to the changes in the volatility of a risk factor.The management of this risk can be carried out, by using financial instruments where the price depends on the volatility of a given financial asset. In a study conducted by Charnes, Cooper and Rhodes (1978) developed an input orientation model and assumed constant returns to scale (CRS). The postulations on variable returns to scale (VRS) were established by Banker, Charnes and Cooper (1984). They had expressed that when all the DMUs are operating at an optimal scale then it can be assumed as constant returns to scale (CRS).
Hypothesis
Hypothesis I
H0: There is no relationship between volatility and risk-adjusted Return on Capital
Ha: There is a relationship between volatility and risk-adjusted Return on Capital
Hypothesis II
H0: There is no relationship between value-at-risk and risk-adjusted Return on Capital
Ha: There is a relationship between value-at-risk and risk-adjusted Return on Capital
Research Framework
In order to estimate the bank efficiencies, we had gathered the following variables: total assets, interest expenses on deposits, deposits, operating expenses, share capital, return on assets and return on equity. The dependent variables in this study will be the risk-adjusted Return on Capital risk-adjusted Return on Capital. A study conducted by Robert and William (2007) notes that risk-adjusted return on capital is a risk-based profitability measurement framework for analyzing risk-adjusted financial performance, providing an identical observation of profitability across various entities. Risk-adjusted Return on Capital is the return on risk-adjusted capital as it cannot be mixed with risk-adjusted return on risk-adjusted capital. The return can be calculated and the risk-adjusted capital should be adjusted only after tallying all the five main risk metrics, alpha, beta, r-squared, standard deviation and the Sharpe ratio—against each other as mentioned by Deepika Sharma, Poonam Loothrn and Ashish Sharma (2011). The independent variables are value- at- risk, and volatility. As such, the study continues to look at researchers such as Simone and Robert (2001) who maintained that Value at Risk had turned out to be the standard measure that financial consultants use to compute market risk.
Choosing the levels and mixes of inputs and/or outputs are important in determining efficiency. Normally, the scale efficiency can be construed from the overall bank efficiency. (Output at a scale indicates profit maximization of a firm and where capital and infrastructure can be set to their profit-maximizing level), scope efficiency (efficient, sparing, or conservative use), pure technical efficiency (getting the most production from available resources) and allocated efficiency (occurs when there is an optimal distribution of goods and services).The bank when it operates in the range of constant returns to scale, (CRS) it is said to have scale efficiency.
Methodology
The data used in this study is from BankScope, which has the balance sheet and profit & loss account data for individual Malaysian commercial banks.
Formulas for Calculation
The DEA is a multi-factor productivity analysis model used to measure efficiencies using a set of decision making units (DMUs). The efficiency score in the existence of multiple inputs and output factors:
Efficiency =  (1)
(1)
Source: Talluri (2000)
Talluri (2000) indicated showed that there are nDMUs, each with m inputs and s outputs, the relative efficiency score of a test DMU p is obtained by solving the following model proposed by Charnes et al. (1978):
Max 
s.t 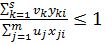


 (2)
(2)
Where
k = 1 to s,
j = 1 to m,
i = 1 to n,
 = amount of output k produced by DMU i,
 = amount of input j utilized by DMU i,
 = weight given to output k,
 = weight given to input j.
Source: Talluri (2000)
Talluri (2000) showed that the fractional program indicated as (2) can be converted into a linear program as indicated in (3). The original model was development by Charnes et al. (1978).
Max 
s.t 


 (3)
(3)
Source: Talluri (2000)
Talluri (2000) had indicated that by running n times we would be able to identify the relative efficiency scores of all the DMUs. Selected input and output weights from each DMU should maximize its efficiency score. He further stressed that a DMU is believed to be efficient if it has a score of 1 and inefficient if it has a score of less than 1.
The standard formula on risk and expected return:
Where:-
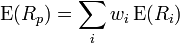
 is the return on the portfolio, is the return on asset i ,
  is the weighting of component asset
  , (That is, the share of asset i in the portfolio).
- Portfolio return variance:
Where  is the correlation coefficient between the returns on assets i and j.
Portfolios return volatility (standard deviation):

Julie H. M. (2011) mentioned that (RAROC) is related to both volatility and VaR. Jorion (2001) had indicated that in the banking institutions economic capital is often calculated by Value-at-Risk, also known as VaR. He further stressed that VaR is a measure of the total risk in a portfolio and defined it as:
“VaR measures the worst expected loss over a given time horizon under normal market conditions at a given confidence level.”
Source: Jorion, (2001)
In this study, the Multiple Regression Model is:
Y = a + bX1 + cVaR
Where,
Y = RAROC of selected banks in Malaysia
a = constant
b = slope (coefficient) of volatility
X1 = volatility of securities held by banks
C = slope (coefficient) of value-at-risk
VaR = value-at-risk of selected banks in Malaysia
RAROC = a+bx+ cx
a = constant
b = Volitality
c = VaR
Discussion and Findings
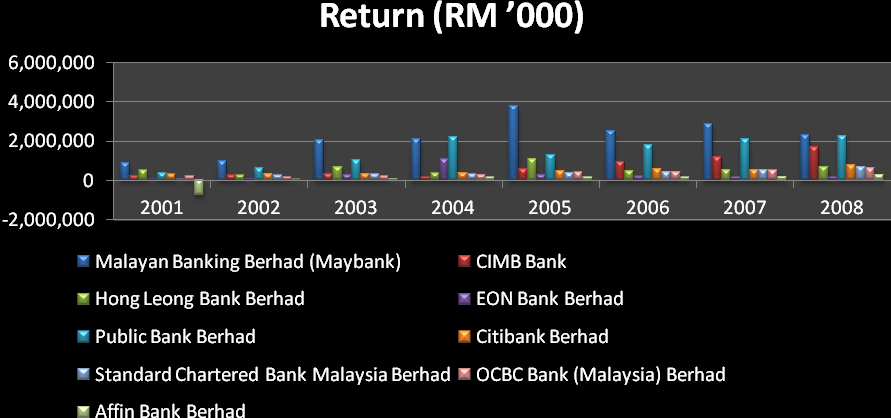
In this study, value at risk and risk-adjusted return on capital of the nine commercial banks are computed as indicated above. The commercial banks invested heavily in the securities with zero or low volatility, for example, government bond. The amount of securities portfolio and return of the commercial banks fluctuate from year to year and this resulted in the value at risk and risk-adjusted return on capital that fluctuates over the year.
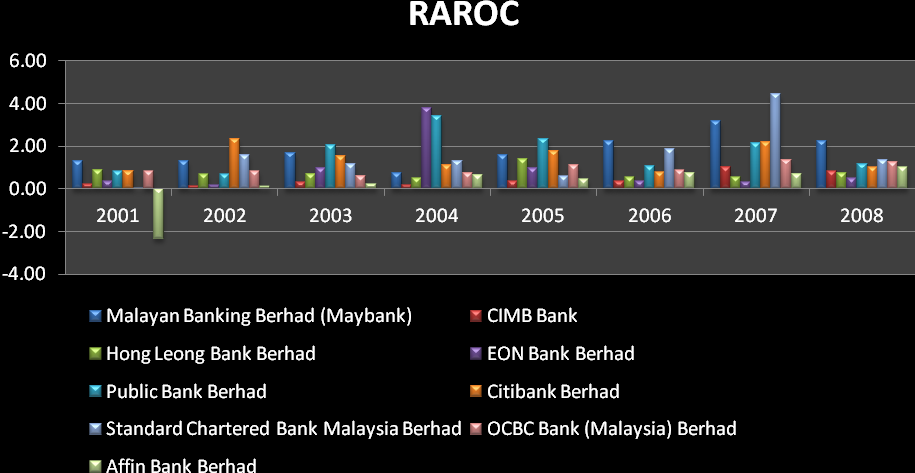
Figure 1 presents the result on value-at risk and risk-adjusted return on capital of nine commercial banks. Risk-adjusted Return on Capital is the return per unit of value at risk. As indicated, the higher the value at risk, the lower the risk-adjusted return on capital. On the other hand, the higher of the return for the particular year, the higher of the risk-adjusted return on capital. The value at risk is influenced by the volatility of the commercial bank securities maintained by the bank. Conversely, the increase in the volatility of the securities held by bank would increase the securities in custody and increase the value at risk. On the whole, the volatility of the nine commercial banks was considered manageable and small. This makes it clear that the fall of value at risk during any financial crisis would affect the value at risk which will concurrently influence volatility and total value of the commercial bank securities portfolio. According to the risk adverse principle, high risk always is associated with high return, whereas low risk is always associated with low return. Consequently, it depended on the banks’ business strategy and direction about the level of expected return and risks which within their particular tolerance level. Based on the Figure 1, Affin Bank indicated a preference to have a conservative risk management strategy, whereas radical risk management strategy was preferred by OCBC, Hong Leong, Citibank and Public bank. Besides, the moderate Risk management in their business strategy was seen in Standard Chartered Bank, CIMB, Maybank and EON bank.
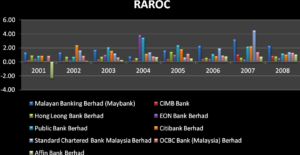 Figure 1. Risk-Adjusted Return of Capital of Individual Banks from 2001-2008
Figure 2 gives the comparative scores of the risk-adjusted return of capital of commercial banks from 2001 to 2008. It can be observed from the graph that risk-adjusted Return on Capital of banks fluctuated without following a specific pattern. The risk-adjusted Return on Capital of Affin Bank was negative during 2001 due to the negative return for the year. The negative return from Affin Bank was during 2001, which had an impact from the Asian financial crisis from 1997 to 1998. Izahand Sudin (2008) indicated that the bank had recovered from the financial crisis at the start of 2002. From a total of 58 financial institutions, the number reduced to 10 anchor banks and the merger was progressively completed by 2000. This was the result of the financial crisis which has weakened the domestic banking sector and the move towards consolidation was hoped to improve the efficiency of the banking sector. The commercial banks had undergone a tremendous development with the merger exercise.
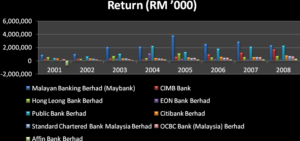 Figure 2.Risk-adjusted Return of Capital of Individual Banks from 2001-2008
The above figure provides the comparative scores of the nine commercial banks, using the value-at-risk approach to capture the total risk across the commercial banking institution. This approach was widely used by the banking and financial institution in Malaysia as well as in other countries. Meanwhile, another risk measure approach which is risk-adjusted return on capital had been adopted by few commercial banks to execute this approach, as the application of risk-adjusted Return on Capital was technically more efficient to interpret the real scenario compared to Value at risk which was acting as an indicator only.
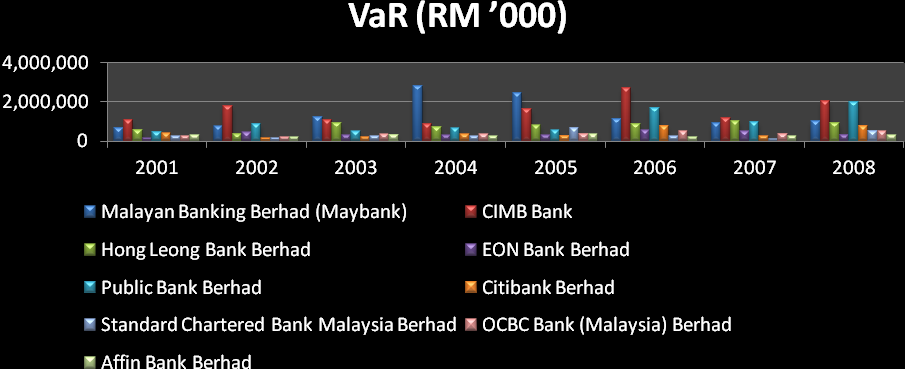
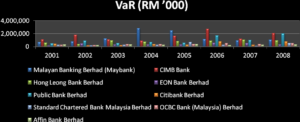 Figure 3.Value at Risk of Commercial Banks from 2001 To 2008
The above graph shows the comparative scores of the nine commercial banks, such as Public Bank, Citibank, Hong Leong Bank and OCBC bank which were relatively radical in their risk management as their risk-adjusted Return on Capital fluctuated significantly from year to year. The comparative graph shows that those banks with good risk management strategy are more sensitive to the market trends. Subsequently, it would also be possible that if the banks had reached the stage of increasing returns to scale, it would be beneficial to improve the bank’s ability to assume risks in order to increase efficiency. However, Affin Bank had a conservative risk management strategy when compared to the other eight banks as its risk-adjusted Return on Capital and its return to scale only increased progressively. Standard Chartered Bank, , CIMB Bank Berhad, EON Bank Berhad and Maybank Berhad were not too conservative nor radical in their risk management strategy could be considered as moderate as the fluctuation of their risk-adjusted Return on capital were not significant according to the graph above, with exception to 2007. The risk-adjusted Return on capital of these 3 banks increased significantly throughout 2007 due to the financial economic crisis.
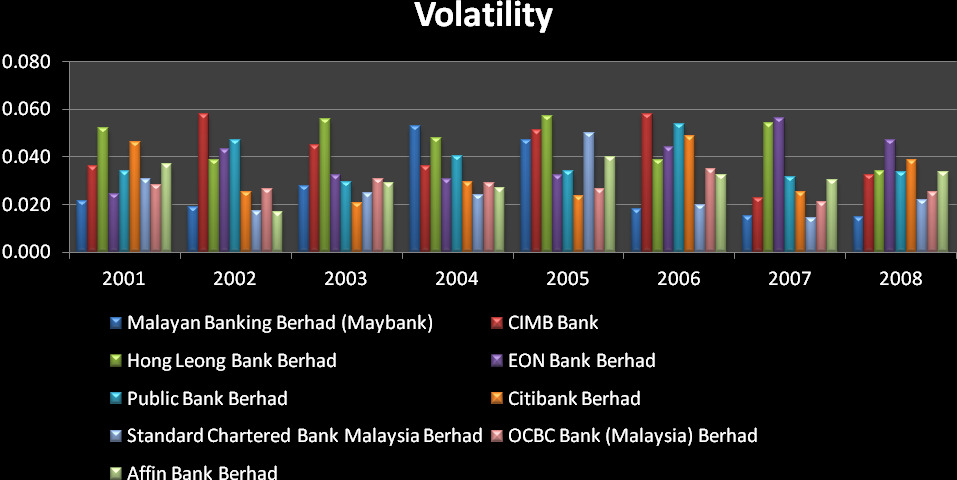
 Figure 4.Volatility of Commercial Banks from 2001 To 2008
Specifically, the researchers will discuss the various regression analyses, where both the independent variables together obtained 18.756 percent of the risk-adjusted Return on Capital, which was not significant, as indicated by the R Square. However, the t-value indicates that volatility which was 0.000175was a significant predictor of risk-adjusted Return on Capital of commercial banks, as indicated by the Sig. <.06. Whereas, the Value at risk was 0.25895, which did not significantly predict the risk-adjusted return on capital. Subsequently, the null hypothesis was rejected, whereas the null hypothesis of hypothesis II was not rejected. In order to further this study on the relationship between risk-adjusted Return on Capital and value at risk as well as volatility exhaustively, another two multiple regression analysis was performed. The primary multiple regression analysis conducted indicated that the independent variables of banks could not significantly predict the risk-adjusted return on capital, with the exception of CIMB Bank and OCBC Bank. In other words, the volatility and value at risk for CIMB Bank which was 0.0085 and 0.054 as well as the volatility and Value at risk for OCBC Bank which was 0.0045 and 0.0065 both have significant relationships with RAROC. Comprehensively, when another multiple regression analysis was performed based on individual years. The findings in the multiple regression analysis indicate that the mutually independent variables did not have a significant relationship with risk-adjusted Return on Capital from year 2001 to year 2005. However, the values 0.0085 in 2006, 0.059 in 2007 and 0.004 in 2008 confirmed that the volatility significantly predicted the risk-adjusted Return on Capital, as indicated by Sig. <.0457. Whereas, the Value at risk still remained as an insignificant predictor.
Conclusion
From the above analysis, it is clear that there are differences in the risk management, practices and processes among the commercial banks in Malaysia. Besides, the management risks faced by commercial banks in Malaysia and the systematic methodology used to reduce and to manage the risk were acceptable. In its entirety, the researchers specifically wanted to confirm the results further, and as such a multiple regression analysis was carried out which indicates that hypothesis (H0) should be rejected when hypothesis (Ha) had been confirmed as precise from hypothesis 1, since the volatility was sizeable and it predicted risk-adjusted Return on Capital in the commercial banks. From this, it can be concluded that H0 is confirmed to be not rejected when H0 has been attested to be true based on hypothesis II and when the Value at risk could not significantly predict the risk-adjusted Return on Capital in the commercial banks.
Moreover, the multiple regression analysis results gathered from the second time rejected hypothesis (H0) when hypothesis (Ha) was true from hypothesis I and II for commercial banks CIMB Bank and OCBC Bank. Furthermore, the results for the multiple regression analysis 3 revealed that the researchers should have rejected hypothesis (H0),as hypothesis (Ha) was true owing to the fact that the volatility in the years 2006, 2007 and 2008 was significant and it predicted risk-adjusted return on capital. Besides, hypothesis (H0) should not be rejected when H0 was true from hypothesis II as the Value at risk in the year 2006, 2007 and 2008 did not significantly predict the risk-adjusted return on capital. In the final analysis, it can be derived that Ariffin Bank had been very conservative and careful in taking risk; Maybank, EON bank and Standard Chartered bank may perhaps be mentioned as moderate and possibly even restrained. Commercial banks that can be considered radical were OCBC, Citibank, Hong Leong and Public Bank. Therefore, it is quite evident to say that this study has provided some insights to commercial banks risk management and will provide the central bank of Malaysia an opportunity to appreciate and comprehend the risk management practices and the diverse types of risk associate from the management of commercial banks. The findings also emphasize the importance of attaining long-term efficiency gains to support financial stability objectives. As always, risk can directly or indirectly affect all the commercial banks and the parameter of supervision and management practices by the central bank will help to further improve the commercial banks operational controls and to monitor risk practices.
(adsbygoogle = window.adsbygoogle || []).push({});
References
Abdul Majid, M., Md Nor, N. G & Said, F. F. (2003). ‘Efficiency of Malaysian Banks: What happened after the Financial Crisis,’ Paper presented at the National Seminar on “ Paper presented at the National Seminar on “Managing Malaysia in the Millennium: Economic and Business Challenges” ‘ organized by UTM and Melaka State Govt (1-2 July 2003) 376-385).
Google Scholar
Arman, A., Bin, A. M. R. & Hassan, B. C. H. M. (2009). “Risk Reporting: An exploratory Study on Risk Management Disclosure in Malaysian Annual Reports”, Managerial Auditing Journal, Vol. 24, No.1, pp. 39-57.
Publisher – Google Scholar
Annual Report, Affin Bank (2001-2008).
Publisher
Annual Report, CIMB Bank (2001-2008).
Publisher
Annual Report, Citibank (2001-2008).
Publisher
Annual Report, EON Bank (2001-2008).
Publisher
Annual Report, Hong Leong Bank (2001-2008).
Publisher
Annual Report, Maybank (2001-2008).
Publisher
Annual Report, OCBC Bank (2001-2008).
Publisher
Annual Report, Public Bank (2001-2008).
Publisher
Annual Report, Standard Chartered (2001-2008).
Anthony, M. S. (1997). “Commercial Bank Risk Management: An Analysis of the Process,” Wharton Financial Institutions Center, the Wharton School, University of Pennsylvania.
Publisher – Google Scholar – British Library Direct
Anthony, M. S. (2004). ‘An Overall Perspective on Banking Regulation,’ Philadelphia Fed Working Papers [View] (Paper: wp02-01, 01.01.2004.
Anthony, M. S. & David, F. B. (1997). “Financial Risk Management by Insurers: An Analysis of the Process,” The Journal of Risk and Insurance, 1997, Vol.64, No 2, 231-270.
Publisher – Google Scholar – British Library Direct
Baele, L., Vennet, R. V. & Landschoot, A. V. (2004). “Bank Risk Strategies and Cyclical Variation in Bank Stock Returns,” Working Paper, Faculty of Economics and Business Administration, Ghent University, Ghent.
Publisher – Google Scholar
Basle Committee (2000). ‘Other Risks,’ Risk Management, Discussion Paper, BIS BASEL. April.
Battacharya, A., Lovell, C. A. K. & Pankaj Sahay (1997). “The Impact of Liberalization on the Productive Efficiency of Indian Commercial Banks”, European Journal of Operational Research, Vol. 98, Pp. 175-192.
Publisher – Google Scholar
Daljit Dhesi (2009). Domestic Banks Beef Up Risk Management Systems, The Star.
Publisher
David, H. P. (1997). ‘Bank Risk Management, Research Program in Finance,’ Working Paper RPF-272, Conference on Risk Management and Deregulation in Banking, Jerusalem, 1997.
Deepika Sharma, Poonam Loothra & Ashish Sharma (2011). ‘Comparative Study of Selected Equity —-Diversified Mutual Fund Schemes,’ IJCSMS International Journal of Computer Science & Management Studies, Vol. 11, Issue 01, May 2011.ISSN (Online): 2231 –5268.
Demirgüç-Kunt, A. (1989). “Deposit-Institution Failures: A Review of Empirical Literature,” Economic Review, Federal Reserve Bank of Cleveland, Vol. 25, No.4.
Publisher – Google Scholar
Demirguc, A. & Huizinga, H. (1999). “Determinants of Commercial Bank Interest Margins and Profitability: Some International Evidence,” World Bank Economic Review, Oxford University Press, vol. 13(2), pages 379-408, May.
Publisher – Google Scholar – British Library Direct
Dumitru G. Badea (2001). ‘Insurance & Reinsurance,’ Economic Publishing House, 2004, Bucharest.
European Insurance & Occupational Pensions Authority (EIOPA) (2001). Safe guard financial stability in Europe.
Fallon, W. (1996). Calculating Value-at-Risk, Working Paper 96-49, Wharton Financial Institutions Center, The Wharton School, University of Pennsylvania Deepika Sharma.
Publisher – Google Scholar
Hasan, I. & Marton, K. (2003). “Development and Efficiency of the Banking Sector in a Transitional Economy: Hungarian Experience,” Journal of Banking and Finance 27, pp. 2,249-2,271.
Publisher – Google Scholar
Hendricks, D. (1996). “Evaluation of Value-at-Risk Models Using Historical Data,” Federal Reserve Bank of New York Economic Policy Review 2 (April, 1996), 39-69.
Publisher – Google Scholar
Hassan, M. K. (2009). “Risk Management Practices of Islamic Banks of Brunei Darussalam,” The Journal of Risk Finance, Vol. 10, No.1, pp. 23-37.
Publisher – Google Scholar
Jackson, P., Maude, D. J. & Perraudin, W. (1997). “Bank Capital and Value at Risk,” Journal of Derivatives, 4(3), 73{89.
Publisher – Google Scholar
Jim, R. & Curtis, T. (2003). ‘Credit Risk Measurement, A Portfolio View,’ ERisk, Inc., 2003.
Google Scholar
Jorion, P. (2001). ‘Value at Risk,’ Second Edition. McGraw Hill, New York.
Google Scholar
Julie Houe Magnussen (2011). Valuation of Full Load Contracts A RAROC-Based Approach Master’s thesis in Advanced Economics and Finance.
Publisher
Katib, M. N. (1999). ‘Technical Efficiency of Commercial Banks in Malaysia,’ Bankers: Bankers Journal Malaysia. (September 1999), 40-53.
Google Scholar
Mat-Nor, F. & Hisham, M. (2003). ‘Effect of Mergers and Acquisition on Efficiency of Banking Institutions in Malaysia: A Lesson for Future Direction on Islamic Banking,’ Conference Paper. September 2003.
Google Scholar
Mukherjee, A., Nath, P. & Pal, M. N. (2002). “Performance Bench Marketing and Starategic Homogeneity of Indian Banks,” International Journal of Bank Marketing, Vol.20, No.3, Pp. 122-139.
Publisher – Google Scholar – British Library Direct
Nocco, B. W. & Stulz, R. M. (2006). Enterprise risk Management: Theory and Practice, Ohio State University working paper.
Publisher – Google Scholar – British Library Direct
Noulas, A. G. & Katkar, K. W. (1996). ‘Technical and Scale Efficiency in the Indian Banking Sector,’ International Journal of Development Banking, Vol.14, No.2, Pp.19-27.
Google Scholar
Payle, D. H. (1997). “Bank Risk Management: Theory,” Working Paper No.272, University of California.
Publisher – Google Scholar
Peek, J. & Rosengren, E. S. (2000). “Collateral Damage: Effects of the Japanese Bank Crisis on Real Activity in the United States,” The American Economic Review Vol. 87-4, pp. 495-505.
Publisher
Saha, A. & Ravisankar, T. S. (1995). ‘Assessing Relative Strength of Banks in Managing Risk: An Indian Evidence, Prajnan, vol. XXIV,’ No. 4.
Google Scholar
Santomero, A. M. & Babbel, D. (1996). Financial Markets, Instruments, and Institutions, Irwin Publishers, Illinois.
Publisher
Sathye, M. (2001). “X-efficiency in Australian Banking: An Empirical Investigation,” Journal of Banking and Finance 25, 613–630.
Publisher – Google Scholar
Schroeck, G. (2002). “Risk Management and Value Creation in Financial Institutions,” John Wiley and Sons, Inc.
Publisher – Google Scholar
Shanmugam, K. R. & Lakshmanasamy, T. (2001). ‘Production Frontier and Efficiency Measures: An Analysis of the Banking Sector in India,’ Asian –African Journal of Economics and Econometrics, Vol.1, No.2, Pp. 211- 228.
Google Scholar
Shrieves, R. E. & Dahl, D. (1992). “The Relationship between Risk and Capital in Commercial Banks,” Journal of Banking and Finance 16, 439-457.
Publisher – Google Scholar
Tahir, I. M. & Haron, S. (2008). Technical Efficiency of the Malaysian Commercial Banks: A Stochastic Frontier Approach – Volume 3.-issue –P.65-72.
Publisher – Google Scholar
Talluri, S. (2000). ‘Data Envelopment Analysis: Model and Extensions,’ Production and Operations Management.Decision Line May 2000.
Tapan Sinha, D. Shyam Moses (2004). ‘Efficiency- Equity Tradeoff for Scheduled Bank Operations across States,’ Paper Presented in IGIDR National Seminar, March 26-29.
Teddy Oswari (1998). ‘Socio-Economic Impacts of Micro-Enterprise Credit in the Informal Sector of Jakarta,’ Indonesia Wikipedia. Modern Portfolio Theory. The free encyclopedia.