Introduction
The report of AC Nielsen (The Jakarta Post, 2011) revealed that Indonesia, one of the most populated countries and big potential market, had recorded an 11.8 percent growth in its fast-moving consumer goods industry in 2010, a result of an improving economic condition. This industry’s contribution to the GDP is second the largest after transportation and communication sector. Boston Consulting Group (The Jakarta Globe, 2012) estimates that purchasing power has rebounded in line with the rise in the Indonesia’s cellular phone subscribers who now has topped 110 million by the end of 2011 and the number of cars sold has approached 1 million yearly. In the other words, Indonesia has become a major market for modern consumer its products as much as possible. Intuitively, this fact triggers to challenge the work of Brander and Lewis (1986) arguing that a limited liability firm that uses debt may choose to trade more aggressively by increasing its output. Ward and Price (2006) supported this argument by revealing their results, in which a profitable business will experience a higher Return on Equity (ROE) as borrowings increase. Ward and Price (2006) also postulated the impact of debt or leverage, since a profitable firm can gain the return at a higher rate than its obligations for the borrowed funds. In the other side, Bolton and Scharfstein (1990) argue that a firm that relies too much on external financing will be more vulnerable to predation in its product markets. The firm may therefore choose to employ internal sources of financing. It is supported by Chevalier (1995a; 1995b), Phillips (1995), and Kovenock and Phillips (1995; 1997).
Indonesia’s consumer goods firms, in which are assumed as a high-growth industry, intuitively need more to raise external finance to invest than the low-growth one (Maksimovic, Stomper, & Zechner, 1999) since firms in a high-growth industry face high demand for their output. Thus, it is optimal for a large number of firms to invest even if production costs turn out to be high. In addition, the impact from the capital structure and investment’s decision will help the firm’s ability to deal with its competitive environment. Furthermore, the capital structure of a firm, which is a mix of debt and equity that is used by a firm, and the investment decision are important to enhance its operation. In order to give a recent perspective on the effect of capital structure and investment decision on firm performance in the Indonesian consumer goods industry, this study will explore the influence of those variables. It is important for this industry’s top managers and potential investors to determine the industry’s potential returns and risks from its financial characteristics and find out whether the investment is risky or not. In addition, this study should give more accurate-information to both consumer goods’ managers and investors in the changing industry by using the most recent financial data available, from 2007 through 2010.
The variables used as determinants of the effects of capital structure and investment decision on firm performance were debt-to-equity ratio, market value to book value of assets ratio, and price to book value ratio. Since most of the information needed was available from the accounting disclosures, we could use the proposed determinants to be fully examined in this study. Our paper contributes to this literature by analyzing the effects of leverage and investment opportunity set on firm performance, which reveals the strategies taken by the firms in an intensified-competition environment. The expected results provide a practical perspective of the importance of understanding the financial dynamics during the process of a firm’s investment, its financing decision, and growth.
To present the empirical findings, the paper is organized as follows. The literature review and prior studies on capital structure, investment opportunity set, and firm performance are briefly outlined in Section 2, which also discussing the hypotheses development. The methodology and research model is described in Section3, followed by the research results and discussion in Section 4. We provide some concluding remarks in Section 5.
Literature Review and Hypotheses Development
The long and inconclusive debate on the effect of capital structure on firm performance was triggered by the seminal work of Miller and Modigliani (1958), in which they revealed that capital structure was independent of firm performance. Myers (1984) stated that firm with risky debt and high growth opportunities, its manager will be acting in the interest of shareholder and may pass up positive NPV project, because the return from these projects will partially accrue to the debt holders. Hence, due to such action of manager, firm seems to engage in attempting the underinvestment problems. Barclay, Smith, and Watts (1995) and Ozkan (2000) support this argument by revealing that firm’s level of leverage cause firm’s performance failure.
In relating to the investment opportunities, when the investment is financed by equity only, the standard underinvestment problem applies when the manager makes the investment decision in the interests of equity-holders. However, if the manager makes the decision in his or her own interest, he/she has a stronger incentive to invest than equity-holders. This is because the manager does not bear the cost of investment, and by investing and hence improving the firm’s earnings, the manager can increase her compensation and expected utility. Therefore, the agency cost of equity comes in the form of over-investment by the manager. These interrelated variables and its effects on firm performance will be discussed in the following sub-sections.
Capital Structure and Firm Performance
Despite the matter of optimal capital structure is still debatable, many studies have shown that increases in leverage cause decrease in firm’s performance. For instance, Krishnan and Moyer (1997) found negative relationship between debt to equity and return on equity. The work of Zeitun and Tian (2007) revealed that a firm’s capital structure has a significant negative relation with firm performance indicators. Many researchers (Brigham & Gapenski, 1996) have also emphasized the importance of optimal capital structure. Those prior studies explained that optimal capital structure was a point where tax-sheltering benefits provided by debt level is equal to the bankruptcy costs associated with debt. Majumdar and Chhibber (1997) and Rao, Al-Yahyaee and Syed (2007) also found negative link between financial leverage and performance. By using a sample of European countries, Gleason, Mathur and Mathur (2000) supported a negative impact of leverage on the profitability of the firm. In the context of Asian financial crisis, the crisis magnifies the negative relationship between firm performance and financial leverage (Tan, 2012).
At the positive side of the inconclusive findings of the effect of capital structure on firm performance, Huyghebaert (2006) argues that higher leverage creates incentives for an entrepreneur to maximize short-term earnings in order to reduce the risk of adverse credit decisions by lenders. However, Huyghebaert (2006) asserts that leverage can affect firm performance only when some market imperfections pertain. Meanwhile, under the agency cost theory, leverage positively influence on firm performance before reaching the firm‘s optimal capital structure (Titman & Wessels, 1998; Myers, 2001). Ross (1977), Heinkel (1982) and Noe (1988) suggest that increasing leverage, by acquiring debt should have positive implications for firm value and performance (Hadlock & James, 2002). The similar idea was proposed by Corriceli, Driffield, Pal, and Roland (2011), which used a sample of Central and Eastern European countries, suggesting that total factor productivity’s (TFP) growth increases with leverage until the latter reaches a critical threshold (optimal leverage) beyond which leverage becomes “excessive” and lowers TFP growth. Roden and Lewellen (1995) also found a significant positive association between profitability and total debt as a percentage of the total buyout-financing package in their study on leveraged buyouts. In general, Sharma (2006), by using a sample of Indian manufacturing companies, revealed that a firm’s financial leverage affects the firms value. Thus, hypothesis 1 is proposed as below:
Hypothesis 1: Leverage affects firm performance.
Investment Decision and Firm Performance
The contradictory findings of the effect of investment decision on firm performance have provided two sides. At the negative side, Power (1998) and Huggett and Ospina (2001) find that productivity decreases after an investment, and that most of the growth rate coefficients are not even significant. Using a different econometric approach, Nilsen, Raknerud, Rybalka, and Skjerpen (2009) find an increase in productivity levels during the investment (from date t − 1 to t) but such effect disappears after the investment.
In the other side, by using a sample of 143 firms from the pharmaceutical industry, Lin, Lee, and Hung (2006) found a significant positive effect on firm value at the stock exchange of an interaction effect between R&D intensity and commercialization measured by expenditure on marketing. In the context of marketing, investments in advertising have been the most studied and their effects have been found to have a positive long-term effect on different financial performance indicators (e.g. Jedidi, Mela & Gupta, 1999; Dekimpe & Hanssens, 2010; Fee, Hadlock & Pierce, 2009), as well as on stock price (e.g. Agrawal & Kamakura, 1995; Mathur, Mathur & Rangan, 1997; Cornwell, Pruitt & Clarck, 2005; Miyazaki & Morgan, 2001; Mathur & Mathur, 2000; Joshi & Hanssens, 2010). Therefore, we hypothesize that:
Hypothesis 2: Investment influences firm performance.
If the firm can use new debt to finance the investment, then, acting in the interests of equity-holders, the manager has a tendency to over-invest so as to dilute the claim of initial debt-holders. However, if the manager chooses the timing of investment to maximize her own utility, then the situation becomes quite different. After investment, given the improved earnings, shareholders would like to lever the firm up to its full debt capacity, which is much higher than that before investment. The relationship between corporate leverage and the firm’s investment behavior is therefore determined by the typical mode of financing investment in an industry.
Based on the work of Myers (1977) and Jensen (1986), Stulz (1990) develops a model in which debt financing mitigates over-investment problems but aggravates the underinvestment one. This model predicts that debt can have both a positive and a negative effect on firm performance and presumably both effects are present in all firms. According to McConnell and Servaes (1995), the common element in the models of Myers, Jensen and Stulz is their focus on the link between the firm’s investment opportunity set and the effects of debt on the value of the firm. Following the argument of McConnell and Servaes (1995), we propose that:
Hypothesis 3: Leverage and investment decision simultaneously are related to firm performance.
By exploring these three hypotheses, this study contributes in helping the manager of the companies to make good decisions on the proportions of their capital structure and the investment opportunities available. If they have taken too much debt in the operations of the company and the investment projects, this can jeopardize the company’s future, thus can make the companies go bankrupt. Hence, this will provide and add new knowledge to corporate managers as a benchmark in making their own decision on the company’s performance.
Research Methodology
In this study, the sample consists of the 32 consumer goods companies, which are taken out of 142 manufacturing companies listed on the main board of Indonesia Stock Exchange (IDX) during the period 2008 to 2010. The selection is based on their full report to IDX for the three consecutive years. The time span is selected for two reasons: First, this period is the relatively established period after the global crisis, therefore, the data obtained can represent the most neutral environment. Second, referring to the AC Nielsen report (2011) and the Boston Consulting Group estimation (2012), the Indonesian consumer goods companies are in the boom period to meet the increasing demand, therefore, it is suitable to test the proposed hypotheses. Data is collected from the companies’ annual reports, downloaded through the Indonesia Stock Exchange website and the Central Bank of Indonesia.
To measure investment opportunity set (IOS), we used market-to-book-value-of-assets (MBAR), which is used previously in the work of Kallapur and Trombley (1999) and Adam and Goyal (2007). MBAR is the most commonly used proxy for investment opportunities (Adam & Goyal, 2007). The book value of assets is a proxy for assets in place, whereas the market value of assets is a proxy for both assets in place and investment opportunities. Thus, a high MBA ratio indicates that a firm has many investment opportunities relative to its assets in place. Therefore, by following the study of Adam and Goyal (2007), the formula to calculate MBA ratio is as follows:
MBA ratio = 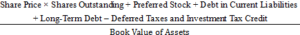 (1)
(1)
To measure the extent to which a firm uses debt funding or financial leverage has implications for the firm, in this study, we used debt-to-equity ratio (DER). It is because debt and equity are the principle sources of funding for a business. The proportional distribution of these two sources of funding depends on how a firm decides to divide its cash flow between two broad categories: a fixed component, which is utilised for obligations toward debt capital, and a residual component, which belongs to equity shareholders. If a firm earns more on investments financed with debt than the interest due on debt, then shareholders returns are leveraged (Ehrhardt & Brigham, 2006). Therefore, the formula to calculate DER is as follows:
DER =  (2)
(2)
To measure firm performance, in this study, we used price-to-book value (PBV). It relates the stock market price of a company to its book value to determine a value horizon for the company. PBV is calculated by dividing the current market price of a stock with the net asset value or book value at a given period, or it is the ratio of market price of a company’s shares (share price) over its book value of equity. Black (2001) explains that the value of a firm can be measured by using the value ratio. The ratio can be calculated by dividing the actual market capitalization by potential market capitalization. The actual market capitalization is based on the stock prices. In contrast, potential market capitalization is based on actual resources of the firm. It provides a relatively stable, intuitive measure of value, which can be compared to the market price. It offers an easy-to-use tool for identifying clearly under or overvalued companies. Therefore, the formula to calculate PBV is as follows:
PBV = 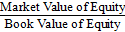 (3)
(3)
To test the proposed hypotheses, we employed a multivariate regression, which PBV was the dependent variable and MBAR and DER were independent variables.
Findings and Discussion
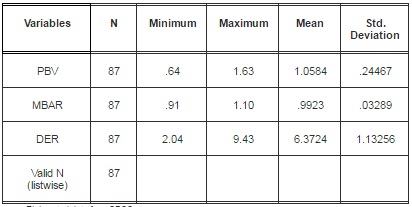
Before analyzing the obtained data, we did a statistical descriptive analysis to help examine the tendencies, spread, normality, and reliability of a data set. The result of descriptive statistics is reported in Table 1.
Table 1: Descriptive Statistics of the Data Used
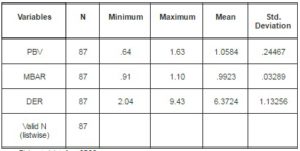
Source: Elaborated data from SPSS.
Based on the descriptive statistics, averagely, the consumer goods companies’ stock’s market prices are relatively same or higher than its book value, which are shown by value more slightly than one (PBV > 1). Where a market value is equal to or less than the book value of a fundamentally good company, then this may represent a significant buy opportunity for discerning investors. It indicated that most of the observed companies’ stocks are faintly overvalued. It normally happens in high-growth companies, which is suitable with the current situation of this observed industry. The MBA ratio was close to 1, which indicated the market value reflected solely the recorded assets of a company. It reflected also greater expected future gains because of perceived growth opportunities and/or some competitive advantages and/or lesser risk, but at the same time, it indicated that the share price was relatively the same as its book value. Meanwhile, in average, most of the observed companies were financed by 86% of debt or six times of its equity. It indicated that leverage became an option to fund the companies’ investment projects.
The next step of data analysis, we did a serial basic test of multiple regression analysis, i.e. normality assumption test, multicollinearity, autocorrelation, and heteroscedasticity tests. Those classical tests are important to minimize the probability of having insignificant results from the proposed model due to the incorrect or irrelevant value of predictors. In this study, we did the normality test by using the Kolgomorov-Smirnov Z normality test, and checking the variance inflation factor (VIF) value for multicollinearity test. The run test was used to detect the autocorrelation problem. The results showed to us that we could continue to the multivariate regression analysis (Table 2). For instance, the significance values of PBV, MBAR, and DER are more than 0.05, which mean the data set is normal distributed. The VIF values of independent variables are less than 10, i.e. 1.038 for each variable. The results of Durbin-Watson test, which detect the autocorrelation problem, revealed that the model is fit, i.e. 1.896 (dU < dW ≤ 4 – dU, 1,696 < dW ≤ 2,304, alpha 5%). The Park test, which indicates the heteroscedasticity problem, revealed that the variance of the error term is constant for all values of the independent variable.
Table 2: The Normality, Multicollinearity, Autocorrelation, and Heteroscedasticity Test

Source: Elaborated data from SPSS.
Notes: p < 0.05
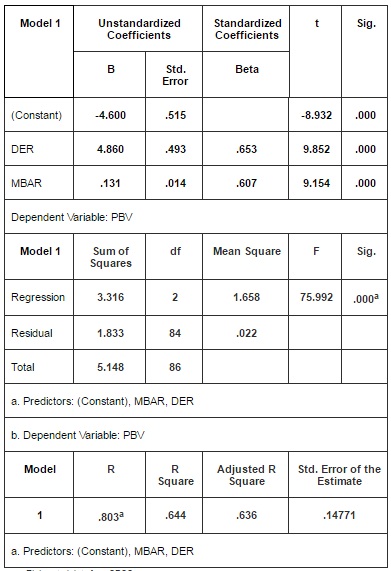
The regression result revealed that leverage has a positive and significant effect on the company performance. This result is in line with the work of Huyghebaert (2006), Titman and Wessels (1998), Myers (2001). It seems that the Indonesian consumer goods companies choose short-term debt as source of fund to increase its operation activities. This option leads to the increased performance. The phenomenon is common for developing countries context, which increasing leverage, by acquiring debt should have positive implications for firm value and performance (Ross, 1977; Heinkel, 1982; Noe, 1988; Hadlock & James, 2002). The similar phenomenon was reported in Central and Eastern European countries, and India (Corriceli et al., 2011; Sharma, 2006).
Table 3: The Regression Result
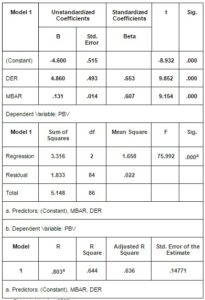
Source: Elaborated data from SPSS.
We argue that the Indonesian consumer goods companies adopt the efficiency-risk hypothesis (Berger & Bonaccorsi di Patti, 2006), which the more efficient firms may choose higher debt to equity ratios because the higher efficiency reduces the expected costs of bankruptcy and financial distress. According to the 2012 Outlook for Retail and Consumer Product Sector in Asia (PricewaterhouseCoopers, 2011), the Indonesian consumer goods companies are categorized as fast-moving consumer goods market requiring to expand fast and efficient in high-performing Asian markets. Improvements in telecommunication infrastructure and in payment and security systems, together with the increasing appetite of consumers to shop online, will push online sales growth to an average of 20% a year in Asia (PricewaterhouseCoopers, 2011). To tap this opportunity and robust expansion, debt becomes a strategic option to fund the investment needed.
Meanwhile, the investment decision is positively and significant related to the firm performance. This result is in line with the work of Lin, Lee, and Hung (2006), Dekimpe and Hanssens, (1995), Jedidi, Mela and Gupta (1999), Fee, Hadlock and Pierce (2009, and Joshi and Hanssens (2010). It indicated that investors perceived positively the companies’ investment decision and expected it could provide a significant return soon. Our study also revealed that debt and investment decision had simultaneously influenced the firm performance. It means that a higher level of leverage has been used as a disciplinary device to reduce managerial cash flow waste through the threat of liquidation (Grossman and Hart, 1982) and at the same time, through pressure to generate cash flows to service debt (Jensen, 1986) by investing the obtained fund in operating activities leading to the increasing firm’s performance. We argue that the observed companies have invested a more balanced capital spending, with a shift toward investments to improve manufacturing efficiency, logistics, and distribution and slight away from relentless capacity expansion. This strategic action is important to help these companies manage through what could be tougher times ahead, due to the rising competition and growing market penetration.
Conclusions and Policy Implications
Our study has revealed some important findings related to the effects of leverage and investment decision on firm performance, which specifically focus on the Indonesian consumer goods industry. The positive and significant influence of independent variables on the observed sample data informed us that debt has become a strategic option to fund the investment opportunity sets for Indonesian consumer goods companies during the period 2008-2010. Those companies tried to optimize the economic growth prospects, moderately lower inflation risk and rising disposable incomes in Indonesia, the Southeast Asia’s biggest economy. We assume that the Indonesia’s huge population, increasing disposable incomes, resilient domestic growth, and underpenetrated market has been an advantage to companies in the sector. A strong need among Indonesian companies in the sector for investment to expand capacity and defend market shares could put a lid on individual companies’ revenue growth. However, the key for strategic investment is laid on the ability of market participants to adapt to a more competitive environment will be crucial to maintaining cash flow growth and credit quality.
Our empirical findings brought us to some policy implications. First, to seek optimal ways of allocating marketing investment across multiple channels, which Indonesia’s demographic structure concentrates on the age range between 20 and 44 years as the prospective target market, representing some 60% of country’s total population. Second, strategic investment in product innovation, combined with effective pricing strategies, will be key areas of focus for the companies that will succeed in 2012 and beyond. Third, consumer products companies that invest its funds in IT to best integrate and use consumer, shopper, and customer insights to drive strategic and tactical innovation and optimize engagement with individuals throughout the journey to the point of purchase will ultimately win at the shelf.
(adsbygoogle = window.adsbygoogle || []).push({});
References
Adam, T. & Goyal, V. K. (2007). “The Investment Opportunity Sets and Its Proxy Variables,” Available at SSRN: http://ssrn.com/abstract=298048 or http://dx.doi.org/10.2139/ssrn. 298048 [acessed 17.06.2012].
Publisher
Agrawal, J. & Kamakura, W. A. (1995). “The Economic Worth of Celebrity Endorsers: An Event Study Analysis,” Journal of Marketing, 59(3), 56-62.
Publisher – Google Scholar
Barclay, M., Smith, C. W. & Watts, R. L. (1995). “The Determinants of Corporate Leverage and Dividend Policies,” Journal of Applied Corporate Finance, 7(4), 4-19.
Publisher – Google Scholar
Berger, A. N. & Bonaccorsi di Patti, E. (2006). “Capital Structure and Firm Performance: A New Approach to Testing Agency Theory and an Application to the Banking Industry,” Journal of Banking and Finance, 30(4), 1065-1102.
Publisher – Google Scholar
Black, B. (2001). “The Corporate Governance Behavior and Market Value of Russian Firms,” Emerging Markets Review, 2(2), 89-108.
Publisher – Google Scholar
Bolton, P. & Scharfstein, D. S. (1990). “A Theory of Predation Based on Agency Problems in Financial Contracting,” American Economic Review, 80(1), 93-106.
Publisher – Google Scholar
Brander J. A. & Lewis, T. R. (1986). “Oligopoly and Financial Structure: The Limited Liability Effect,” American Economic Review, 76(5), 956-970.
Publisher – Google Scholar
Brigham, E. & Gapenski, L. (1996). ‘Financial Management,’ Dallas: The Dryden Press.
Chevalier, J. A. (1995a). “Capital Structure and Product-Market Competition: Empirical Evidence from the Supermarket Industry,” American Economic Review, 85(3), 415-435.
Publisher – Google Scholar
Chevalier, J. A. (1995b). “Do LBO Supermarkets Charge More? An Empirical Analysis of the Effects of LBOs on Supermarket Pricing,” Journal of Finance, 50(4), 1095-1112.
Publisher – Google Scholar
Coricelli, F., Driffield, N., Pal, S. & Roland, I. (2009). “Excess Leverage and Productivity Growth in Emerging Economies: is there a Threshold Effect?,” CEPR Discussion Papers 7617, C.E.P.R. Discussion Papers.
Publisher – Google Scholar
Cornwell, T. B., Pruitt, S. W. & Clark, J. M. (2005). “The Relationship between Major-League Sports’ Official Sponsorship Announcements and the Stock Prices of Sponsoring Firms,” Journal of the Academy of Marketing Science, 33(4), 401-412.
Publisher – Google Scholar
Dekimpe, M. G. & Hanssens, D. M. (2010). “Time Series Models in Marketing: Some Recent Developments,” Marketing Journal of Research and Management, 1(1), 93-98.
Publisher – Google Scholar
Ehrhardt, M. C. & Brigham, E. F. (2006). ‘Financial Management: Theory and Practice,’ New York: Prentice Hall.
Fee, C. E., Hadlock, C. J. & Pierce, J. R. (2009). “Investment, Financing Constraints, and Internal Capital Markets: Evidence from the Advertising Expenditures of Multinational Firms,” Review of Financial Studies, 22(6), 2361-2392.
Publisher – Google Scholar
Gleason, K. C., Mathur L. K. & Mathur, I. (2000). “The Interrelationship between Cultures, Capital Structure, and Performance: Evidence from European Retailers,” Journal of Business Research, 50(2), 185-91.
Publisher – Google Scholar
Hadlock, C. J. & James, C. M. (2002). “Do Banks Provide Financial Slack?,” Journal of Finance, 57(3), 1383-420.
Publisher – Google Scholar
Huggett, M. & Ospina, S. (2001). “Does Productivity Growth Fall after the Adoption of New Technology?,” Journal of Monetary Economics, 48(1), 173–195.
Publisher – Google Scholar
Huyghebaert, N. (2006). “On the Determinants and Dynamics of Trade Credit Use: Empirical Evidence from Business Start-Ups,” Journal of Business Finance & Accounting, 33, 305–328.
Publisher – Google Scholar
Jedidi, K., Mela, C. F. & Gupta, S. (1999). “Managing Advertising and Promotion for Long-Run Profitability,” Marketing Science, 18(1), 1-22.
Publisher – Google Scholar
Jensen, M. (1986). “Agency Cost of Free Cash-Flow, Corporate Finance and Takeovers,” American Economic Review, 76(2), 323-339.
Publisher
Joshi, A. & Hanssens, D. M. (2010). “The Direct and Indirect Effects of Advertising Spending on Firm Value,” Journal of Marketing, 74(1), 20-33.
Publisher – Google Scholar
Kallapur, S. & Trombley, M. A. (1999). “The Association between Investment Opportunity Set Proxies and Realized Growth,” Journal of Business Finance & Accounting, 26, 505–519.
Publisher – Google Scholar
Krishnan, V. S. & Moyer, C. R. (1997). “Performance, Capital Structure and Home Country: An Analysis of Asian Corporations,” Global Finance Journal. 8(1), 129-143.
Publisher – Google Scholar
Kovenock, D. & Phillips, G. M. (1995). “Capital Structure and Product-Market Rivalry: How Do We Reconcile Theory and Evidence?,” American Economic Review, 85(2), 403-408.
Publisher – Google Scholar
Kovenock, D. & Phillips, G. M. (1997). “Capital Structure and Product Market Behavior: An Examination of Plant Exit and Investment Decisions,” Review of Financial Studies, 10(3), 767-803.
Publisher – Google Scholar
Lin, B.- W., Lee, Y. & Hung, S.- C. (2006). “R&D Intensity and Commercialization Orientation Effects on Financial Performance,” Journal of Business Research, 59(6), 679–685.
Publisher – Google Scholar
Majumdar, S. K. & Chhibber, P. (1999). “Capital Structure and Performance: Evidence from a Transition Economy on an Aspect of Corporate Governance,” Public Choice. 98(3-4), 287-305
Publisher – Google Scholar
Maksimovic, V., Stomper, A. & Zechner, J. (1999). “Capital Structure, Information Acquisition and Investment Decisions in an Industry Framework,” European Finance Review, 2, 251–271.
Publisher – Google Scholar
Mathur, L. K. & Mathur, I. (2000). “An Analysis of the Wealth Effects of Green Marketing Strategies,” Journal of Business Research, 50(2), 193–200.
Publisher – Google Scholar
Mathur, L. K., Mathur, I. & Rangan, N. (1997). ‘The Wealth Effects Associated With a Celebrity Endorser: The Michael Jordan Phenomenon,’ Journal of Advertising Research, 37(3), 67-73.
Google Scholar
McConnell, J. J. & Servaes, H. (1995). “Equity Ownership and the Two Faces of Debt,” Journal of Financial Economics, 39(1), 131-157.
Publisher – Google Scholar
Miyazaki, A. D. & Morgan, A. G. (2001). “Assessing Market Value of Event Sponsoring: Corporate Olympic Sponsorship,” Journal of Advertising Research, 41(1), 9-15.
Publisher – Google Scholar
Modigliani, F. & Miller, M. H. (1958). “The Cost Capital, Corporation Finance and the Theory of Investment,” The American Economic Review, 48(3), 261-297.
Publisher
Myers, S. C. (2001). “Capital Structure,” Journal of Economic Perspectives, 15(2), 81-102.
Publisher – Google Scholar
Nilsen, Ø. A., Raknerud, A., Rybalka, M. & Skjerpen, T. (2009). “Lumpy Investments, Factor Adjustments, and Labor Productivity,” Oxford Economic Papers, 61(1), 104–127.
Publisher – Google Scholar
Noe, T. H. (1988). “Capital Structure and Signaling Game Equilibria,” Review of Financial Studies, 1(4), 331–355.
Publisher – Google Scholar
Ozkan, A. (2000). “An Empirical Analysis of Corporate Debt Maturity Structure,” European Financial Management. 6(2), 197–212
Publisher – Google Scholar
Phillips, G. M. (1995). “Increased Debt and Industry Product Markets: An Empirical Analysis,” Journal of Financial Economics, 37, 189-238.
Publisher – Google Scholar
Power, L. (1998). “The Missing Link: Technology, Investment, and Productivity,” The Review of Economics and Statistics, 80(2), 300–313.
Publisher – Google Scholar
PricewaterhouseCoopers (2011). “2012 Outlook for the Retail and Consumer Products Sector in Asia,” PwC, 1-48.
Publisher
Rao, N. V., Al-Yahyaee, K. H. M. & Syed, L. A. M. (2007). “Capital Structure and Financial Performance: Evidence from Oman,” Indian Journal of Economics and Business. 7(2), 1-14.
Publisher – Google Scholar
Roden, D. M. & Lewellen, W. G. (1995). “Corporate Capital Structure Decisions: Evidence from Leveraged Buyouts,” Financial Management, 24(2), 76-87.
Publisher – Google Scholar
Ross, S. A. (1977). “The Determination of Financial Structure: The Incentive Signaling Approach,” Bell Journal of Economics, 8(1), 23–40.
Publisher – Google Scholar
Sharma, A. K. (2006). ‘Financial Leverage and Firm’s Value: A Study of Capital Structure of Selected Manufacturing Sector Firms in India,’ The Business Review, Cambridge, 6(2), 70-76.
Google Scholar
Stulz, R. M. (1990). “Managerial Discretion and Optimal Financing Policies,” Journal of Financial Economics, 26(1), 3-27.
Publisher – Google Scholar
Tan, T. K. (2012). “Financial Distress and Firm Performance: Evidence from the Asian Financial Crisis,” Journal of Finance and Accountancy, 11, 1-11.
Publisher – Google Scholar
The Boston Consulting Group – bcg.perspective (2011). “Shaping a New Tomorrow: How to Capitalize on the Momentum of Change,”
https://www.bcgperspectives.com/content/articles/financial_institutions_pricing_global_wealth_2011_shaping_new_
tomorrow/ [accessed 12.05.2012]
Publisher – Google Scholar
The Jakarta Globe. (2011). “Redefining Indonesia as a Market,”
http://www.thejakartaglobe.com/investment/redefining-indonesia-as-a-market/515893, [accessed 7.05.2012].
Publisher
The Jakarta Globe. (2011). ‘RI’s Fast-Moving Consumer Goods Industry Grows 11.8%,’ http://ppi.worldbank.org/reports/customQueryAggregate.asp, [accessed 7.05.2012].
The Jakarta Post. (2011). “RI’s Fast-Moving Consumer Goods Industry Grows 11.8%,” http://www.thejakartapost.com/news/2011/04/19/ris-fast-moving-consumer-goods-industry-grows-118.html,[accessed 12.05.2012].
Publisher
Titman, S. & Wessels, R. (1988). “The Determinants of Capital Structure Choice,” Journal of Finance, 43, 1-19.
Publisher – Google Scholar
Ward, M. & Price, A. (2006). ‘Turning Vision into Value,’ Pretoria: Van Schaik Publishers.
Google Scholar
Zeitun, R. & Tian, G. G. (2007). “Capital Structure and Corporate Performance: Evidence from Jordan,” Australasian Accounting Business and Finance Journal, 1(4), 40-61.
Publisher – Google Scholar