Introduction
Firm failure modeling again becomes relevant particularly since GFC (2007-2008) has led to a global recession (2008-2012) and increased number of failed firms in many countries. Good indicator of highly increased risk of Croatian firms’ failure during the recent recession is ratio of corporate non-performing and total loans. According to the Croatian National Bank (2014), this ratio in Croatia has risen from 8% (2008) up to 28% (2014), i.e. it has increased 3.5 times due to prolonged recession. Increased ratios of corporate non-performing loans are also observable in other post-socialist SEE economies like Slovenia (25% in 2012), Serbia (20% in 2012) and Bosnia and Herzegovina (15.3% in 2012).
If a firm, due to the accumulated losses, insufficient cash flows and unsettled debts, goes into the bankruptcy procedure, many stakeholders can be negatively affected. Also, for every investor/creditor firm failure risk represents an important element in investment/credit decision and therefore as a relevant issue from the stakeholder, investor/creditor viewpoint emerges the issue of modeling the firm failure i.e. determining the financial profile that distinguishes successful firms from failed firms.
Academic papers provide data on firm failure prediction models for different countries but are not directly comparable due to different definitions of firm failure and used research methodology. According to the literature, firm failure can be defined as bankruptcy, insolvency, default of payment, financial restructuring, etc. For the modeling purposes, academics often use sophisticated techniques such as logistic regression, rough sets, neural networks, fuzzy logic in order to improve prediction accuracy. As a general conclusion from the previous studies, it may be stated that financial ratios can be effectively used for the firm failure prediction.
In countries like Croatia which are bank oriented, the problem of firm failure is particularly interesting from the perspective of the banks. Namely, every bank must control and manage credit risk (among other business risks) in order to survive and earn sufficient profit. The idea that lies behind academic models for firm failure prediction is effectively used and applied in banks. Commercial banks often employ risk index models (“credit scoring models”) based on financial ratios and non-financial variables in order to evaluate firm failure risk. Therefore, it is very interesting to evaluate weather sophisticated modeling techniques (logistic regression and neural networks) significantly outperform risk index models.
The rest of the paper is organized as follows. Review of early and recent papers on firm failure prediction methodology and achieved level of prediction accuracy is presented in the second section of the paper. The third section deals with sample description, variables, methodology and empirical findings. The final section of the paper presents concluding remarks and issues for further research.
Review of previous firm failure research and modeling techniques
Modeling of firm failure in academic research
Although many papers point out that firm failure studies have started with seminal papers of Beaver (1966) and Altman (1968), there is even older evidence on academic research of this business phenomenon. Namely, in 1932 U.S. author Fitz Patrick analyzed firm failure of industrial firms by comparing financial ratios of failed and nonfailed firms. His findings indicated that the difference among ratios of failed and nonfailed firms exist at least for three years before firm failure.
In the 1966 paper of Beaver, he defines failure as inability of firm to pay its financial obligations as they mature. Such definition of failure incorporated bankruptcy, bond default, bank account overdrawn and non payment of preferred stock dividend. Beaver’s research sample included 79 failed firms and paired 79 nonfailed firms. Nonfailed firms were matched to failed firms by asset size and industry. Dichotomous classification test has revealed that best ratio for prediction of firm failure was ratio cash flow/total debt. The use of data one year before failure resulted with prediction error of 13%, i.e. classification accuracy of 87%. With older data prediction accuracy declines, thus for example data four years before failure resulted with error of 24% and classification accuracy of 76%.
A significant improvement in research methodology was the application of multivariate analysis, i.e. multiple discriminant analysis-DA (Altman, 1968). For the purpose of research, firm failure definition was limited only to firm’s bankruptcy. The sample of failed firms included 33 firms which declared bankruptcy in the period 1946-1965, while the sample of 33 nonfailed firms was matched by industry, size and year. In the initial set of independent variables, Altman used a large number of financial ratios, but in the final step in DA model identified only five ratios (working capital/assets, retained earnings/assets, EBIT/assets, market value of equity/book value of equity and sales/assets) as significant for firm bankruptcy prediction. Altman’s model had classification accuracy of 95%, i.e. model error was 5% with data one year before bankruptcy. Classification error has increased up to 17% percent with data two years before bankruptcy, indicating classification accuracy of 83%. After Altman’s initial usage of DA, many later papers (Edminister, 1972; Deakin, 1972; Pindado and Rodrigues, 2004; Vuran, 2009; etc.) used the same methodology.
Deakin (1972) was the first one that questioned Altman’s usage of DA. Namely, one of the basic DA assumptions is that observations in each group (failed and nonfailed) are randomly selected. Altman in his 1968 paper as well as many later authors did not use the random selection, but match pair sample approach. Deakin used randomly selected 11 failed and 23 non-failed firms and developed failure prediction model. Classification error of the model was relatively low up to three years before bankruptcy (3-4.5%), but for the fourth and fifth year before bankruptcy prediction error has sharply risen (21% and 17%). Such finding revealed that sample selection procedure directly affects model prediction accuracy, i.e. increased number of healthy firms in the sample leads to decreased classification accuracy in the segment of failed firms.
Another author who has raised questions about the usage of DA in failure studies was Ohlson (1980). He pointed out that DA has two very restrictive requirements, a requirement for normality of predictors and requirement for the same variance-covariance matrices for both groups (failed and nonfailed), which empirically can be rarely satisfied. In order to overcome DA mentioned problems, Ohlson decided to use logit model, statistical method which does not have any assumptions on a priori probabilities and distribution of predictors. Ohlson did not use match pair sample, but he used 105 listed bankrupted firms and randomly chosen 2,058 nonbankrupted firms. Classification accuracy of the developed model was 96.3%.
After Olson’s initial usage of logit model, many papers after 1980’s (Zmijewski, 1984; Mossman et al, 1998; Nam, Jinn, 2000; Altman, Sabato, 2007; Pervan, Pervan, Vukoja, 2011; Pervan, Kuvek, 2013, etc.) used some type of conditional probability model. These statistical techniques are more robust in comparison with DA since there are no requirements for data normality and equality of dispersion matrices. Although, there is a large body of firm failure literature, still there is no clear evidence which statistical method is the best for the modeling of firm failure. Studies reach heterogeneous conclusions and therefore there is no resulting consensus on statistical method choice (Balcaen and Ooeghe, 2006).
In recent time, new more sophisticated methods are developed and used in order to reach higher predictive power of firm failure models. Here, we can point out very frequent usage of neural networks (Tsai and Wu, 2008; Kim and Kang, 2010; Lee, Choi, 2013), recursive partitioning (Marais et al, 1984; Muller, et. al, 2009), hazard models (Abdullah et. al, 2008, Bakhsnani, 2013; Fijorek and Grotowski, 2012; Foster and Zurada, 2013) and fuzzy models (Matviychuk, 2010; Karami et al, 2012). Some of the recent research indicated that modern techniques outperform classical methods (DA and logistic regression-LR), while some report similar level of failure prediction accuracy.
Risk index models of firm failure
Academic discussion of simple risk index models is pretty limited. One of the early authors dealing with this approach was Tamari (1966). He designed index with six elements and total score of 100. As index elements, he has decided to use the following: capital/liabilities, profit trend, current ratio, production/inventory, sales/receivables and production/working capital. Empirical testing of the model has shown that only 3% of firms with high value of index (more than 76 points) went into bankruptcy, while 52% of firms with low index value (less than 21 points) went into the bankruptcy. Similar approach for failure modeling with simple index used Moses and Liao (1987). Authors developed the model with three variables: leverage, liquidity and turnover. Empirical testing of the index has resulted with accuracy of 85% for failed firms, 73% for healthy firms and 79% on average.
Prediction of firm failure is very interesting especially in commercial banks, which often develop internal models for failure prediction in order to manage credit risk. Large banks develop internal models based on large data-bases and sophisticated statistical techniques. But, anecdotal evidence showed that many small banks also use risk index models. According to risk index models banks calculate risk score, which indicates firm’s financial health and probability of failure. Banks define thresholds which indicate level of failure probability and according to achieved clients score bank defines crediting decision. Namely, firms with better score have lower probability of failure and therefore represent clients which can be financed with lower interest rate and lower collateral requirements. On the other side, firms below the defined index threshold represent very risky clients and therefore cannot obtain financing from the bank. In-between the highest and the lowest score thresholds, there may be a certain number of risk groups, each one with different client status and financing conditions.
Pervan and Peko in 2008 paper presented risk index models for two Croatian commercial banks (Banks “A” and “B”). Both banks use qualitative (soft) variables and quantitative (financial ratios) variables. In the case of Bank “A”, the following index was calculated on the basis of five financial ratios:
Table 1: Financial ratio index for manufacturing firms (Bank “A”)
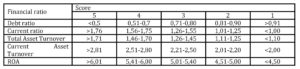
On the basis of the previous table risk score is calculated for each firm in the range between 5 and 25. Some additional score corrections are done on the basis of the reported financial result (gain or loss), ratio of sales/liabilities and average settlement period. Calculated score is combined with the score obtained from “soft variables” (management quality, accounting quality, business planning, technology and ownership risk) and available collateral value in order to reach decision on crediting terms.
A very similar approach to risk index calculation is developed by Bank “B”, where the following index was applied:
Table 2: Financial ratio index for manufacturing firms (Bank “B”)
In the case of Bank “B”, calculated score is again combined with score calculated for “soft variables” (management quality, firm reputation and technology level) and industry analysis in order to reach decision on crediting terms for each client.
Jakaša (2012) in Masters’ thesis has developed risk index model, starting with initial set of 10 financial ratios. Testing of all variables was done on the sample of 354 SME from Croatia. The research sample included 154 healthy firms and 200 failed firms, where failure is defined as insolvency for more than 90 days (firm default). Empirical test has confirmed that the following three variables had the highest impact on failure classification accuracy:
• EBITDA
• Current liability settlement capacity (OCF/Interest + Short term debt + Current portion of long term debt)
• Crediting capacity of firm ((OCF-Interest)*7/ Short term debt + Long term debt).
On the basis of index which has included the previously described three variables, the author concluded that classification accuracy reaches 85% on average (86% for failed firms and 84% for healthy firms).
Empirical research
Research sample and variables
The research sample includes data for Croatian manufacturing firms retrieved from the Amadeus database (January 2015). For the purpose of research, we have decided that failed firm definition includes insolvent firms, i.e. in searching Amadeus database we have used criterion Status Active, Insolvency proceedings and Default of payment. After elimination of missing data firms, subsample of failed firms incorporated data for 323 observations. For each failed firm we have selected one healthy manufacturing firm similar in size.
An important element of the analysis was the selection of financial ratios that should explain probability of firm insolvency. In the selection of financial ratios, we have decided to use all major financial ratios groups: liquidity, activity, financial structure, profitability and cash flow. On the basis of financial statements from one year before insolvency (t-1), we have selected the following 15 financial ratios that were often used in bankruptcy literature:
1. ROE
2. ROA
3. Profit margin
4. EBITDA Margin
5. EBIT Margin
6. Cash flow / Operating revenue
7. Net assets turnover
8. Stock turnover
9. Stock turnover
10. Collection period
11. Credit period
12. Current ratio
13. Liquidity ratio
14. Shareholders liquidity ratio
15. Solvency ratio.
Before choice of classical statistical methods and empirical tests, it was useful to test potential independent variables normality. All data analysis was done with the usage of IBM® SPSS® 22 Statistics software. In order to test for financial ratios normality, we have used Kolmogorov-Smirnov test. The Kolmogorov-Smirnov test resulted with the conclusion that all 15 financial ratios did not follow normal distribution and therefore rather than DA we have decided to use logistic regression-LR as a classical statistical method.
Although LR is a more robust method than DA, an important issue in its application can be the problem of multicollinearity among independent variables. Since some of the financial ratios that we selected use the same variables in the calculation, there is a real possibility of multicollinearity problem in the estimated model. The problem of multicollinearity in the estimated model causes inefficiently estimated parameters and high errors, which in turn results with many insignificant variables and high explanatory power of the estimated model (Hair et al, 2010). In order to control this problem, we have decided to use matrix of Pearson Correlation coefficients, where correlation higher than 0.8 indicates multicollinearity problem. Matrix of Pearson Correlation coefficients revealed that some of the initially selected financial ratios were highly correlated, since they had coefficients higher than 0.8. After the elimination of the highly correlated independent variables, only the following financial ratios were used in further analysis: ROE, ROA, EBITDA Margin, Net assets turnover, Credit period, Current ratio and Solvency ratio.
Before conducting multivariante analysis, it was useful to apply t-test (Table 3) for testing equality of financial ratio means in order to discover variables which should be the best discriminators among solvent and insolvent firms.
Table 3: T-test for Equality of Means
T-test (Table 3) has revealed that all variables (except Net asset turnover) have statistically significant mean differences and therefore represent potentially good discriminators among solvent and insolvent firms.
Failure prediction model based on logistic regression
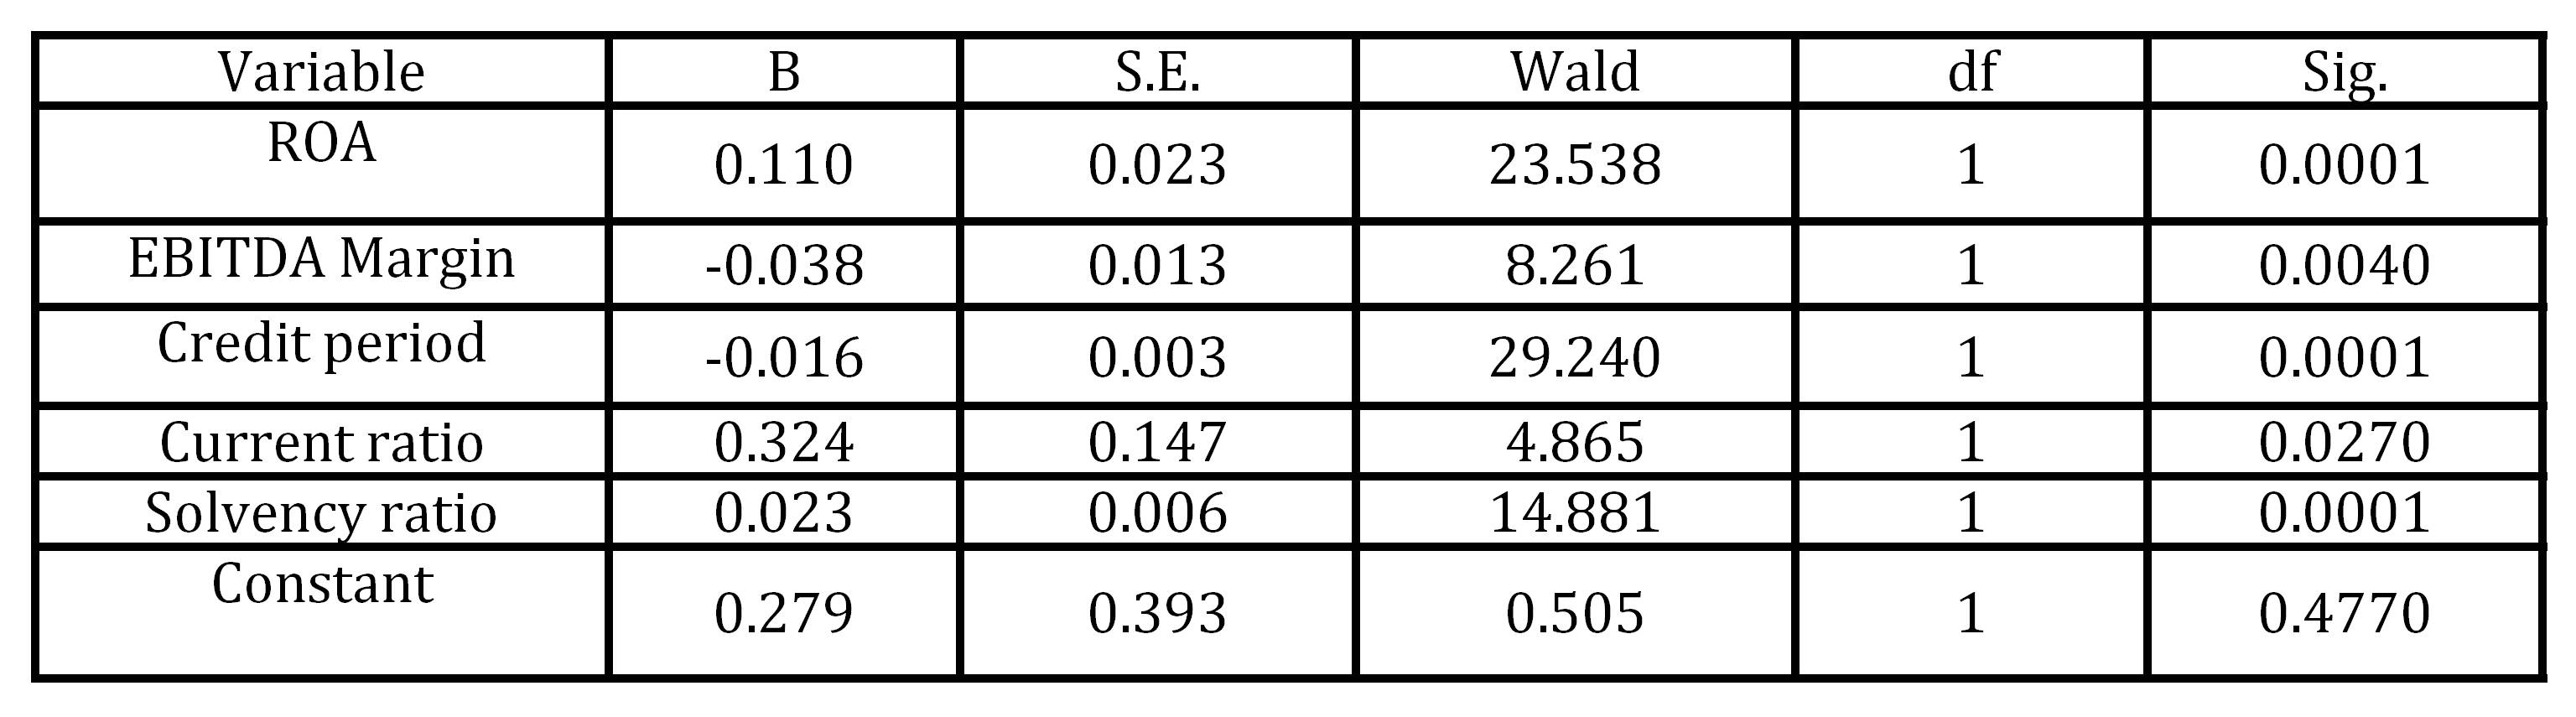
In the final step of LR model, the calculated value of Chi-square was 18.3, with significance of 0.045% indicating that the overall fitting of the estimated model for insolvency prediction is good. Another approach of measuring the LR model fitting is Nagelkerke R Square. In this model, Nagelkerke R Square was 53.4% indicating a moderate relationship between the used financial ratios and insolvency prediction. The final LR model (Table 4) included five independent variables, while the constant was statistically insignificant.
Table 4: Variables in LR model
Table 4 indicates that three variables (ROA, Current ratio and Solvency ratio) have the positive sign meaning that increase of profitability, liquidity and self-financing increases the probability of firm being solvent. Two statistically significant variables (EBITDA Margin and Credit period) have a negative sign indicating that the increase of these variables decreases the probability of firm being solvent. All obtained variable signs are logical (except EBITDA margin) since increase of profitability, liquidity and solvency indicates better financial health, which should result with higher probability of being solvent.
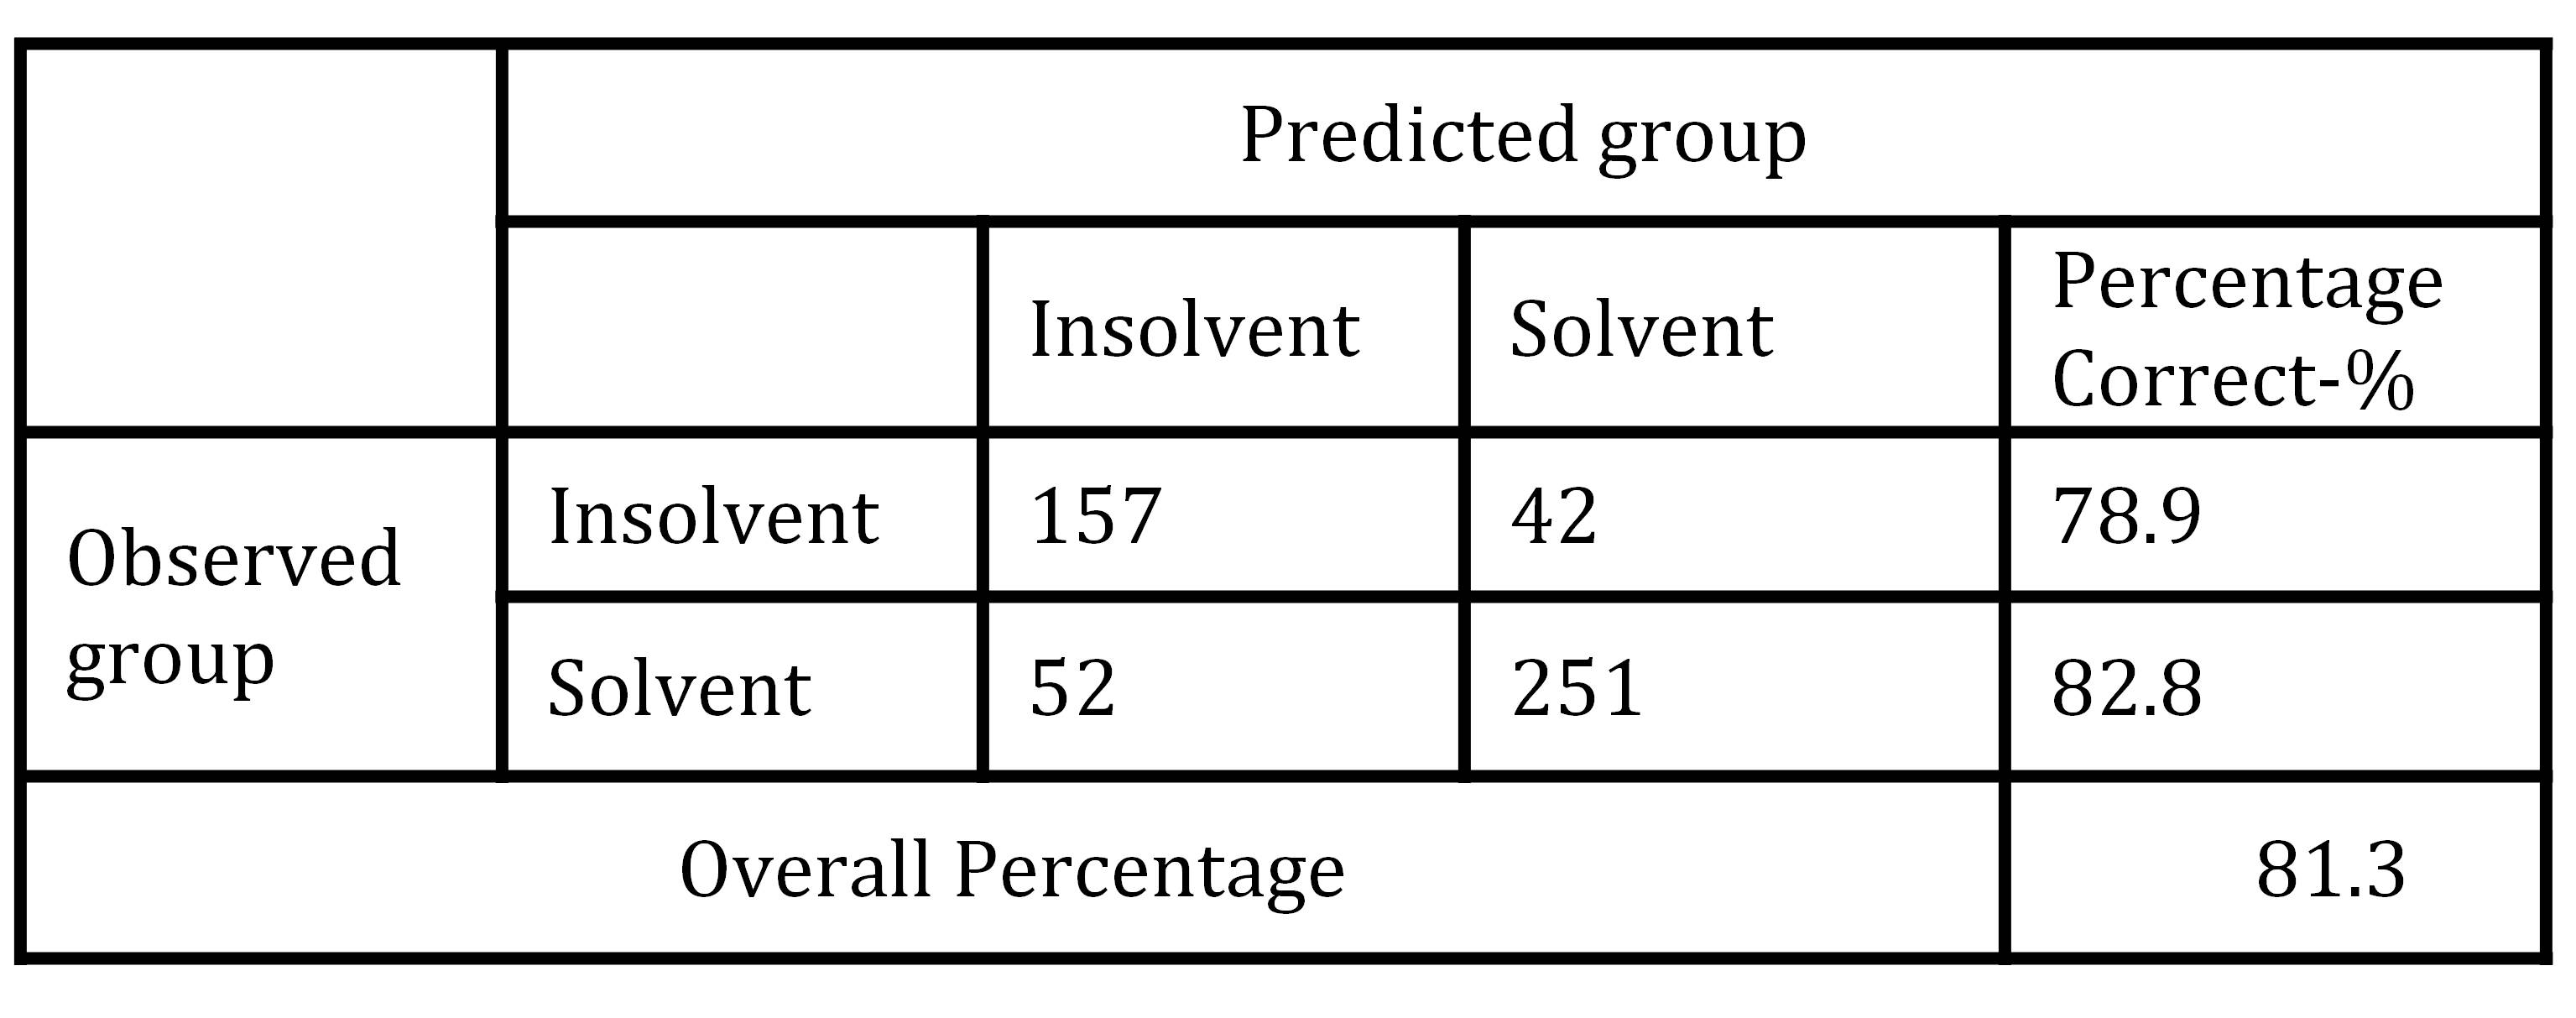
Table 5: Classification results of LR model
The LR model classification accuracy for healthy firms was 82.8%, for insolvent firms 78.9%, while total accuracy was 81.3%. Similar level of classification accuracy was achieved in earlier failure prediction studies dealing with Croatian firms (Pervan, Pervan and Vukoja, 2011; Pervan and Kuvek, 2013).
Failure prediction model based on artificial neural networks
Artificial neural network (ANN) is a problem solving methodology which is inspired by the biological nervous system. ANN represents the network of a large number of interconnected neurons working simultaneously in order to solve a problem. The Classical structure (multilayer perceptron) of ANN includes (Tsai, Wu, 2008):
• Input layer
• Hidden layers
• Output layer.
ANN learns from the experience (input data), generalizes previous experience and makes decision using testing data. Significant difference of ANN usage for failure prediction in comparison with statistical methods like LR is the fact that ANN cannot evaluate model parameters. Instead of that, ANN calculates the importance of model variables on the scale from 0 to 1. For the purpose of empirical testing, we have decided to split the original data set 70%-30%. Namely, 70% of observations were used for ANN training, while 30% were used for testing.
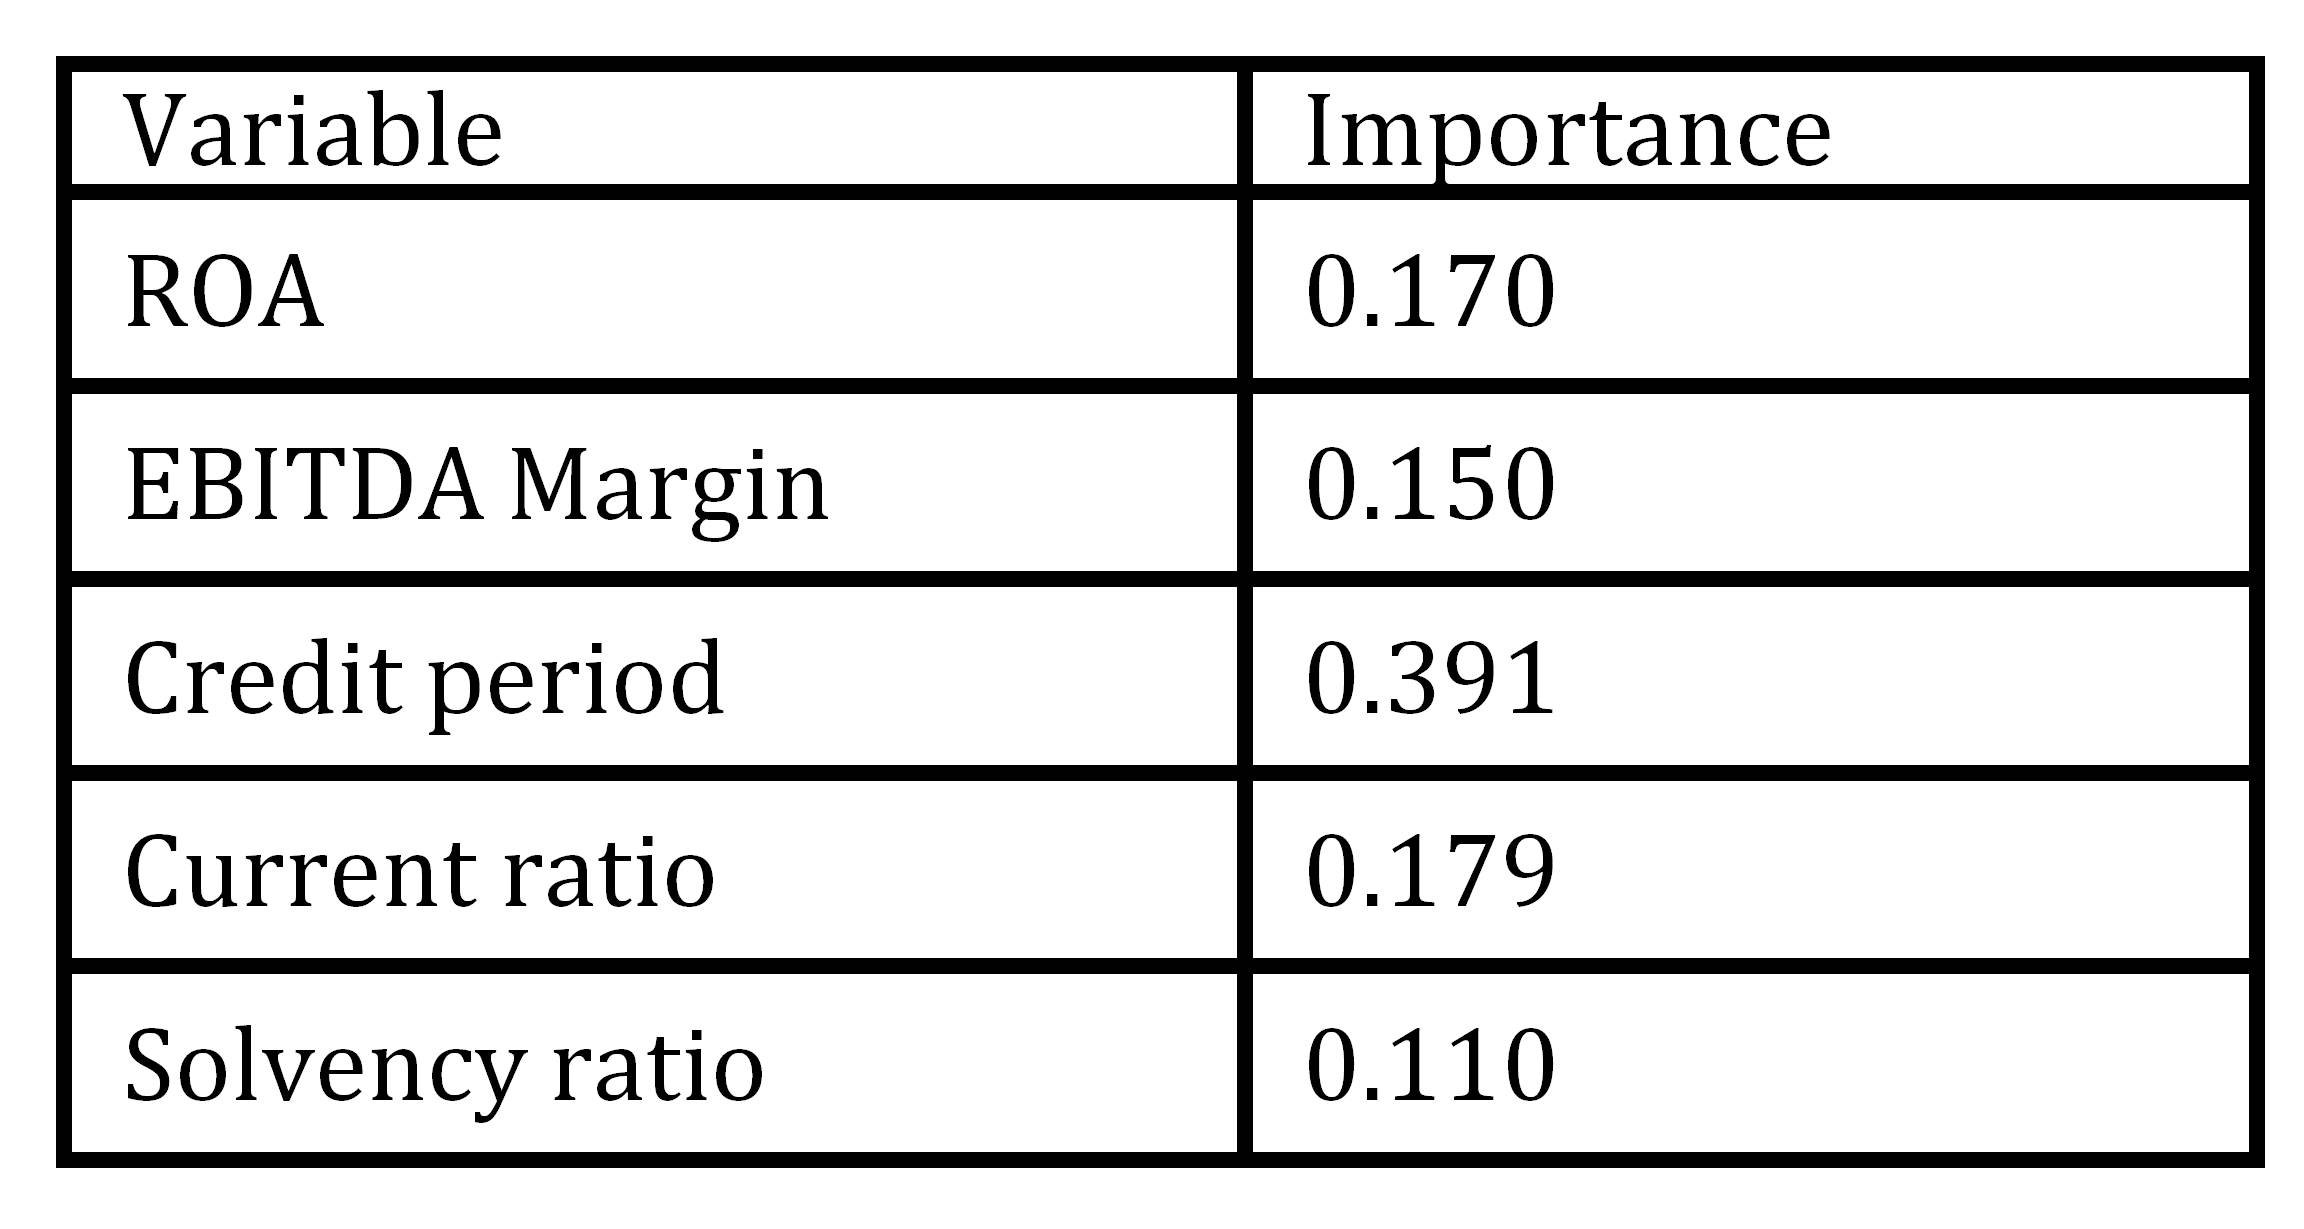
In developing ANN, we have selected the same variables like in LR model. According to the ANN (Table 6), the highest importance had two liquidity ratios (Credit period and Current ratio). On the other side, Solvency ratio was evaluated as the least important variable. Such finding is logical since failed firms were insolvent firms, i.e. firms which cannot settle current liabilities, while Credit period and Current ratio describe firm ability to pay current liabilities. If firm failure was defined as bankruptcy than solvency ratio would be more important, while liquidity ratios might be relatively less important.
Table 6: Importance of ANN model variables
Classification accuracy of ANN appeared to be higher (87.0% on average) than in developed LR model (81.3% on average). Similar findings which indicated that ANN outperformed “classical” statistical methods can be found in papers of Lee and Choi (2013) and Muller, Steyn-Bruwer and Hamman (2009).
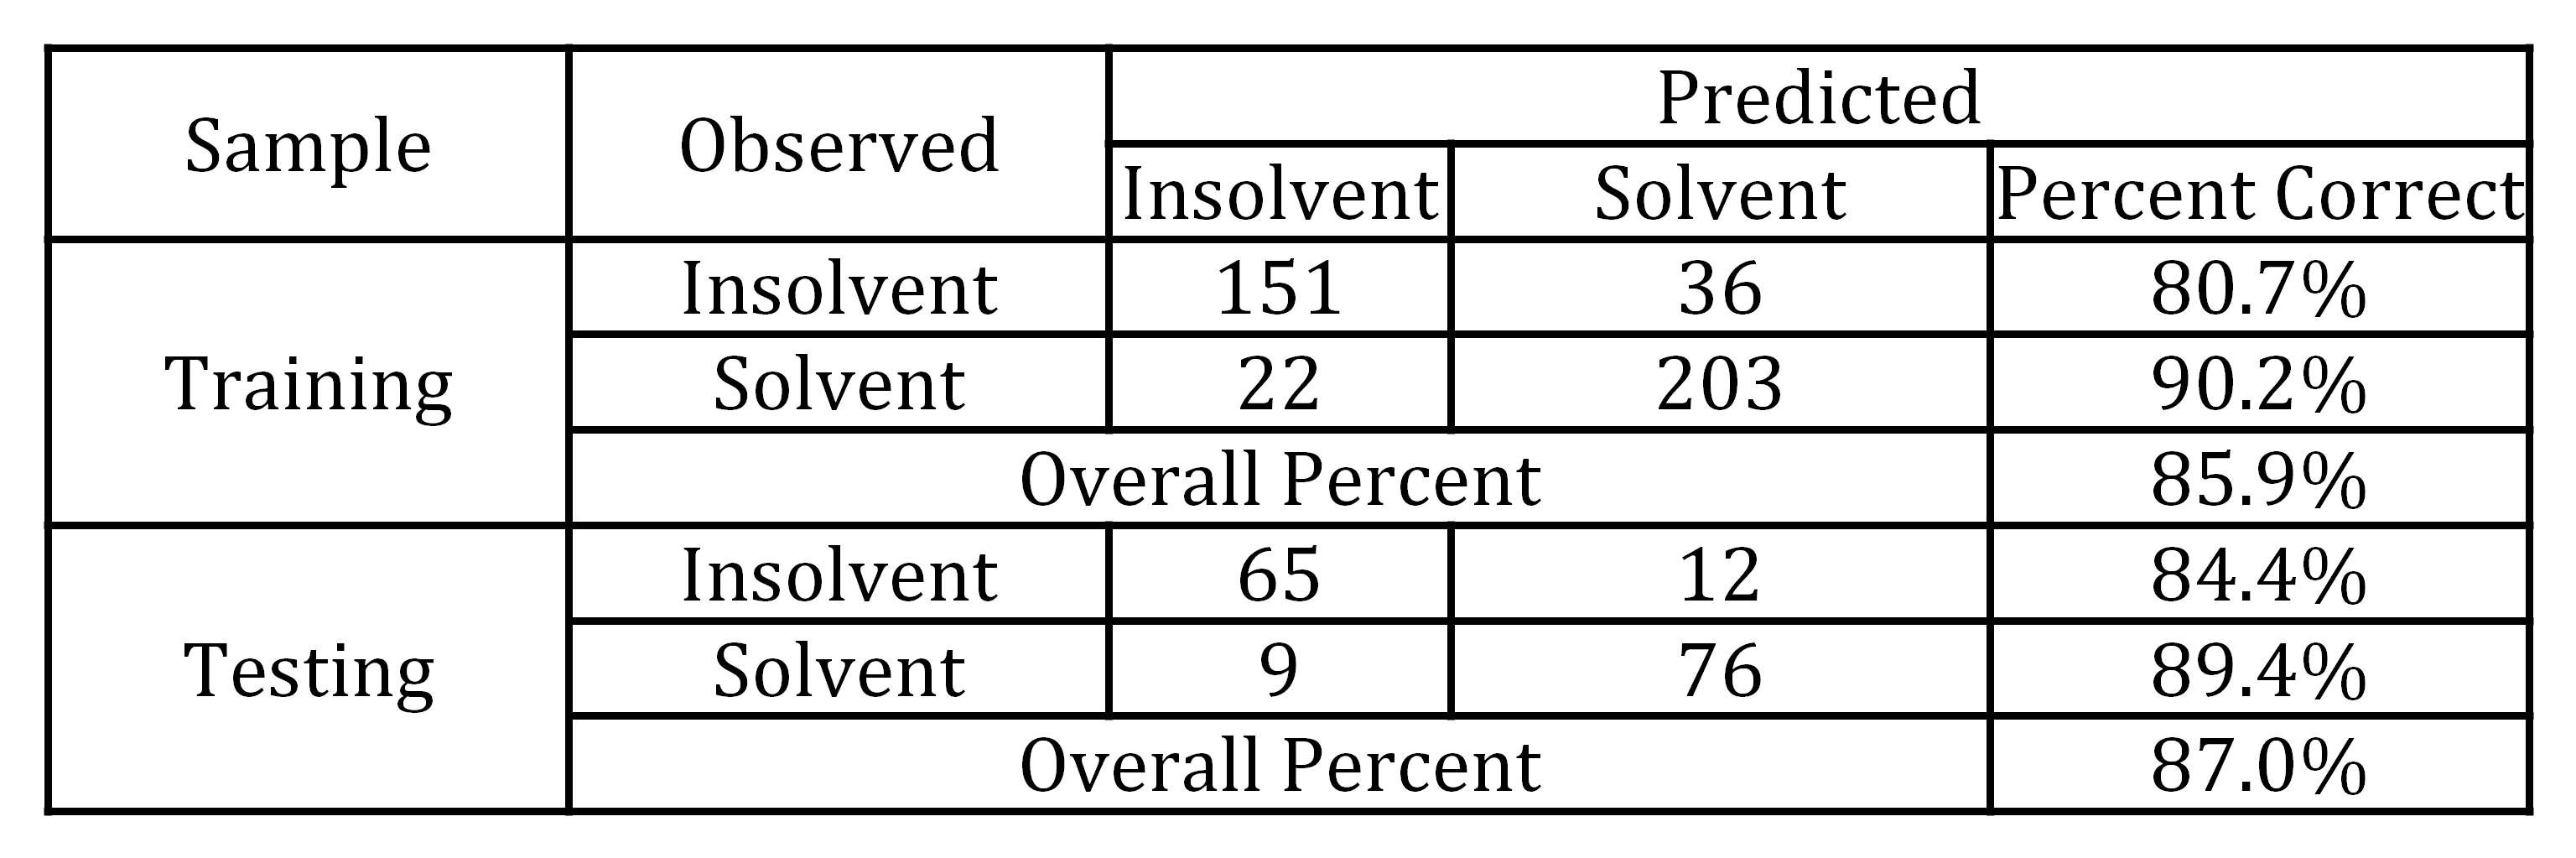
Table 7: Classification results of ANN
ANN model testing classification accuracy for healthy firms was 89.4 0%, while LR model had classification accuracy of 82.8% (6.6 p.p. difference). In the segment of insolvent firms, ANN accuracy was 84.4%, while LR model had classification accuracy of 78.9% (5.5 p.p. difference).
Failure prediction based on risk index
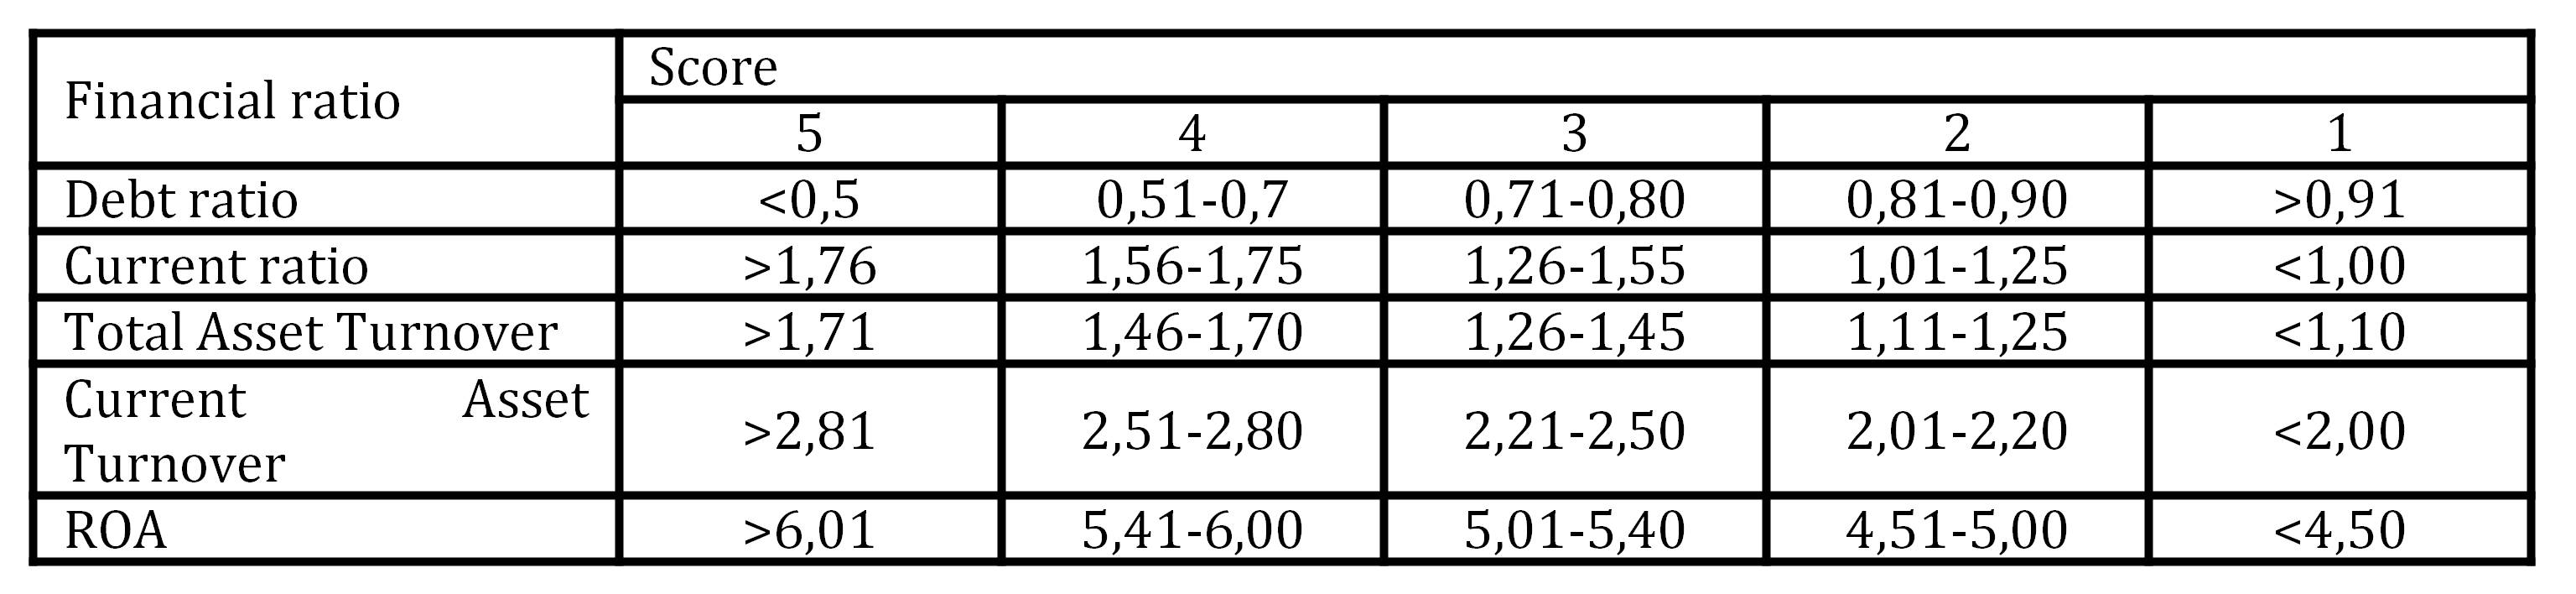
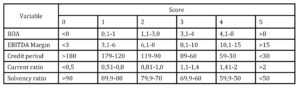
Risk index was developed on methodology similar to Bank “A” and Bank “B”, as described in section 2.2. Index is calculated by using five financial ratios (ROA, EBITDA Margin, Credit period, Current ratio and Solvency ratio) that were confirmed as good discriminators in univariant analysis, LR and ANN models. Each financial ratio was grouped into six value groups (intervals) and evaluated on the scale from 0 to 5 (Table 5).
Therefore, for each company in the sample the minimal score according to the developed index was 0, while the maximum score was 25. Index is designed in way that higher score represents higher financial health of the firm consequently lower insolvency risk and vice versa. Since score is evaluated in range from 0 to 25, we have decided to use the median value of 12.5 as a cut off value for the predicted group (solvent vs. insolvent). Namely, firms with score from 0 to 12.5 were classified as insolvent, while firms with score higher than 12.5 were classified as solvent.
Table 8: Financial ratios evaluation on the scale from 0 to 5
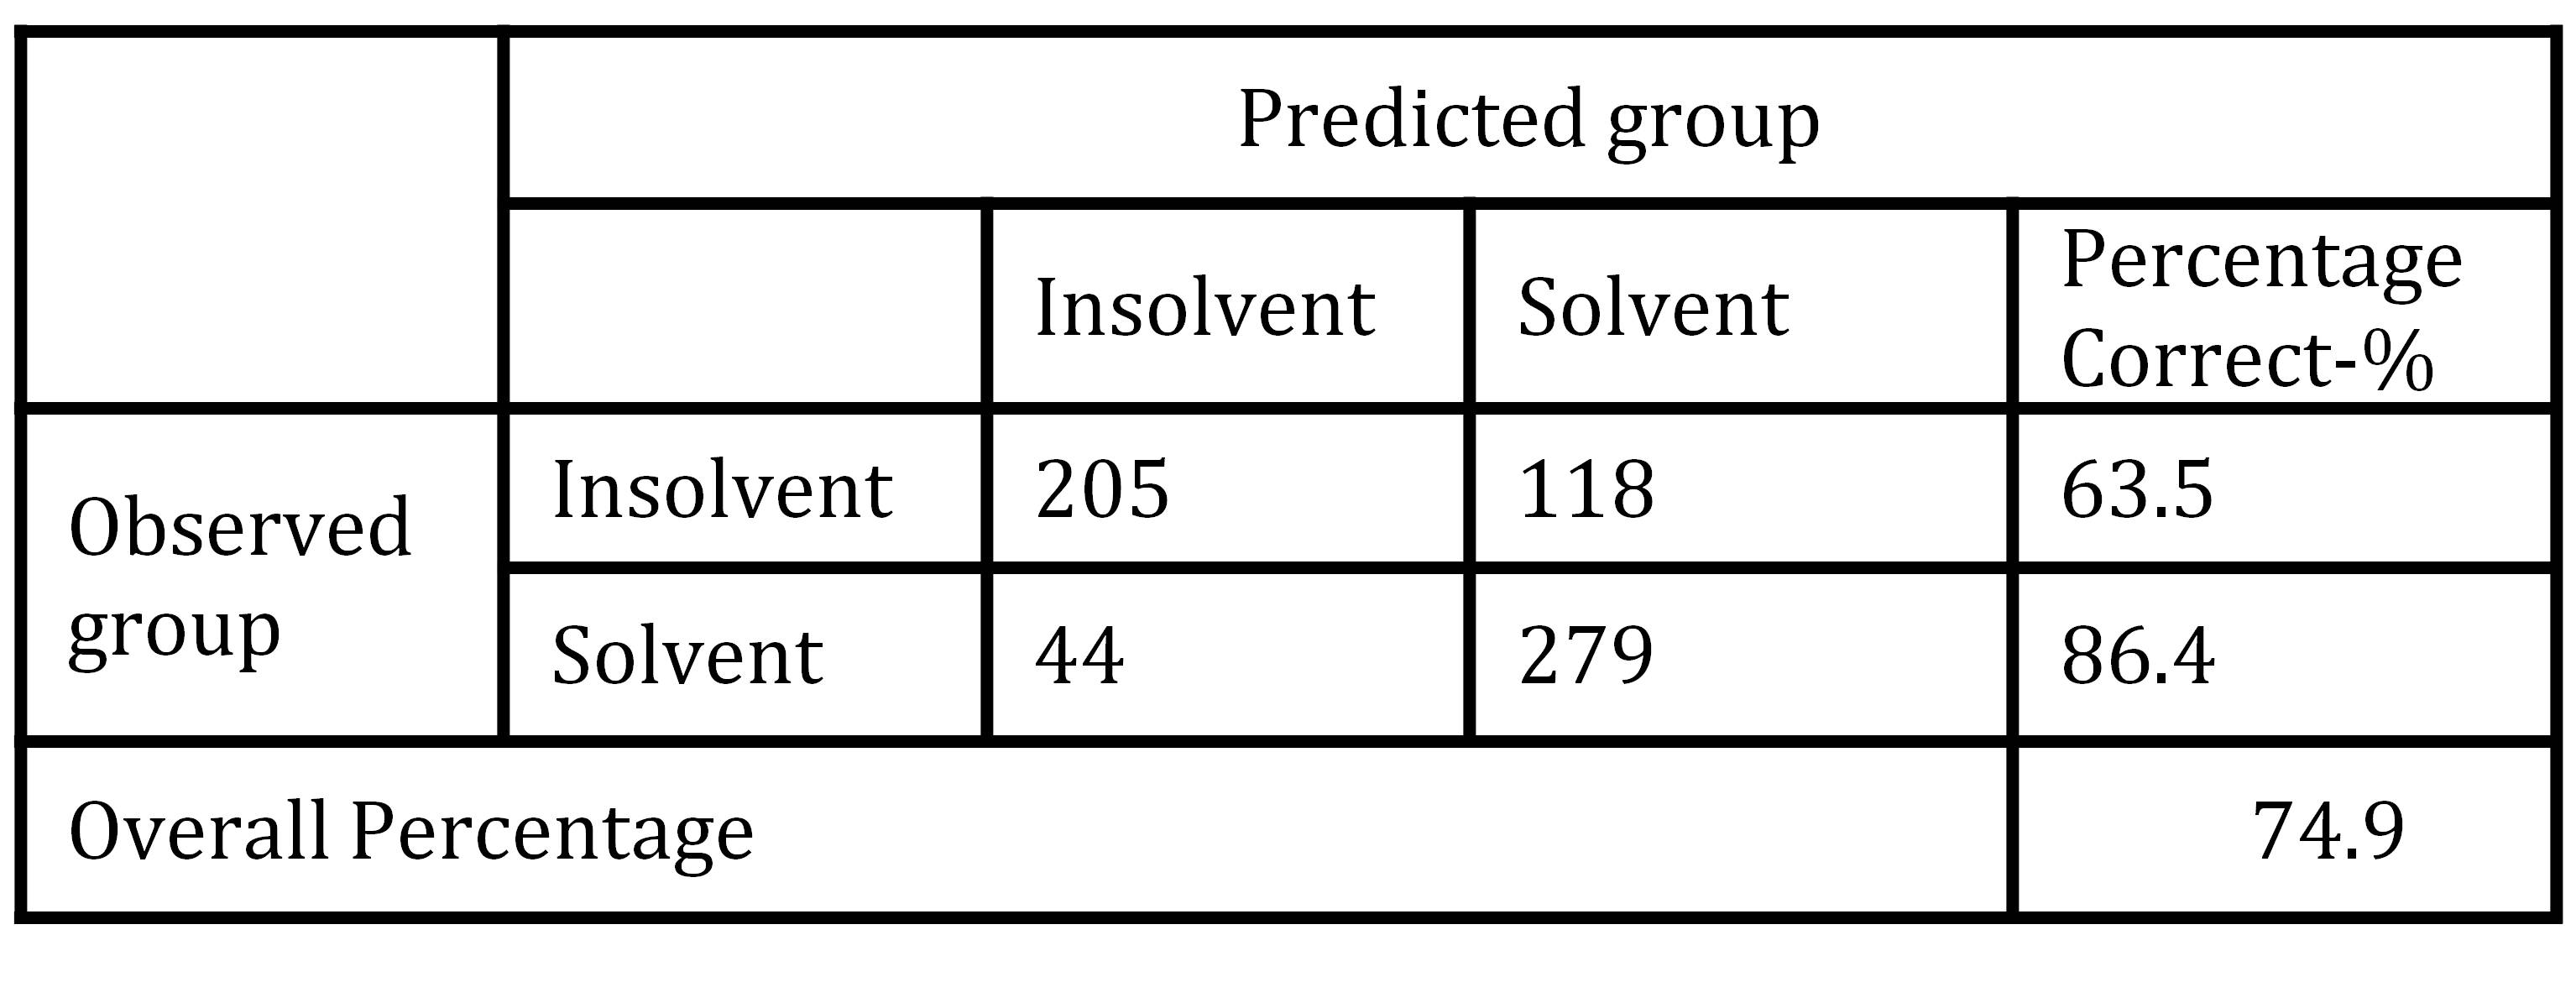
Empirical testing has shown that risk index model designed in this paper performs pretty well in the segment of solvent firms. Namely, out of 323 originally solvent firms according to the risk index model 279 firms scored higher than 12.5 points and were classified as solvent. Index error was evident for 44 solvent firms, which scored less than 12.5 points and were classified as insolvent (Table 9). Consequently, in the segment of solvent firms’ classification accuracy of designed risk index model was 86.4%, which was higher in comparison with LR model (82.8%), but lower in comparison with ANN (84.4%).
Table 9: Classification results of risk index model
However, in the segment of insolvent firms, risk index error was much higher. Out of 323 insolvent firms, risk index model correctly classified only 205 firms (63.5%) firms, while 118 firms’ (36.5%) were classified as solvent. Designed risk index model on average had classification accuracy of 74.9%, what was lower than the classification result of LR model (81.3%) or in ANN (87.0%).
Concluding remarks
In the current business environment where large a number of firms have financial problems, the issue of firm failure prediction is becoming more relevant, for both academics and practitioners. After more than 50 years of research, there are different prediction models, developed in different countries, using different samples and methodologies. In the recent time, new and more sophisticated methods emerged in research in order to achieve better failure prediction results. The author of this paper questioned the use of the very simple risk index model, a technique that is used in commercial banks by comparing its prediction performance with one classical statistical technique (logistic regression) and one very sophisticated technique (artificial neural network).
Empirical assessment of all three techniques failure prediction performance was done on the same sample of solvent and insolvent Croatian manufacturing firms. Empirical testing has shown that designed risk index model performed pretty well in the segment of solvent firms, where it had classification accuracy of 86.4%, which was higher than the result of logistic regression model (82.8%) but lower than the result of artificial neural network (89.4%). However, in the segment of insolvent firms the risk index model has shown moderate result in comparison with sophisticated techniques. Namely, in the segment of insolvent firms, classification accuracy reached only 63.5%, which was much lower in comparison with logistic regression model (78.9%) and artificial neural network (84.4%). Some future research might improve the risk index performance by calculating the optimal cut of value (rather than median value), by using weighted financial ratios or additional ratios that were not available for Amadeus database.
Empirical findings again confirm that financial ratios can be effectively used for insolvency risk prediction and management. Designed risk index model confirmed certain possibility of use, but also it was evident that logistic regression model and artificial neural network provide better classification results. That was especially obvious in the case of insolvent firms, which are very interesting to be identified by practical users in order to avoid losses. On the basis of such finding, we can conclude that it can be useful to invest time and money to develop a more sophisticated model in order to achieve more accurate failure predictions.
(adsbygoogle = window.adsbygoogle || []).push({});
References
1. Abdullah, N., Halim, A., Ahmad, H and Rus, R. (2008) ‘Predicting Corporate Failure of Malaysia’s Listed Companies: Comparing Multiple Discriminant Analysis, Logistic Regression and the Hazard Model,’ International research Journal of Finance and Economics, 15, 193-209.
2. Altman, E I. (1968) ‘Financial ratios, discriminant analysis and the prediction of corporate bankruptcy,’ Journal of Finance, 23 (4), 889-607.
Publisher – Google Scholar
3. Altman, E I and Sabato G. (2007) ‘Modeling credit risk for SMEs: Evidence from U.S. market,’ Abacus, 43 (3), 332-357.
Publisher – Google Scholar
4. Bakhsnani, S. (2013) ‘Bankruptcy prediction of appliances companies listed in Teheran Stock Exchange using proportional hazards regression,’ Interdisciplinary Journal of Contemporary Research in Business, 5 (2), 327-339.
5. Balcaen, S and Ooeghe, H. (2006) ‘35 years of studies and business failure: on overview of the classic statistical methodologies and their related problems,’ The British Accounting Review, 38, 63-93.
Publisher – Google Scholar
6. Beaver, W. (1966) ‘Financial ratios as predictor of failure,’ Empirical Research in Accounting, Empirical Studies, Journal of Accounting Research, 4, 71-111.
Google Scholar
7. Croatian National Bank (2014) Financial stability, Zagreb.
8. Deakin, E B. (1972) ‘A discriminant analysis of predictors of business failure,’ Journal of Accounting Research, 10 (1), 167-179.
Publisher – Google Scholar
9. Edminster, R O. (1972) ‘An Empirical Test of Financial Ratio Analysis for Small Business Failure Prediction,’ Journal of Financial and Quantitative Analysis, March, 1477-1493.
Publisher – Google Scholar
10. Fijorek, K and Grotowski, M. (2012) ‘Bankruptcy prediction: some results from large sample Polish companies,’ International Business Research, 9 (5), 70-77.
Publisher – Google Scholar
11. Fitz Patrick, P J. (1932) ‘A Comparison of Ratios of Successful Industrial Enterprises with those of failed Firms,’ Certified Public Accountant, October, 598-605; November, 656-662; December, 727-731.
12. Foster, B P and Zurada, J. (2013) ‘Loan defaults and hazard models for bankruptcy prediction,’ Managerial Accounting Journal, 28 (6), 516-541.
Publisher – Google Scholar
13. Hair, J F, Black W C, Babin B J and Anderson R E. (2010) Multivariate Data Analysis, Pearson Prentice Hall, New Jersey.
14. Jakaša, P. (2012) Developing a model for assessing the quality of financial statements in evaluating creditworthiness of companies, Faculty of Economics, Split.
15. Karami, G, Hosseini S M S, Attaran, N and Hosseini S M S. (2012) ‘Bankruptcy prediction using memetic algorithm with fuzzy approach: Empirical evidence from Iran,’ International Journal of Economics and Finance, 4 (5), 116-133.
Publisher – Google Scholar
16. Lee, S and Choi, W S. (2013) ‘A multi-industry bankruptcy prediction model using back-propagation neural network and multivariate discriminant analysis,’ Expert Systems with Applications, 40, 2941-2946.
Publisher – Google Scholar
17. Mueller, G H., Steyn-Bruwer, B W and Hamman, W D. (2009) ‘Predicting financial distress of companies listed on the JSE – A comparison of techniques,’ South African Journal of Business Management, 40 (1), 21-32.
Google Scholar
18. Marais, L, Patell J M, and Wolfson M A. (1984) ‘The Experimental Design of Classification Models: An Application of Recursive Partitioning and Bootstrapping to Commercial Bank Loan Classifications,’ Journal of Accounting Research, 22, 87-114.
Publisher – Google Scholar
19. Moses, D and Liao, S S. (1987) ‘On developing models for failure prediction,’ The Journal of Commercial Bank Lending, 69, 27-38.
20. Matviychuk, A. (2010) ‘Bankruptcy prediction in transformational economy: Discriminant and fuzzy logic approach,’ Fuzzy Economic Review, 15 (1), 21-28.
Google Scholar
21. Nam, J and Jinn, T. (2000) ‘Bankruptcy prediction: Evidence from Korean listed companies during the IMF crisis,’ Journal of International Financial Management and Accounting, 11(3), 178-197.
Publisher – Google Scholar
22. Ohlson, J A. (1980) ‘Financial ratios and the probabilistic prediction of bankruptcy,’ Journal of Accounting Research, 18 (1), 109-131.
Publisher – Google Scholar
23. Pervan, I and Peko, B. (2008) ‘Financial ratios in the bank models for evaluating the creditworthiness of companies,’ Accounting, Auditing and Finance, 9, 35-42.
24. Pervan, I., Pervan, M and Vukoja, B. (2011) ‘Prediction of company bankruptcy using statistical techniques,’ Croatian Operational Research Review, 11 (2), 158-166.
25. Pervan, I and Kuvek, T. (2013) ‘The relative importance of financial ratios and nonfinancial variables in predicting of insolvency,’ Croatian Operational Research Review, 13 (4), 187-197.
Google Scholar
26. Pindado, J and Rodrigues, L F. (2004) ‘Parsimonious models of financial insolvency in small companies,’ Small Business Economics, 22, 51-66.
Publisher – Google Scholar
27. Tamari, M. (1966) ‘Financial Ratios as a Means of Forecasting Bankruptcy,’ Management International Review, 6 (4), 15-21.
28. Tsai, C F, Wu, J W. (2008) ‘Using neural network ensemblers for bankruptcy prediction and credit scoring,’ Expert systems with applications, 34, 2639-2649.
Publisher – Google Scholar
29. Vuran, B. (2009) ‘Prediction of business failure: a comparison of discriminant and logistic regression analyses,’ Istanbul University Journal of the School of Business Adminstration, 38 (1), 47-65.
Google Scholar
30. Zmijewski, M E. (1984) ‘Methodological issues related to the estimation of financial distress prediction models,’Journal of Accounting Research, 22, 59-82.
Publisher – Google Scholar