Introduction
Performance as an economic category is a complex issue with a differentiated approach to its measurement and evaluation. Measurement and performance evaluation of a business is nowadays a very topical issue, but at the same time considerably extensive and complex process. According to Wagner (2009), in general, the performance can be defined as a characteristic describing the method or process by which the observed body carries out that activity, on the basis of similarity with the recommended implementing way of this activity. The performance concept should be seen as an attempt of the company for achieving the best possible value of the investments put in business activities (Frost, 2005). European Foundation for Quality Management (EFQM – European Foundation for Quality Management) defines “performance” as “moderate results achieved by individuals, groups, organizations and processes” (EFQM, 1999).
In its historical development, measuring the performance of an enterprise has passed from the normal reporting of profit margins through profit maximization, various types of profitability indicators and up to the criteria for achieving value for owners. The traditional way of searching the performance of enterprises is based on achieving desired financial indicators – profits, turnover or market share. The enterprise is ranked as powerful when it reaches the planned financial results.
During the last period there have been many significant changes not only in performance measurement approaches, but also changes in the use of methods and performance appraisal tools. Business performance measuring beginning dates back to the second half of the 20th century, in Western Europe and the USA, where the emphasis was to provide operational and tactical performance, and a key indicator of the performance was the result of management and profitability indicators, which began to be used later. As far as for the seventies and eighties of the 20th century, it is significant that the attention when measuring the performance of an enterprise was focused on innovations that resulted in the so-called advanced performance indicators that take into account the consequences of current actions and decisions for the future development of business performance and value of economic profit (they are indicators, such as MVA – Market Value Added, EVA – Economic Value Added). In the same period there is a harmonization of indicators, based on the harmonization of accounting data and methods for their detection. In the nineties of the 20th century there is a change in the assessment of performance when the assessment of business performance using indicators of profitability goes to the performance evaluation, which is expressed by changing the market value of the company and the value of free financial funds. In this period there is also criticism of synthetic indicators, mainly because of lack of understanding of the causes that affect their achievement and because they are mainly financial indicators.
According to CIMA (Chartered Association of Certified Accountants), financial ratio indicators can be divided according to the main areas in which these indicators are used in international practice while evaluating performance into (Petrik 2009) performance indicators that focus on the measurement of financial performance regarding profit, profitability and capital turnover; the indicators that assess the financial structure and solvency of the company; the group of investment indicators which measure the attractiveness of the enterprise for investors.
By Kislingerova (2011), the performance evaluation is traditionally carried out in three ways: evaluation by a set of indicators usually of five evaluation areas, namely liquidity, activity, capital structure, profitability and market value; evaluation by a set of indicators that are arranged in pyramidal breakdown products; evaluation using a single aggregate indicator that is the synthesis of partial indicators and other statistical data into one unit, which is one of prediction models.
The latest approaches to performance are aimed at assessing the level of the production system functioning, where it is necessary to measure the effectiveness of the transformation process and to implement for the measure except for financial indicators also the indicators of effectiveness and severity (Hyranek et al., 2014).
To quantify the performance, it is appropriate to use one of the most advanced performance indicators and indicator EVA – Economic Value Added. Stewart (1991) defines the economic value added (EVA) by a simple wording “EVA is a residual income that remains after, when the operating profit covers the full cost of capital.”
Methods for the calculation of EVA indicator have a few modifications: the method of entity (ie. the gross method, the method of Capital Charge), the equity method (i. e. the net method, the Value Spread) and the method APV – the present value (Adjusted Present Value Approach). Although the method of Capital Charge is considered the most accurate method of calculating the economic value added in the Slovak legislation, more appropriate seems to be the Value Spread method (Kiselakova et al. 2015). The essence of this method is to compare the return of equity (ROE) with the expenses on equity (re). The difference between these two values is called value spread (Value Spread). By Marik and Marikova (2005, p. 365), in spite of the declared, generally the most used method is entity method.
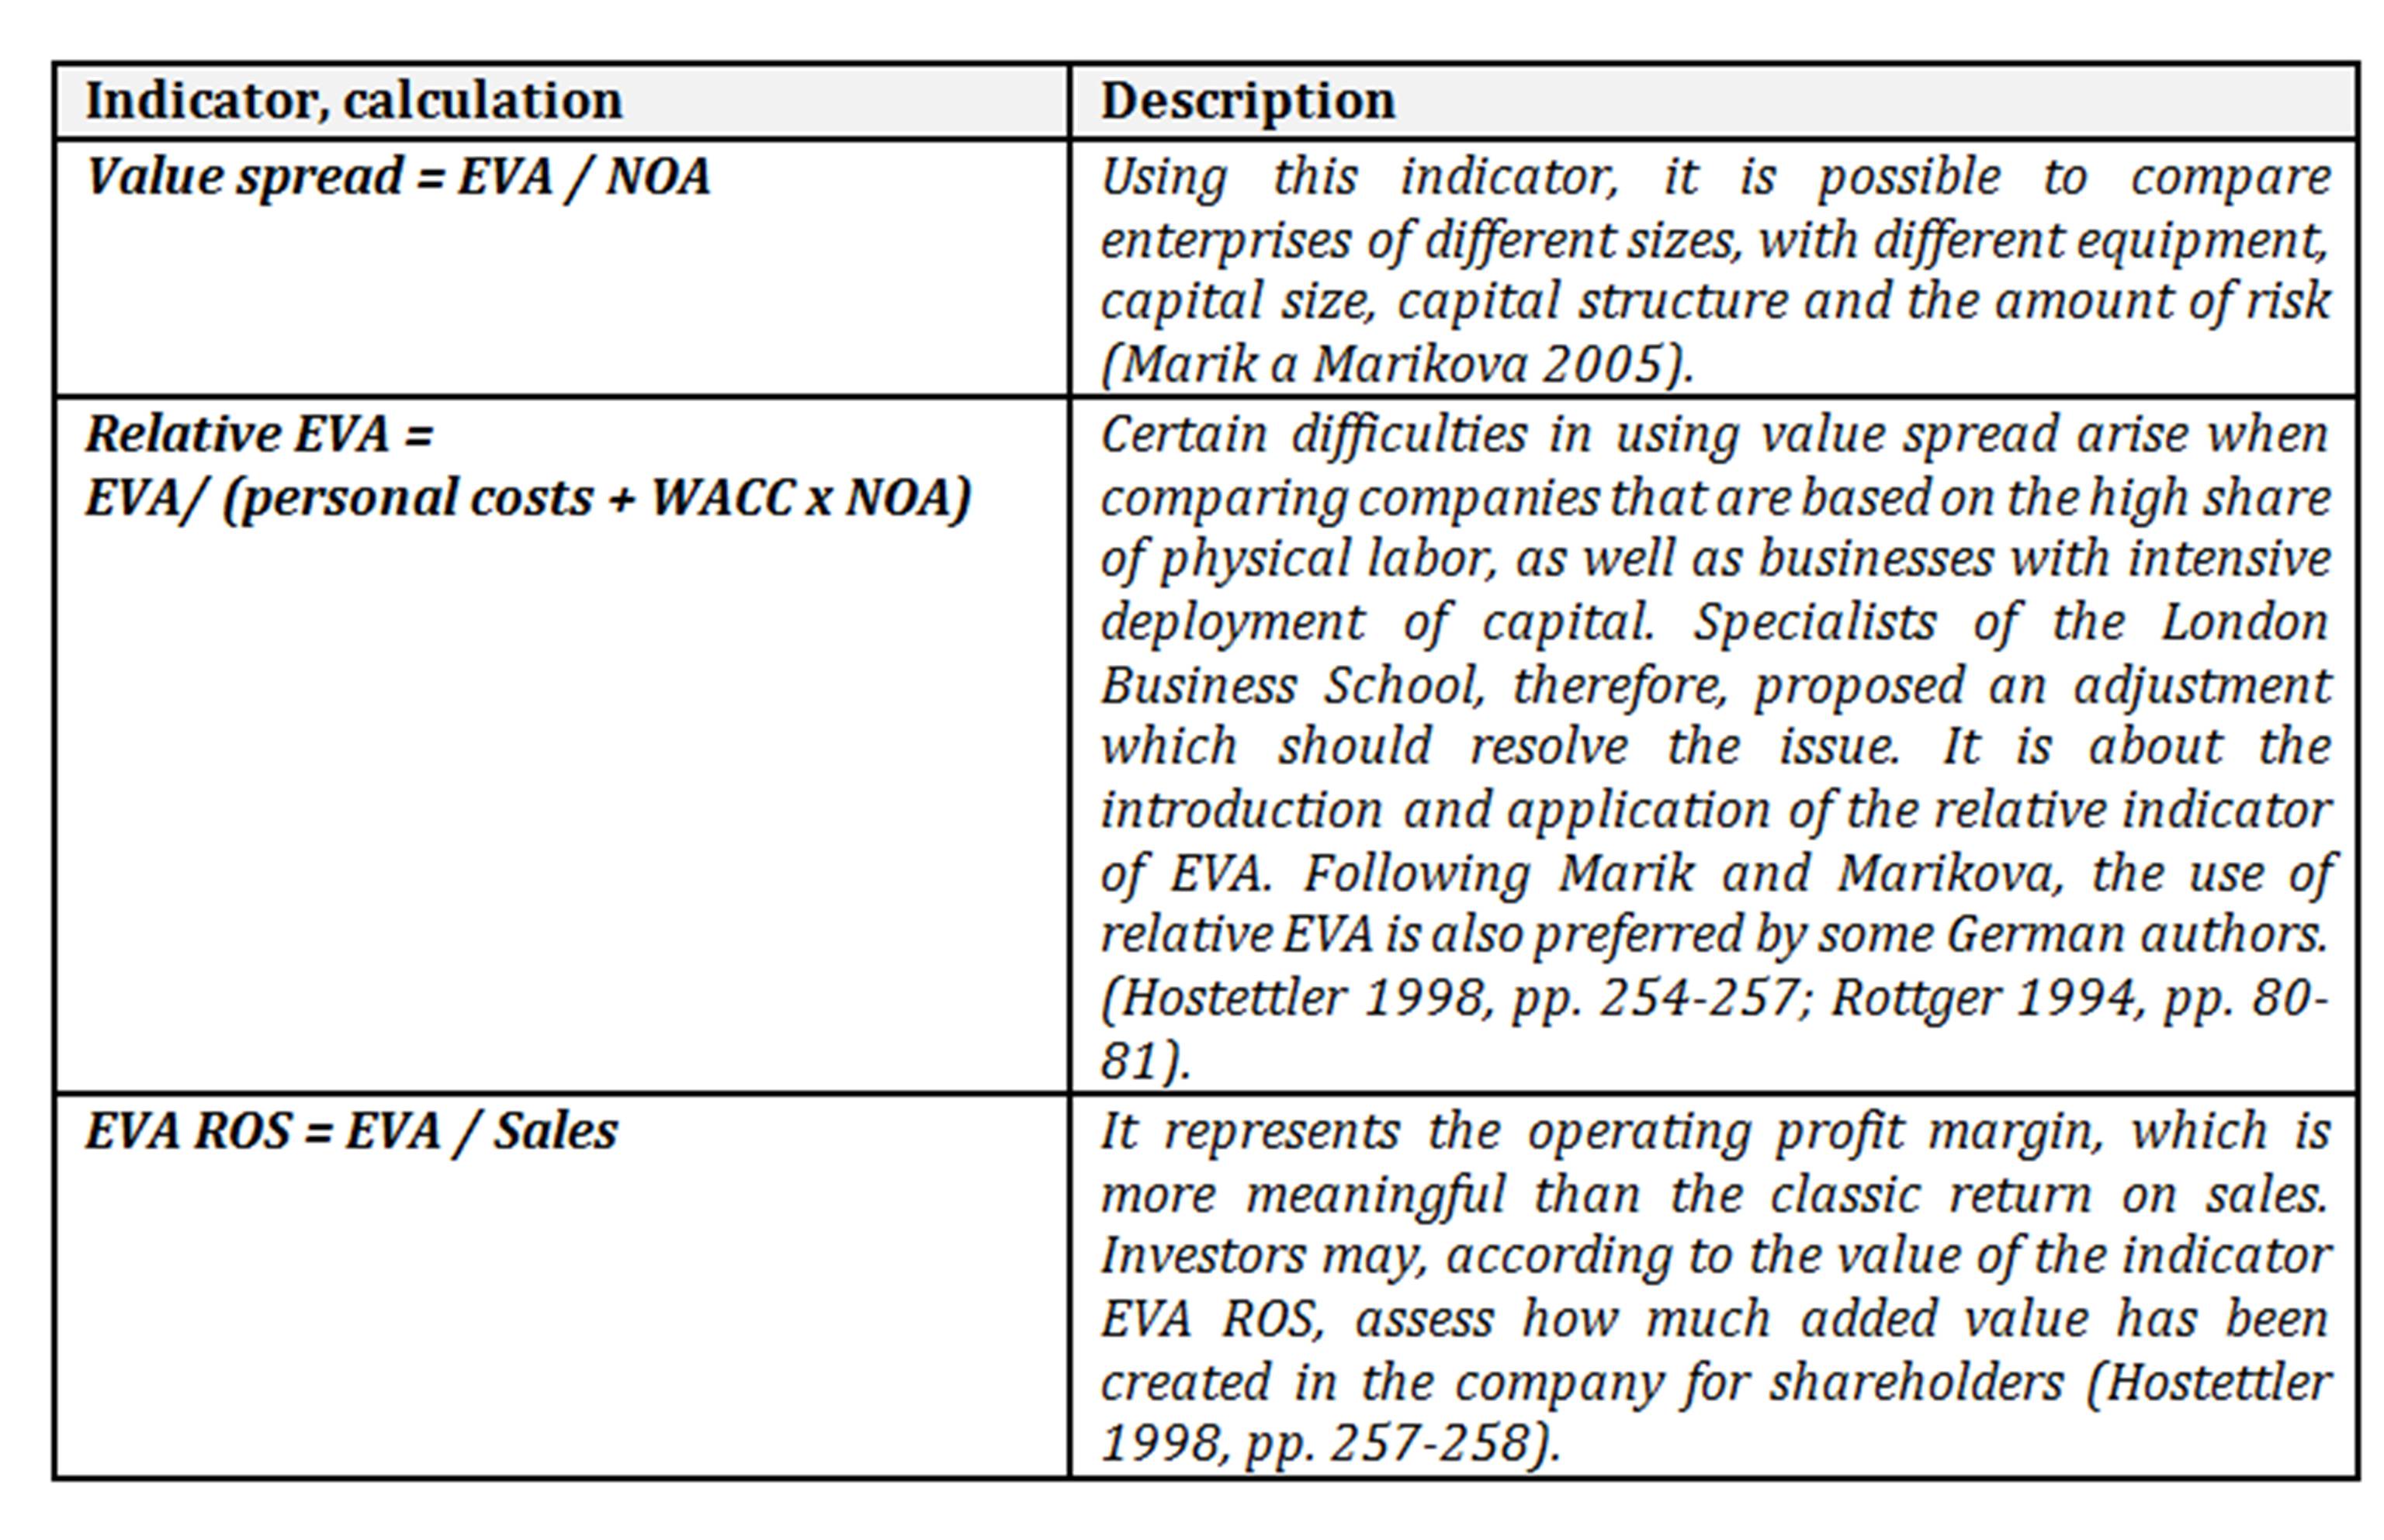
Recently, relative indicators EVA are coming to the fore when evaluating enterprise performance because they are gaining higher information value compared to the absolute indicator.
Table 1: Relative indicators of EVA
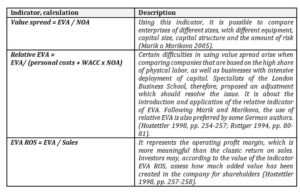
Source: Hostettler 1998; Marik and Marikova 2005; Rottger 1994
Materials and methods
The aim of the paper was to identify the key performance indicators of selected Slovak food enterprises and their use in drawing up the Enterprise Performance Model. Elaborating the Paper was based on secondary data from the financial statements of selected food enterprises, we have obtained from publicly available data of Commercial Bulletin and enterprises database accounts registered by company CRIF – Slovak Credit Bureau, ltd.
The sample consists of 200 food enterprises in Slovakia. In terms of the structure in the sample there are 56.5 % (113 enterprises) represented by medium-sized enterprises (25 – 249 employees) and 43.5 % represented by small enterprises (87 enterprises).
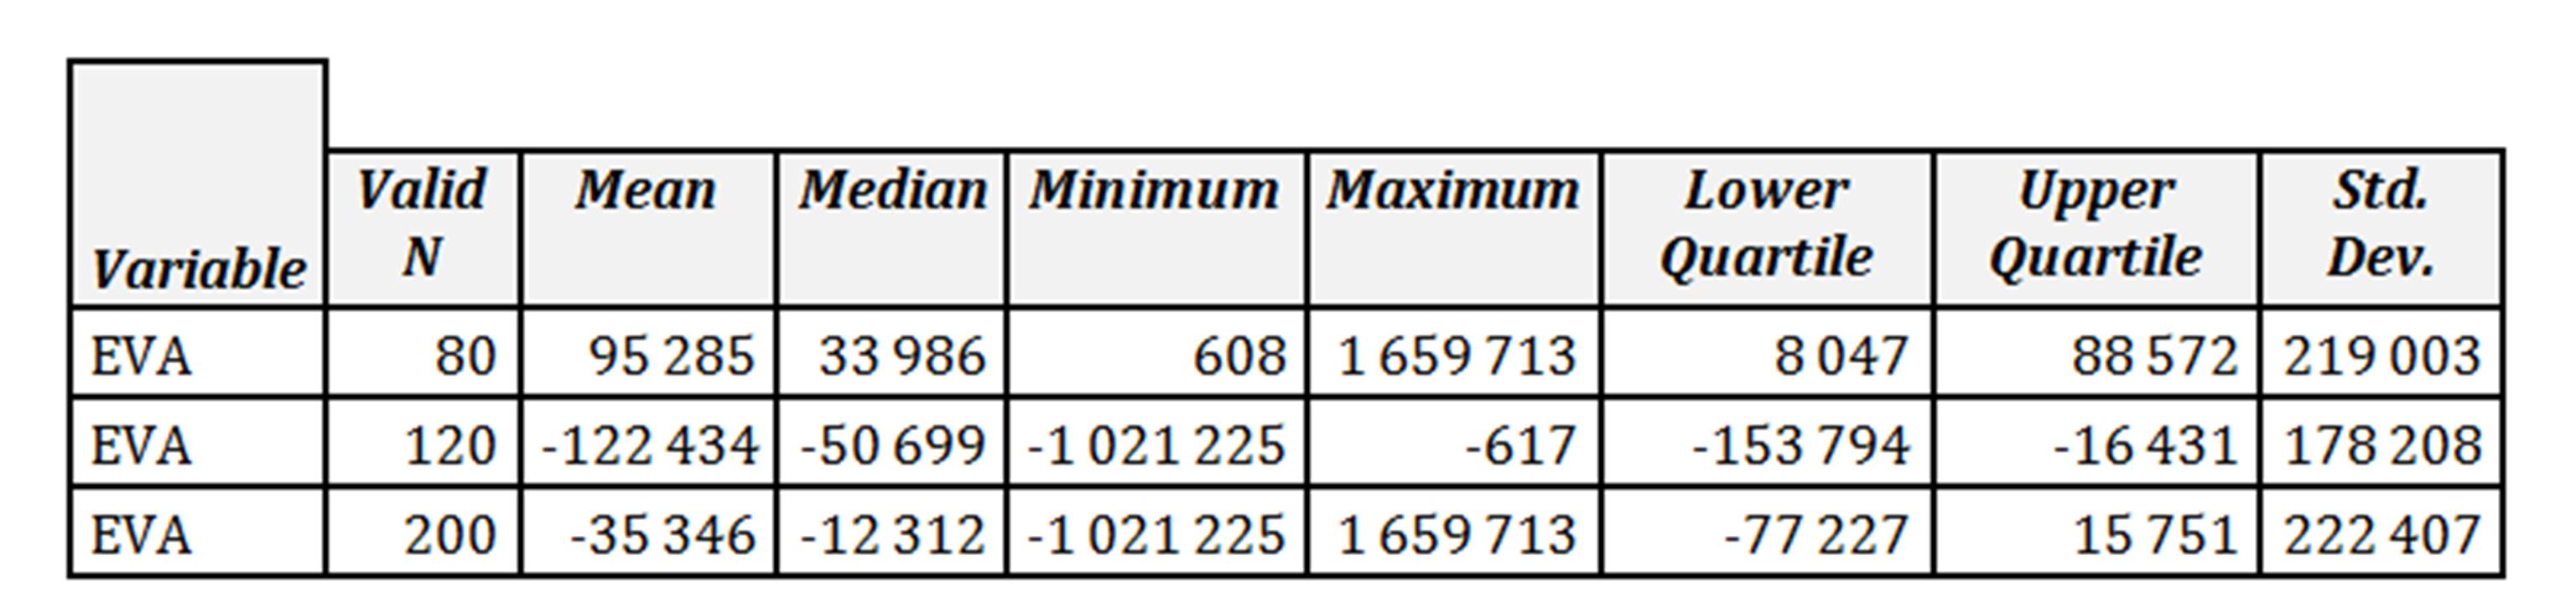
The sample of small and medium-sized food enterprises is divided into two groups of companies. The first group of food enterprises (80 enterprises) represents companies with positive value of the EVA indicator and the second group of enterprises (120 enterprises) consists of companies with negative value of the indicator EVA. Basic statistical values are given in the table below.
Table 2: Descriptive Statistics of indicator EVA
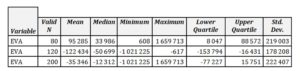
Source: own processing
The performance of analyzed food enterprises was evaluated by EVA indicator, which has several modifications and for our realized analysis we chose the indicator EVA – equity and applied the following relationship:
EVA equity = (ROE – re) x E
where ROE – Return on Equity, E – Equity, re – alternative costs of Equity.
Indicator re – alternative costs of Equity were determined using the CAPM model by prof. Damodaran (2014, 2015) and applied the following relationship:
re = rf + β x ERP + CRP
where rf – Risk Free Rate of Return, β – coefficient of systematic risk, ERP – Equity Risk Premium, CRP – Country Risk Premium.
We have chosen top indicator EVA as the synthetic indicator, in the design of the ratio indicator EVAROS. This choice can be justified by the fact that all the indicators entering correlation analysis are proportional, so the top synthetic indicator is ratio indicator.
As other analyzed parameters, there were selected financial indicators, which were divided into 7 groups:
- the group of liquidity ratios (LIQUIDITY) – Quick Ratio (L1), Current Ratio (L2), Total Ratio (L3), Security Indicator (L4),
- the group of activity and stability indicators (Activities & Stability) – Turnover of Receivables (AS1), the Turnover of Short-term Liabilities (AS2), Stock Turnover (AS3), Debt Ratios (AS4), the Stability of the Enterprise (AS5),
- the group of profitability indicators (PROFITABILITY) – Return on Assets ROA (P1), Return on Equity ROE (P2), Return on Revenues ROR (P3), Return on Sales ROS (P4), Return on Costs (P5), Return on Investment ROI (P6), Return on Long-term Assets (P7) Return on Value Added (P8), Return on Personnel Costs (P9), Share of Total Revenue to Total Capital P(10),
- the group of cost indicators (INTENSITY) – Total Cost Ratio (I1), Manufacturing – consumer Cost Ratio (I2), Personnel Cost Ratio (I3), Depreciation Cost Ratio (I4), Material Cost Ratio (I5), the Economic Cost Ratio (I6),
- the group of efficiency indicators (effectiveness) – Cost Effectiveness (E1), the Effectiveness of Operating Expenses (E2), the Efficiency of Assets (E3), the Effectiveness of Long-term Assets (E4), the Efficiency of Inventory (E5), the Effectiveness of Debt Capital (E6), the Effectiveness of Equity (E7), Material Efficiency (E8),
- the group of commitment indicators (COMMITMENT) – Committed Assets (C1), Committed Long-term Assets (C2), Commitment of Stocks (C3), Committed the Debt Capital (C4), Committed Equity (C5),
- the group of value added indicators (VALUE ADDED) – the Share of Value Added in Sales (VA1), the Share of Value Added in Total Revenues (VA2), Financial Productivity through Added Value (VA3).
Correlation analysis was the tool to reveal the interrelations between indicators for assessing the performance of food enterprises EVAROS and the selected financial indicators and from the statistical tools there was Pearson’s test used. MS Excel 2007 and program STATISTICS was used for processing the interrelations. We applied the Principal Component Analysis (PCA), which is a mathematical statistical method. This method uses orthogonal transformation for transferring elements of the set of observations, which can be shown to be correlated, towards the elements of such a set of values that are linearly uncorrelated.
Results and Discussion
To meet the objective, which was to identify the key performance indicators, it was necessary to construct a correlation matrix. Performance in this matrix was quantified by ratios EVAROS, which is more meaningful than absolute EVA indicator. This indicator provides the new perspective to measure enterprise performance, while identifying key indicators that determine the creation of added value for shareholders.
In the next part of the paper we deliver the results of correlation analysis, into which 41 selected financial ratios were included to confirm statistically significant dependencies on the indicator EVAROS. The analysis was performed for the three selected groups of food enterprises:
- the first group (80 enterprises) – companies with positive value of indicator EVAROS,
- the second group (120 enterprises) – companies with negative value of the indicator EVAROS,
- the third group (200 enterprises) – all the companies analyzed together (positive and negative indicator EVAROS.
The first group of the analyzed enterprises was represented by the enterprises that showed positive value of the indicator EVAROS. For these enterprises, from a total of 41 indicators analyzed above, it was confirmed statistically significant relationship on the indicator EVAROS, in 20 indicators. Proportional relationship to the indicator EVAROS was confirmed in 15 indicators. Inversely proportional relationship to the indicator EVAROS was confirmed at 5 indicators.
The highest proportional statistically significant relationship has been confirmed between the indicators EVAROS and ROS (P4), on the other hand, the highest inversely proportional relationship has been established between the indicator of EVAROS and Total cost ratio (I1). A surprising result was the finding that EVAROS did not show statistically significant relationship to indicator ROE (P2) (it is valid only for the enterprises that have a positive value of the indicator EVA and EVAROS), despite the fact that this indicator participates in the calculation of EVA indicator. There was not confirmed any statistically significant relationship between EVAROS indicator and the company’s liquidity – Current Ratio (L2), Total Ratio (L3), as well as its indebtedness – Debt Ratio (AS4). Based on these results, we can conclude that the indicator EVAROS recognizes directly proportional relationship particularly to the indicators of profitability, namely Return on Sales ROS (P4), Return on Revenue (P3), Return on Costs (P5), Return on Investment ROI (P6), Return on Assets ROA (P1), but also by Cost Effectiveness (E1), in less extent to the Stability of the enterprise (AS6) and the Commitment Assets indicator (C1). The strongest inversely proportional relationship was confirmed between the indicator EVAROS and the Total Costs Ratio of enterprise (I1).
The strongest proportional relationship has been confirmed, as mentioned above, between the indicator EVAROS and the indicator ROS (P4). This result is logical, since these indicators are identical and the difference between them is only in the output parameter. The strongest inversely proportional relationship has been confirmed between EVAROS and Total Cost Ratio (I1), which can be regarded again as a logical consequence, since it is given the lower the cost, the higher the profit and profitability output.
The absence of statistically significant relationship between EVAROS indicator and an enterprise´s liquidity – Current Ratio (L2) a Total Ratio (L3) is due to the fact powerful enterprises with a positive value of the indicator EVA addressing liquidity is meaningless. This is evidenced by average levels of current liquidity of these enterprises, which are an average of 1.23, with the median value of 0.74. The average value of the overall liquidity of the companies is of 1.6, the median of 0.92. These values of the enterprises liquidity suggest that the optimal solution for performance is insignificant. At the same time, it should be noted that for calculating the cost of equity the CAPM methodology was used, which does not accept the impact of liquidity on the amount of the cost of equity. However, even after incorporation binding financial risk to the company’s liquidity in capital costs, the value of enterprise performance would not change, therefore we do support the conclusion that the solution to liquidity for the enterprises with positive values of EVA indicator is irrelevant.
The opposite is the case with solutions to enterprises with the negative value of the indicator EVAROS. In this case, the correlation coefficient of the variable with enterprise liquidity is statistically significant. The correlation coefficient is placed on the 11th position, which may be considered less important location as it is the last statistically significant position in the correlation analysis. Based on the above, it can be concluded that in the case of negative value of the indicator EVA, an enterprise liquidity is an important factor affecting the performance of the enterprise. It is confirmed that in dealing with the poor performance of an enterprise, it must be a priority to solve the liquidity of the enterprise.
If we look at the analysis of the enterprises which have the negative indicator EVAROS in details, we can say that in their case not only statistically significant relationship indicator EVAROS with liquidity ratio has changed, but the number of indicators increased, on which the indicator EVAROS is dependent, especially in the area of inversely proportional dependencies. Total amount of correlation dependencies was 24, including 14 positive and 10 negative.
In this correlation analysis, compared to the analysis of the enterprises with positive value of EVAROS, there were the indicators added with which the indicator EVAROS has a statistically significant relationship, especially in inversely proportional relationship, for example: mentioned Current Ratio (L2) liquidity (average 0.76, median 0.59). In the case of the value of liquidity, we can conclude that it is not optimal; therefore, it is necessary for the increase of performance to increase the value of liquidity. For the dependent variables that were added in inversely proportional correlation relationship, we can mention for example: Debt Ratio (AS4), Committed Assets (C1), Committed Long-term Assets (C2) and in positive correlation with EVAROS there has been added the above-mentioned indicator of Return on Equity ROE (P2). The value of this indicator in that group of enterprises is negative, therefore an important area that needs to be addressed, particularly in those enterprises where the aim is to increase efficiency.
In the case of enterprises with a negative value of the indicator EVAROS, the strongest proportional relationship with this indicator was confirmed with a Cost Effectiveness (E1). The indicator for the enterprises with a positive value of the indicator EVAROS was placed in 5th position. The indicator of ROS occurs at the second position. This is followed by profitability indicators like in the case of enterprises with a positive value of the indicator EVAROS.
If we compare both analyses, the accordance arises in the Return on Costs (P5), that occurs on the third position in the group of indicators with directly proportional relationship with EVAROS indicator namely in the two groups of enterprises. The same accordance is in the case of Return on Investment ROI (P6) at the 7th position of Return on Assets ROA (P1) the 8th position. In the case of inversely proportional dependencies between the selected indicators and EVAROS, the match was found for the variables of Total Cost Ratio (I1) and Economic Cost Ratio (I6). The Total Cost Ratio (I1) (the enterprises with positive value indicator EVAROS achieve cost ratio of 0.95 and the enterprises with negative equity value of EVAROS achieve total expense ratio of 1.02) showed the strongest inverse correlation with relationship with indicators EVAROS, regardless of its value. Therefore, the cost reduction is the right way leading to performance improvement.
Larger shifts in positions occurred in the case of Cost Effectiveness indicators (E1), or/and the Committed the Debt Capital (C4) that occurs in direct proportion according to the indicator EVAROS for the enterprises with a positive value and inversely proportional relationship according to the indicator EVAROS in case of its negative value. It is similar in the liquidity ratio.
Finally, correlation analysis of all analyzed enterprises was elaborated, namely those with positive but also negative value of the indicator EVAROS. The total number of the indicators for which statistically significant relationship with the indicator EVAROS was confirmed is 29. Of these indicators, the directly proportional relationship was confirmed in the case of 19 indicators and at 10 there was confirmed inversely proportional relationship with EVAROS. The increase in the number of correlated variables occurred over previous correlation analyses especially in the area of directly proportional dependencies.
From the complex correlation analysis, it is evident that the most important indicator, with a high correlation coefficient with respect to EVAROS indicator, is the indicator of ROS (P4). From other indicators, the significant ones are the following: Return on Revenues (P3), Return on Costs (P5). Equally important is the indicator of Cost Effectiveness (E1). For the group of major indicators that affect enterprise performance, we have included the indicators of ROI (P6), ROA (P1) and ROE (P2). The indicators affecting enterprise performance, we have included the indicator of Current Ratio (L2) despite its specific results within the analyses. Within inversely proportional correlations, it would be appropriate to pay more attention to the variables with the highest correlation coefficient; it means the Total Cost Ratio (I1), the Economic Cost Ratio (I6), each partial cost, but also Committed Assets (C1) and Debt Ratio (AS4).
On the basis of the mentioned above, we select the group of indicators that will be significant in terms of their statistically significant interdependencies with the indicator EVAROS:
Table 3: Correlations among EVAROS and selected financial indicators
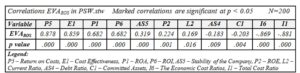
Source: own processing
This selection is represented by indicators of liquidity, activity, capital structure, profitability, efficiency and commitment. We can say that when dealing with poor performance it is needed to give priority to decreasing the costs and increasing profitability. However, this applies only to enterprises which are of optimal value liquidity ratio. If it is not so, then the primary solution for the enterprise performance is to increase the liquidity of the enterprises.
The analysis of principal components was applied in order to find such a set of linear combinations of the original indicators that preserves as much information on these indicators as possible. By this procedure it is achieved that it is possible to study the problem in a research subspace of smaller dimension, which is of great importance for further analysis of the statistical type (hypothesis testing, confidence search areas, graphs observation, and the like).
To determine the principal components that can be used, Kaiser – Guttman criterion may be used according to which all the eigenvalues whose values are greater than 1 are taken into account. The second criterion for the selection of the principal components is variability, % of respectively the total variance, which should be at 70 – 90 %.
Based on the results of the correlation analysis, we decided to apply the method of multidimensional analysis (PCA Principal Component Analysis). For the input variables for analysis PCA were 11 indicators – Return on Costs (P5), Cost Effectiveness (E1), ROA (P1), Stability of the Company (AS5), ROE (P2), ROI (P6), Current Ratio (L2), Debt Ratio (AS4), Committed Assets (C1), The Economic Cost Ratios (I6), Total Cost Ratio (I1) and EVAROS.
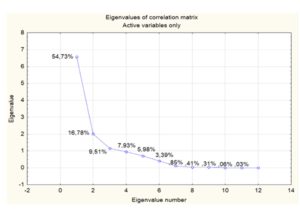
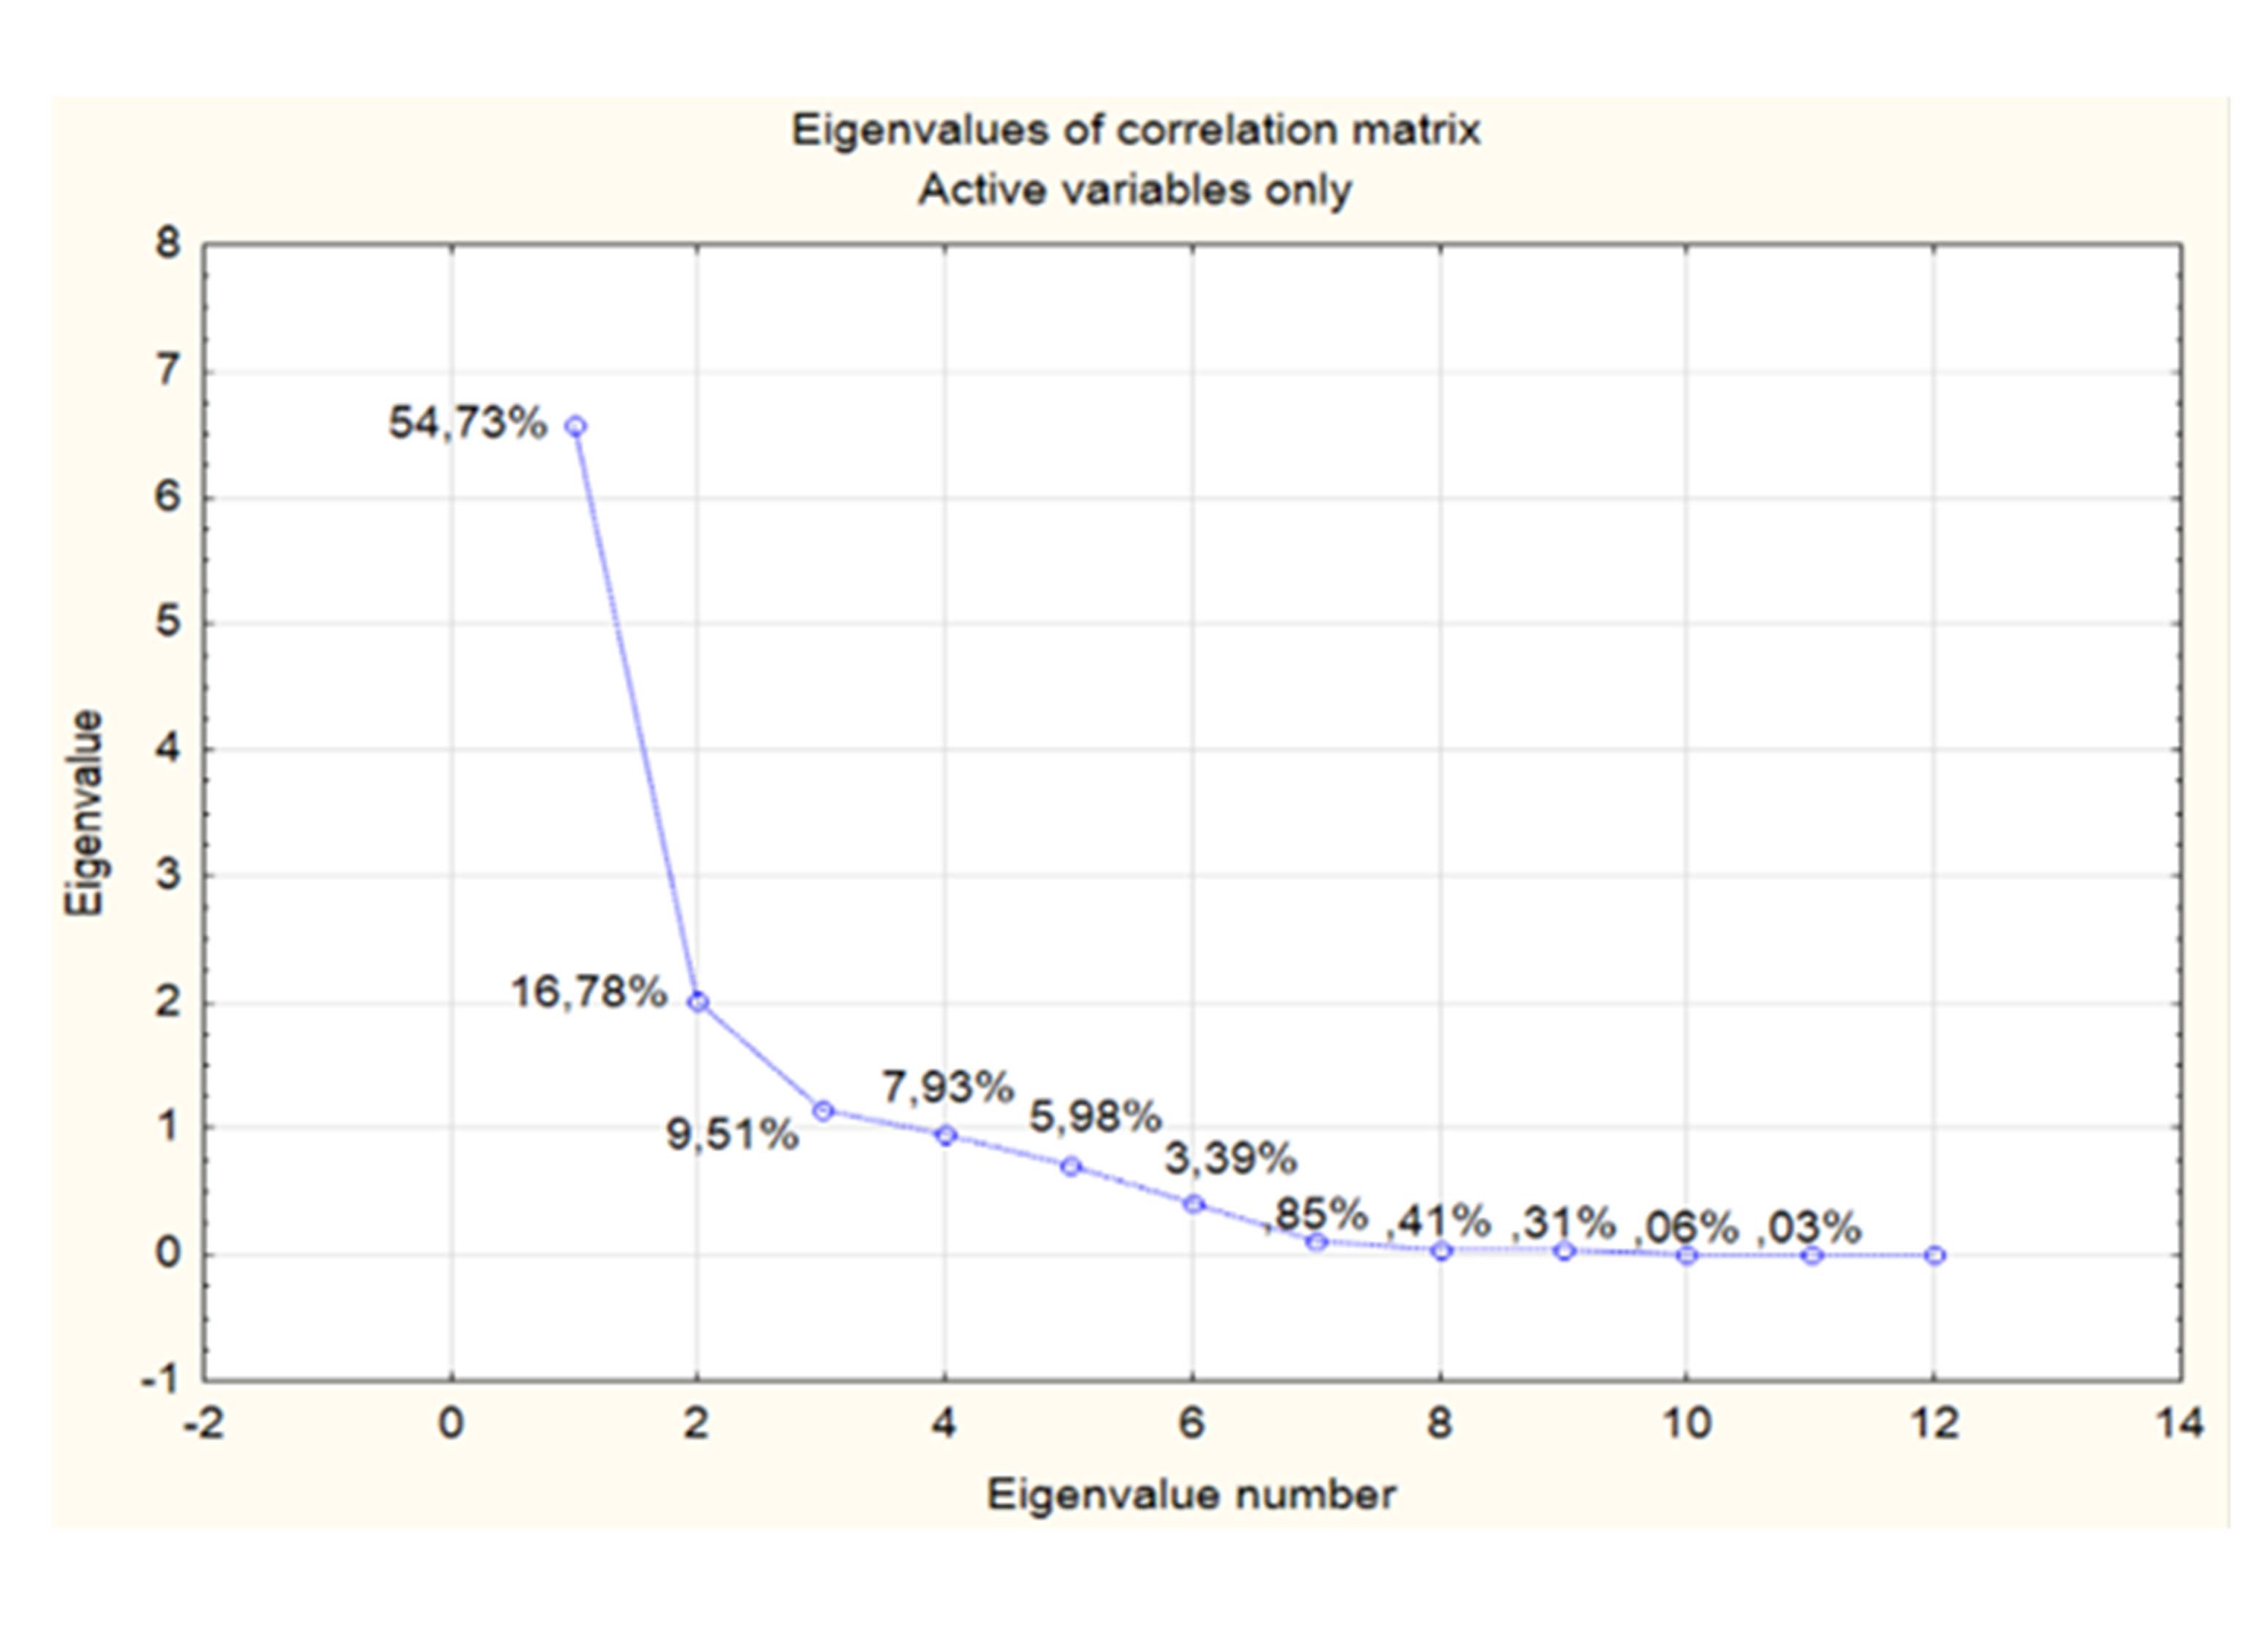
Fig 1: Index graph of eigenvalues
Source: own processing in STATISTICA
From the scree plot (Figure 1 Index graph of eigenvalues) by Kaiser – Guttman criterion based on the orthogonal transformation it was possible to create a set of two principal components. The two principal components comprise 71.516 % of the variance (71.516 % maintaining information of the original file), thus fulfilling the criteria for determining the principal components. In what follows, therefore, we are working with two components.
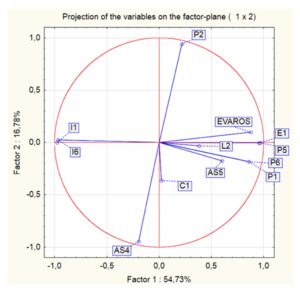
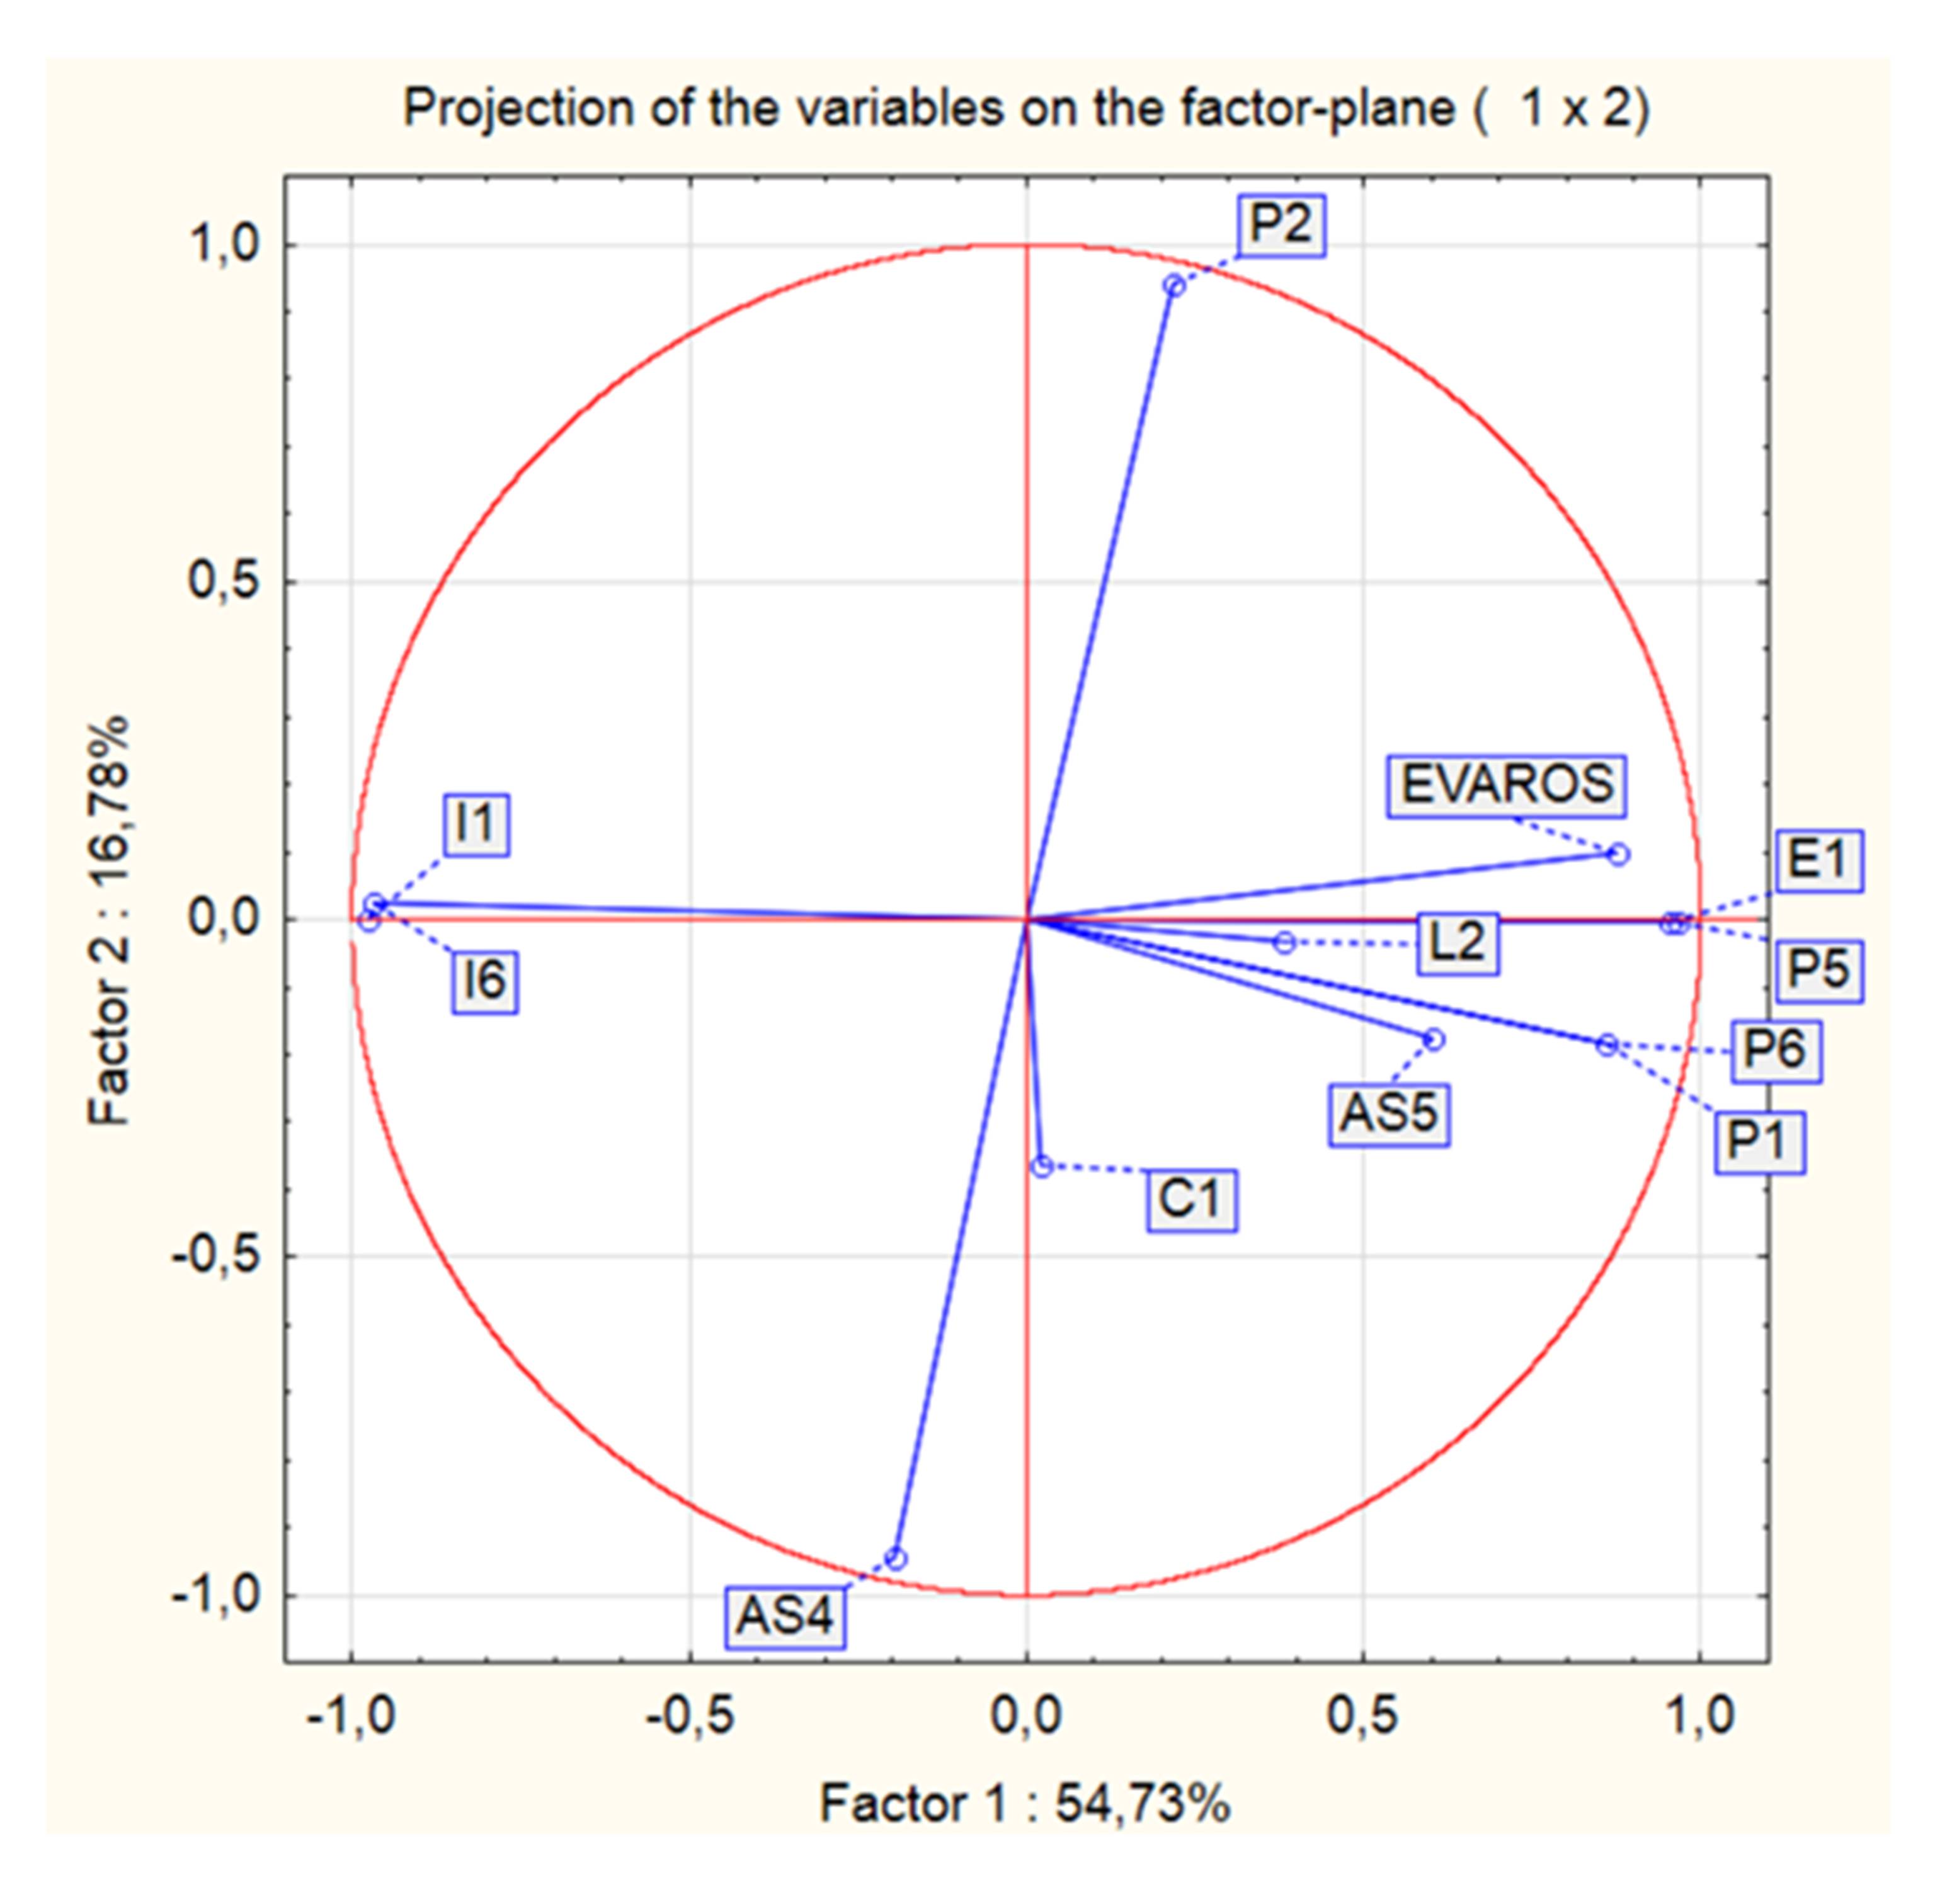
Fig 2: Projection of the variables on the factor – plane
Source: own processing in STATISTICA
We constructed the chart of component scales for the two principal components. The graph shows that in case component 1 is the strong relationship of the Return on Costs (P5), Cost Effectiveness (E1), ROI (P6), ROA (P1), EVAROS indicators, weaker direct relationships is to the Stability of the Company (AS5), the weakest proportional relationship is in the case of Current Ratio (L2). On the other hand, a strong inversely proportional relationship is to the indicators Total Cost Ratio (I1) and Economic Cost ratio (I6). Weak relationship is inversely proportional to the indicator Debt Ratio (AS4). In the case of component 2 it is a strong direct relationship to the indicator ROE (P2) and a strong inverse dependency correlation with indicator Debt Ratio (AS4). Weak inversely proportional relationship is to the indicator Committed Assets (C1).
The above analysis shows that we have managed, from the large set of analyzed performance indicators to create a set of two principal components. While 71.516 % information was retained from the original file. It was confirmed that the performance of the industry is primarily dependent on cost, efficiency and profitability of inputs. Although the financial models to optimize performance underline the importance of liquidity for the enterprises we analyzed, there were completely confirmed. Attention is drawn to non-the standard location of the current liquidity and asset commitment made in the correlation analysis. This result can be partially justified by selecting the CAPM for calculating the cost of equity capital, which does not accept the financial risk, expressed by the enterprise´s liquidity.
Conclusion
In this paper, we addressed the analysis and identification of key performance indicators of the selected Slovak food enterprises through selected statistical methods – correlation analysis and multivariate analysis PCA.
From the 41 selected financial indicators applying correlation analysis, we have identified the following 11 key financial performance indicators of the food enterprises: Return on Costs (P5), Cost Effectiveness (E1), ROA (P1), Stability of the Company (AS5), ROE (P2), Current Ratio (L2), Debt Ratio (AS4), Committed Assets (C1), The Economic Cost Ratios (I6), Total Cost Ratio (I1), that positively or negatively affect the indicator EVAROS belonging to modern tools for assessing enterprises performance.
Based on PCA analysis, we created a set of 41 analyzed indicators to assess the performance of the enterprise with a set of two principal components with 71.516 % variability. For further research of the relationships and effects on certain financial areas of the enterprise on the financial performance, it would be appropriate to repeat the analysis with the new selection of indicators, or/and with the full set of input indicators. Equally, it would be useful to focus the analysis on the liquidity research of the given industry area.
Acknowledgements
This article is one of the outputs of project VEGA 1/0791/16 “Modern approaches to improving enterprise performance and competitiveness using the innovative model – Enterprise Performance Model to streamline Management Decision-Making Processes” and project APPV-15-0322 “Competitiveness, economic growth and firm survival”.
(adsbygoogle = window.adsbygoogle || []).push({});
References
- DAMODARAN, A. (2014), ‘Equity Risk Premiums: Looking backwards and towards,’ [Online], [2014-06-29], Available: http://pages.stern.nyu.edu/~adamodar/
- EFQM (1999), Excellence Model [Online]. [2015-10-15]. Available: http:/www.efqm.org/award.htm
- FROST, W. (2005), ABCs of Activity Based Management. Iuniverse.
- HOSTETTLER, S. (1998), Economic Value Added (EVA): Darstellung und Anwendung auf Schweizer Aktiengesellschaften, 3. vydanie, St. Gallen.
- HYRANEK, E., GRELL, M. and NAGY, L. (2014), New trends in enterprise performance measurement for the needs of financial decisions. Bratislava: Ekonom.
- KISLINGEROVA, E. et al. (2011), New Economy. New opportunities? Praha: C. H. Beck.
- MARIK, M. and MARIKOVA, P. (2005), Modern methods of performance evaluation and enterprise valuation. Praha: EKOPRESS.
- PETRIK, T. (2009), Economic and financial management of the company. Praha: Grada Publishing.
- ROTTGER, B. (1994), Das Konzept des Added Value ales Maßstab für finanzielle Performance, dissertation thesis. Kiel.
- StatSoft, Inc. (2013), STATISTICA (data analysis software system), version 12. statsoft.com.STEWART, G. B. (1991), The Quest for Value, USA, pp. 800.
- WAGNER, J. (2009), Performance measuring. Praha: GRADA Publishing.